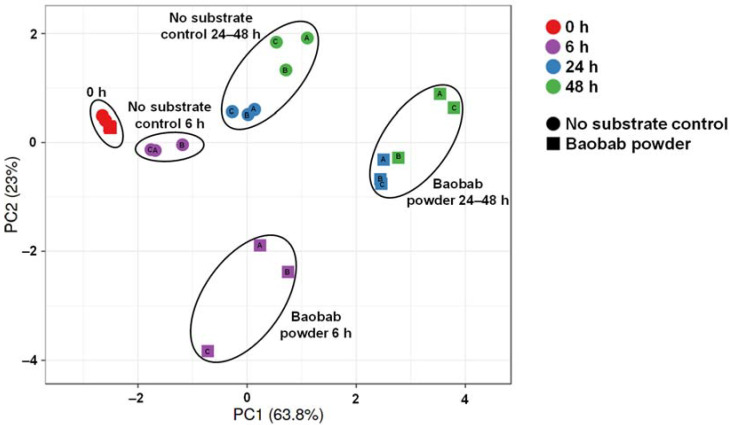
Figure 2.
Principal component analysis (86.8%) of the metabolic activity data recorded along the 48 h incubations (pH, gas, acetate, lactate, propionate, butyrate, bCFA). Different symbol shapes indicate different conditions (‘no substrate control’ vs. baobab fruit pulp powder), while different colors reflect different timepoints. Letters inside symbols refer to the respective donor (A, B, or C).

