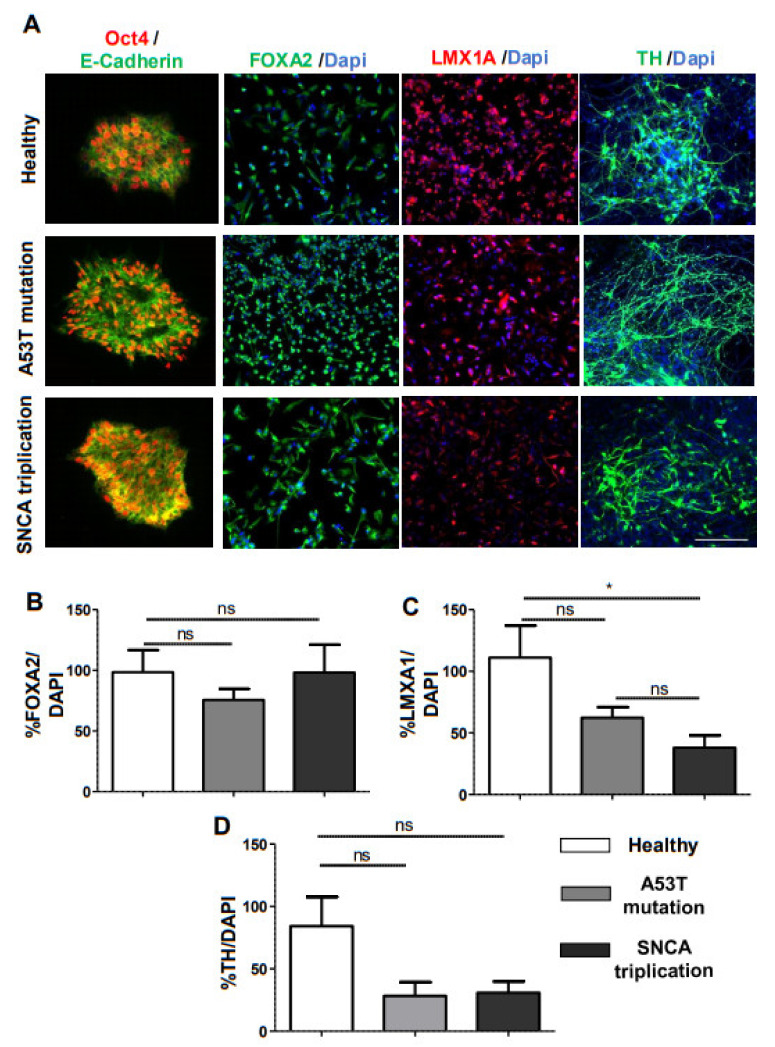
Figure 2.
Characterization of iPSC-derived mDA neurons from a healthy subject and fPD patients. (A) We performed immunostaining with stem cell markers Oct4 and E-cadherin at day 0, midbrain neural precursor marker FOXA2 and LMX1A at day 11, and dopaminergic neuronal marker TH for healthy human and fPD patients (A53T mutation and SNCA triplication) at day 30. Next, we quantified the levels of immunostaining for (B) FOXA2, (C) LMXA1A, and (D) TH in healthy and fPD lines using image analysis. Images are representative of at least three independent differentiations. All data in the graphs are presented as mean ± standard error of the mean (SEM) of three images acquired from three different coverslips. Data were analyzed by one-way analysis of variance (ANOVA) followed by Tukey’s multiple comparison post hoc test. * p < 0.05; Scale bar is 100 µm.

