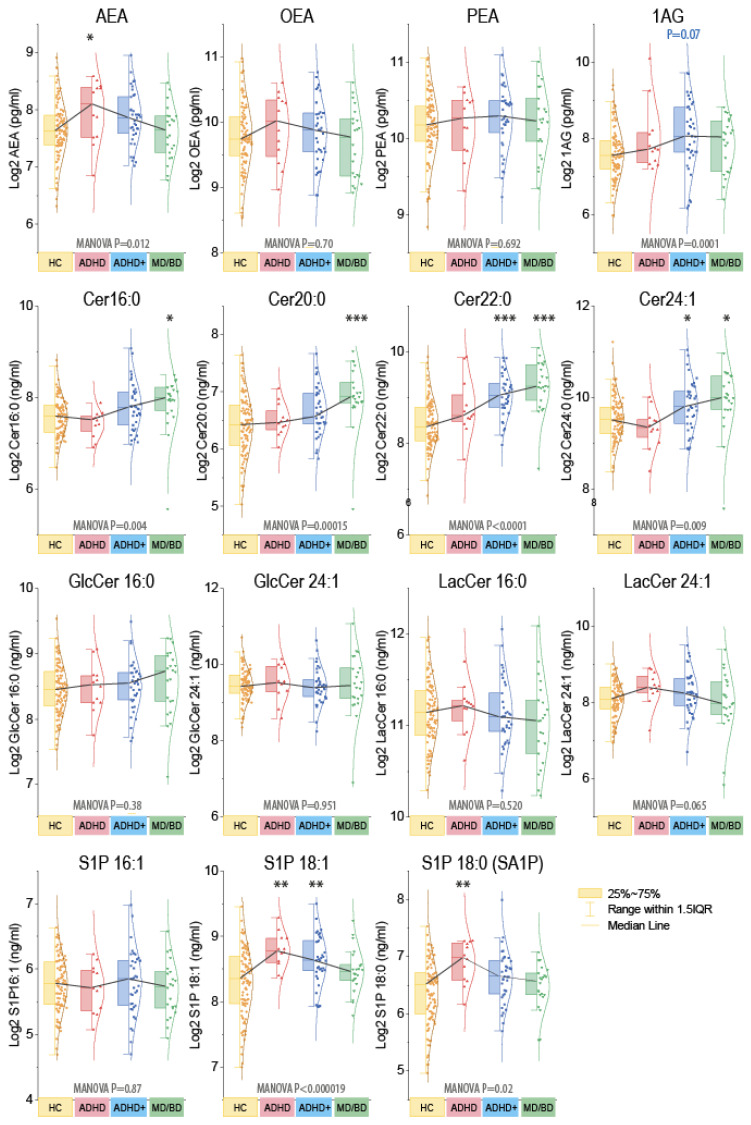
Figure 2.
Grouped plasma concentrations of endocannabinoids and ceramides. The box plots show the interquartile range (IQR). The black line connects the medians. The scatters are the subjects, and the whiskers show the range within 1.5× the IQR. The Gauss curves show the distribution. The data are log2 transformed because lipids were log-normally distributed. Endocannabinoids are pg/mL, sphingoid bases, and ceramides ng/mL. Because of the impact of sex for endocannabinoids (Supplementary Figure S2), data were compared with MANOVA for the factors “group” X “sex” and subsequent posthoc for the group using an adjustment of alpha according to Dunnett, i.e., versus HC. Asterisks indicate significant differences versus HC, * p <0.05, ** p <0.01, *** p <0.001. Samples sizes: n = 12 attention-deficit/hyperactivity disorder (ADHD), n = 37 ADHD with comorbidity (ADHD+), n = 22 major depression of bipolar disorder (MD/BD), n = 98 healthy controls (HC).

