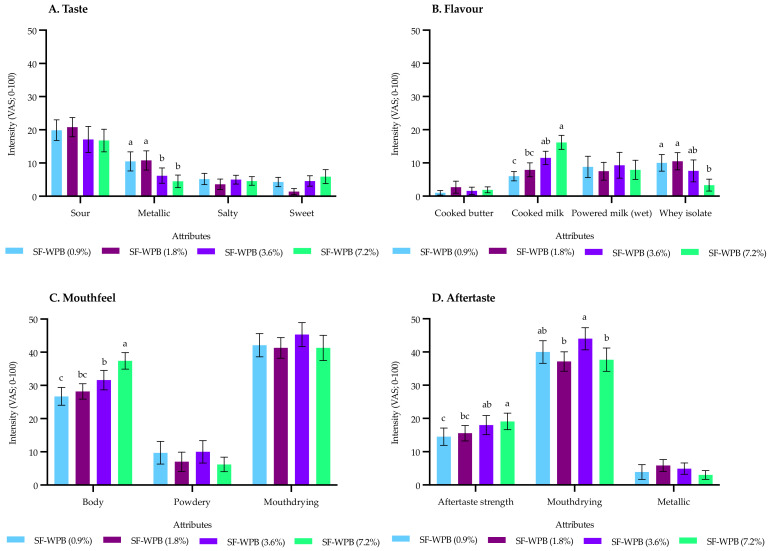
Figure 2.
Influence of fat content on the sensory profile of whey protein liquid models (SF-WPB: sugar-free whey protein beverage). Data represents means of two replicates ± standard error from trained sensory panel (n = 11) measured on visual analogue scales (VAS; 0–100). Differing small letters represent sample significance from multiple comparisons and brackets after sample name denote specific fat content expressed as % w/v. All attributes are fully defined in Table 3.

