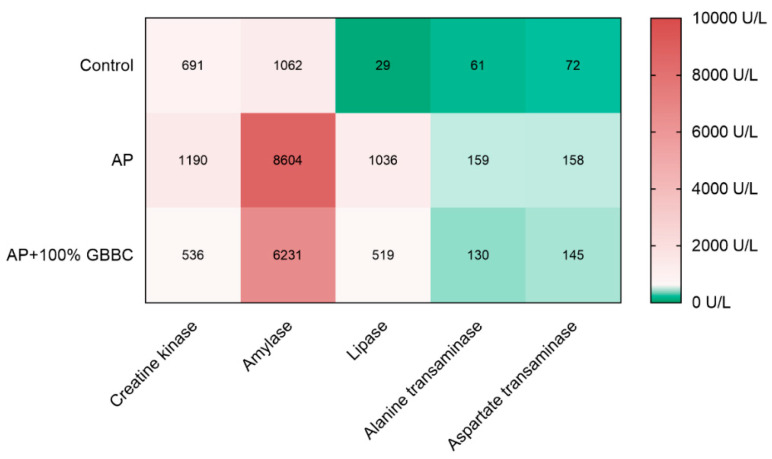
Figure 3.
Heat map showing the relationship between various metabolic enzyme activities measured in healthy mice, mice with evoked acute pancreatitis (AP), and AP mice after administration of 100% GBBC. Hues of colors (from dark green (bottom scale) to faded red (top scale)) are represented by mean values.

