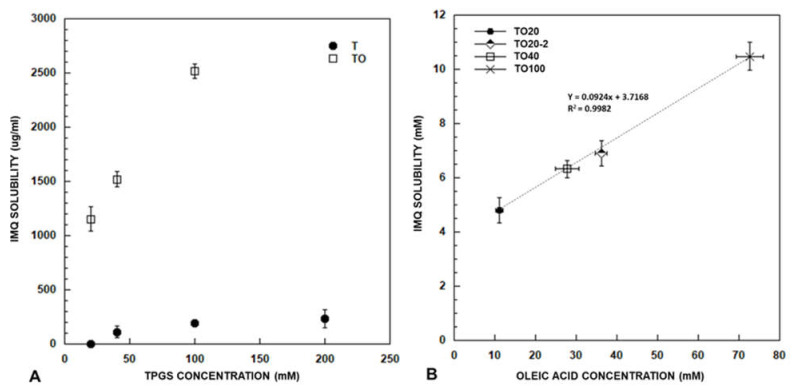
Figure 2.
Panel (A) represents IMQ solubility (mean ± SD) in TPGS at concentration of 20, 40, 100 e 200 mM with (TO) and without oleic acid (T). Panel (B) reports the correlation between oleic acid concentration (mM; mean ± SD) and IMQ solubility (mM; mean ± SD) in micelles with TPGS at concentration of 20 (produced by using both method 1 and 2), 40 and 100 mM (produced by using method 1).

