Figure 2.
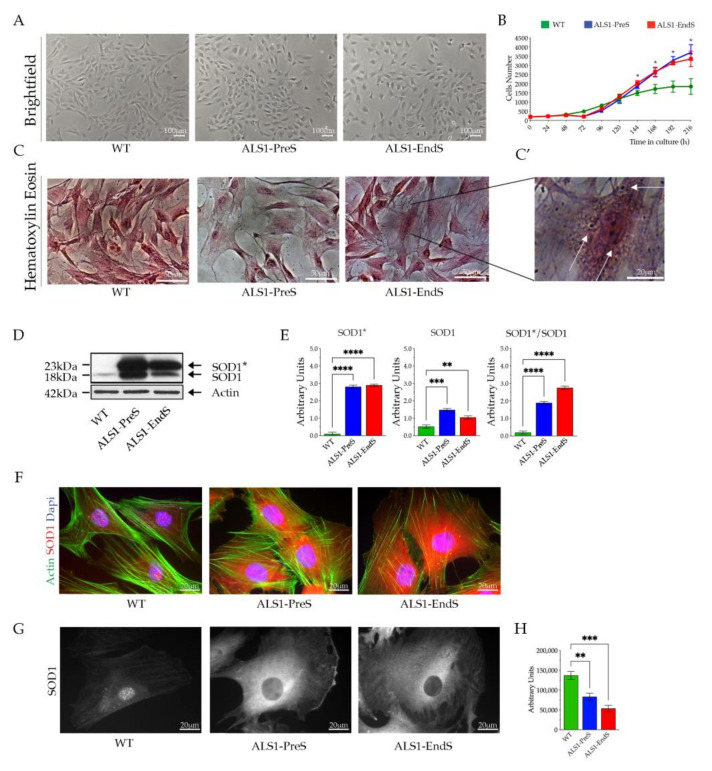
Expression of SOD1* in rFFFs. (A) Representative brightfield images of WT, ALS1-PreS, and ALS1-EndS fibroblasts. Scale bar = 100 mm. (B) Growth curve of diseased and WT rFFFs. Each point represents the mean of three technical replicates; * p < 0.05. (C) Representative images of Hematoxylin/Eosin (Scale bar = 50 mm) and (C’) high magnification of the ALS1-EndS cells. Scale bar = 20 mm. (D) Representative Western blotting analysis of naïve SOD1 and human mutant SOD1* in ALS1 and WT rFFFs. (E) Densitometric analysis of the SOD1*, SOD1, and SOD1*/SOD1 ratio. Results are reported as mean ± SD. ** p < 0.01, *** p < 0.001, **** p < 0.0001. (F) Representative immunofluorescences of SOD1 expression (anti-SOD1; red) and F-Actin staining (Alexa-fluor-488 Phalloidin, green); Nuclei (4′,6-diamidino-2-phenylindole, DAPI, blue), Scale bar = 20 µm. (G) Representative confocal images of immunofluorescence of SOD1 (anti-SOD1) in the rFFFs cells. Scale bar = 20 µm and (H) nuclear SOD1 fluorescence quantification.

