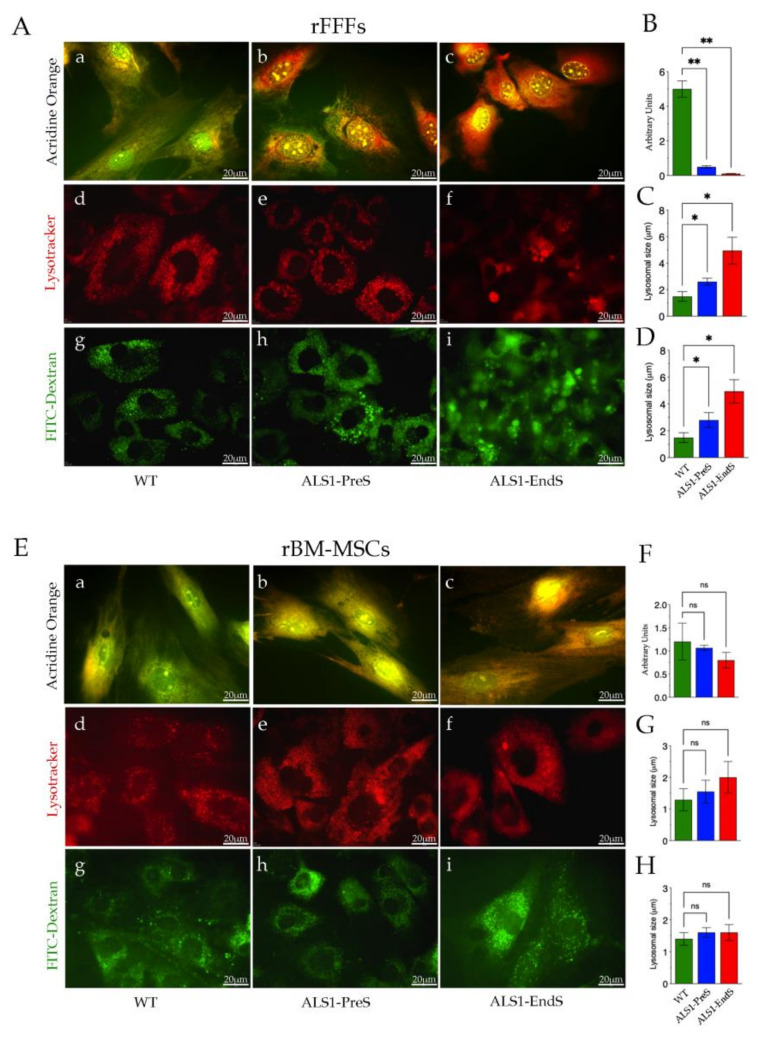
Figure 7.
Lysosomes homeostasis and size in rFFFs (A–D) and rBM-MSCs (E–H) from ALS1 and WT rats. (A,a–c;E,a–c) Representative images of Acridine Orange staining. Scale bar = 20 μm. (B,F) Quantification of the staining of Acridine Orange (see Method Section 2.11 and Figure S5 in Supplementary File for details). (A,d–f;E,d–f) Representative images of Lysotracker staining (Scale bar = 20 μm.) and (C,G) related quantification (see Section 2.11 for details). (A,g–i; E,g–i) Representative images of FITC-Dextran staining (Scale bar = 20 μm), and (D,H) the quantification plot (see Method Section 2.11 and Figure S5 in Supplementary File for details). All reported results are the mean ± SD of three independent experiments. ns, not significant, * p < 0.05, ** p < 0.01.

