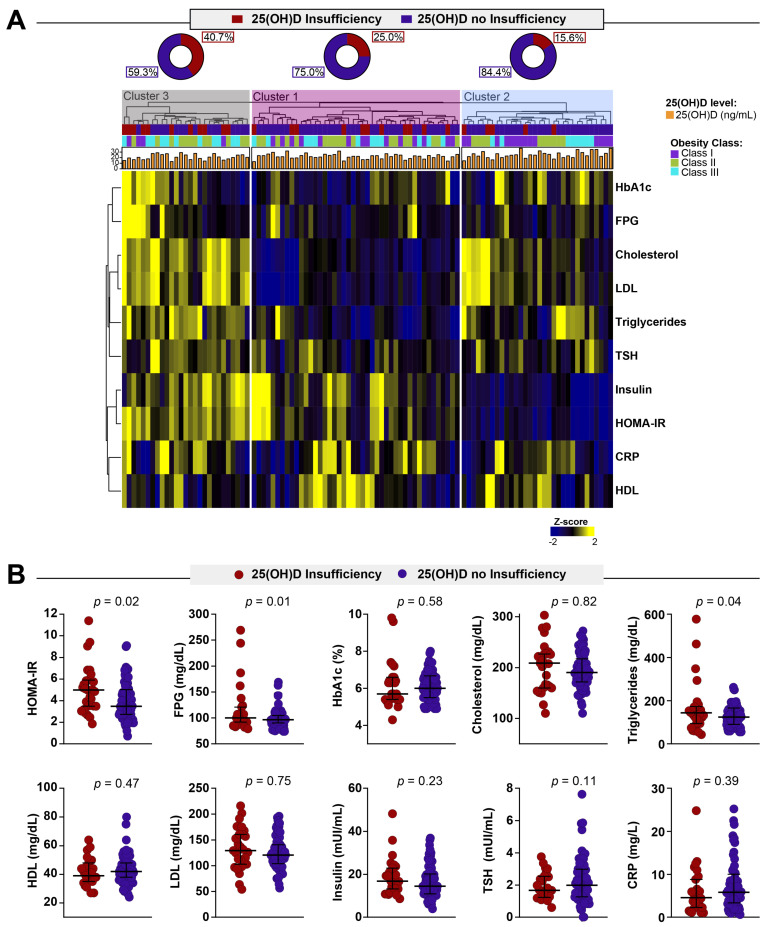
Figure 2.
Biochemical profiles of obese women stratified by 25-hydroxyvitamin D status. (A) Value of each parameter was log10 transformed. Mean values for each indicated clinical group were z-score normalized, and a hierarchical cluster analysis (Ward’s method with 100xbootstrap) was performed to illustrate the overall biochemical profiles. (B) Data represent median and interquartile ranges. The Mann–Whitney U test was employed to compare the values detected between the study subgroups. Abbreviations: FPG = Fasting plasma glucose; HbA1c = Glycated hemoglobin; HDL: High-density lipoprotein; LDL = Low-density Lipoproteins; TSH = Thyroid-stimulating hormone; C-RP = C-reactive protein; 25(OH)D = 25-hydroxyvitamin D.

