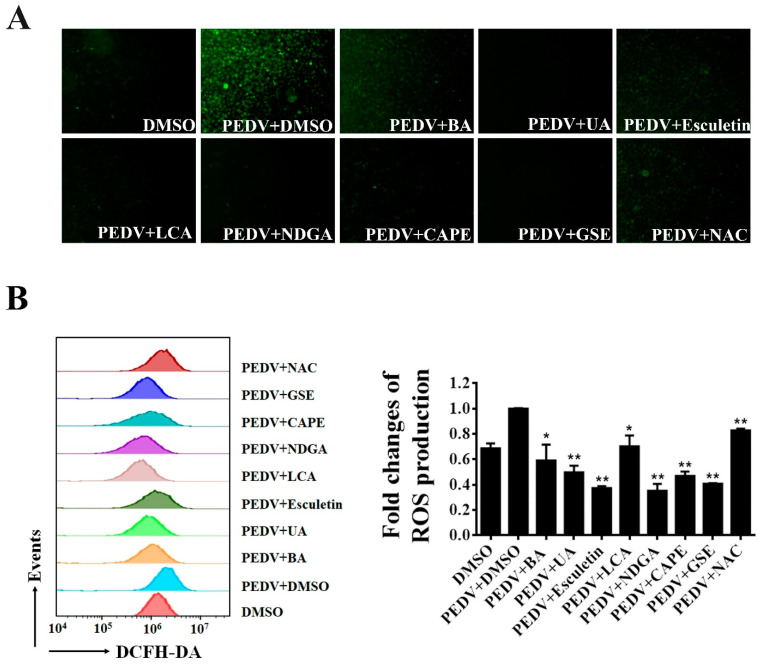
Figure 6.
The inhibition of PEDV-induced ROS by identified antioxidants. Vero cells were treated with each antioxidant at the concentration of 10 μM, and then infected with wild-type PEDV at a MOI of 0.01. NAC (50 μM) and DMSO were used as the positive and negative controls. At 16 h post-infection, the cells were stained with DCFH-DA and intracellular ROS generation was examined by a fluorescence microscope (A) or flow cytometry (B). The relative ROS levels were calculated by the DCFH-DA fluorescence intensity in PEDV-infected cells. Mean ± SDs from three independent experiments are displayed. * p < 0.05 and ** p < 0.01 vs. PEDV-infected cells treated with DMSO (unpaired Student’s t-test).

