INTRODUCTORY PARAGRAPH
Despite initial responses1-3, most melanoma patients develop resistance4 to immune checkpoint blockade (ICB). To understand the evolution of resistance, we studied 37 tumor samples over 9 years from a metastatic melanoma patient with complete clinical response to ICB followed by delayed recurrence and death. Phylogenetic analysis revealed co-evolution of 7 lineages with multiple convergent, but independent resistance-associated alterations (RAAs). All recurrent tumors emerged from a lineage characterized by loss of chromosome 15q, with post-treatment clones acquiring additional genomic driver events. Deconvolution of bulk RNAseq and highly-multiplexed immunofluorescence (t-CyCIF) revealed differences in immune composition amongst different lineages. Imaging revealed a vasculogenic mimicry phenotype in NGFR-High tumor cells with high PD-L1 expression in close proximity to immune cells. Rapid autopsy demonstrated 2 distinct NGFR spatial patterns with high polarity and proximity to immune cells in subcutaneous tumors versus a diffuse spatial pattern in lung tumors, suggesting different roles of this neural crest-like program in different tumor microenvironments. Broadly, this study establishes a high-resolution map of the evolutionary dynamics of resistance to ICB, characterizes a de-differentiated, neural crest tumor population in melanoma immunotherapy resistance, and describes site specific differences in tumor-immune interactions via longitudinal analysis of a melanoma patient with an unusual clinical course.
Immune checkpoint blockade (ICB) has revolutionized cancer therapy across multiple solid tumor types. While 40-45% of patients with metastatic melanoma respond to PD-1 blockade1-3, the majority succumb due to primary, adaptive, or acquired resistance4. A diverse set of resistance mechanisms have been identified including beta-catenin activation5, PTEN loss6-8, loss of antigen presentation machinery9,10, impaired interferon gamma responsiveness9,11, genome instability and aneuploidy12,13, cell-cycle dysregulation14, and phenotype selection15-17. How these mechanisms emerge, interact, and contribute to resistance within patients remains poorly understood. Longitudinal tumor samples enable study of the time-course of response, shedding light on tumor heterogeneity18, tumor evolution, and acquired resistance. Previous studies have demonstrated intratumoral heterogeneity in many solid tumor types including melanoma19-23, and some studies have sequenced tumors longitudinally to examine evolution of resistance to chemotherapy24,25, targeted therapy26, and immunotherapy10,13. We generated a unique dataset of 37 longitudinally collected tumors to investigate the evolution of ICB resistance from a responder to ICB with eventual recurrence and death from disease across 9 years including the primary tumor, metastatic recurrence, pre-treatment, on-treatment, post-progression, and rapid autopsy time points. While previous efforts have focused on sequential tumor analysis in ICB27,28 with limited modalities (e.g. immune markers, microenvironment) or spans a limited clinical timeframe, our study represents the largest and most in-depth study of tumor and microenvironmental evolution of an individual across all phases of his melanoma treatment from diagnosis to rapid autopsy. We performed whole-exome sequencing (WES), RNA-seq, and highly-multiplexed protein immunofluorescence (t-CyCIF; Methods, Fig. 1, Supplementary Table 1). The patient’s clinical course is detailed in Fig. 1a.
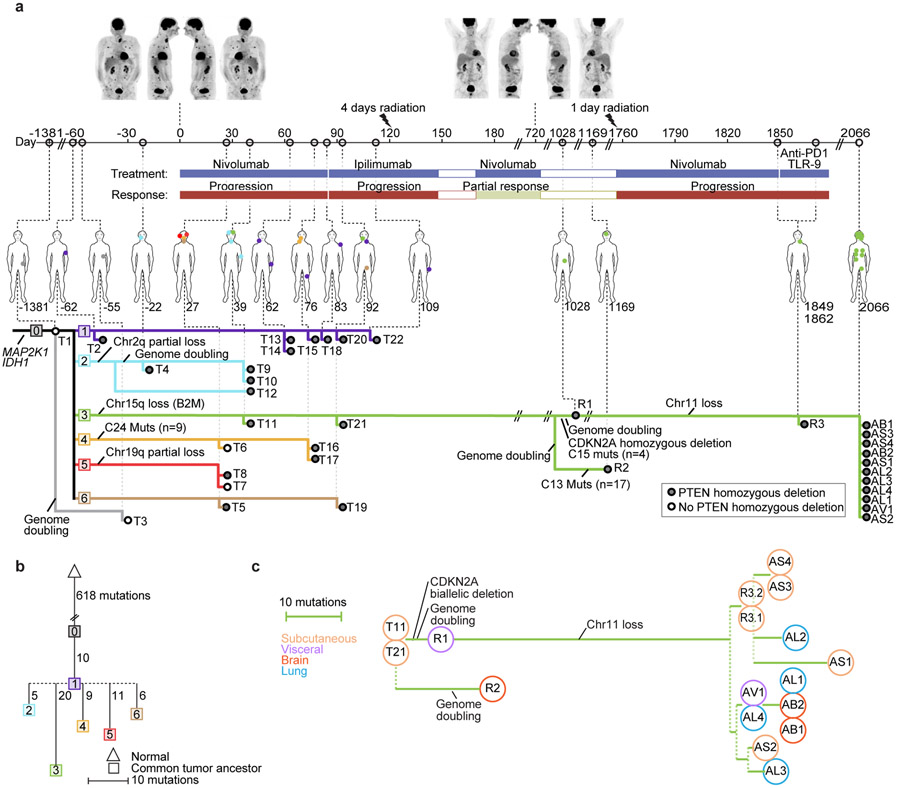
Figure 1. Integrated Clinical Course and Phylogenetic Characterization of Longitudinal Tumor Biopsies.
(a): Clinical Course (upper): Numbers on the timeline indicate days relative to initiation of immune checkpoint blockade (ICB). Above, PET-CT images taken at (1) time of initial metastatic recurrence pre-ICB treatment; and (2) completion of 2 years of ICB. Briefly, the patient was a 67-year-old man with stage IIB nodular melanoma treated with wide excision and negative sentinel lymph node biopsies that recurred 2.5 years later with widespread disease to subcutaneous lesions, lungs, lymph nodes, and visceral lesions. He was enrolled into a trial of sequential ICB15, and had a heterogeneous response with overall rapid progressive disease on initial 6 cycles of nivolumab and again on 4 cycles of ipilimumab and underwent palliative radiation of bone metastases. Coinciding with maintenance nivolumab (D182), he experienced an abrupt, precipitous response, completing 2 total years of ICB, and was considered a complete clinical responder. In the next year, he developed autoimmune nephritis requiring high-dose steroids, and subsequently had an isolated jejunal metastasis and occipital brain lesion resected. Two years later, he had widespread metastatic recurrence resistant to subsequent therapy, including re-trial of nivolumab, anti-PD1 therapy + TLR9 agonist, carboplatin and paclitaxel, and died of his disease approximately 1 year after metastatic recurrence. See Methods for full clinical course.
Phylogenetic Analysis from whole-exome sequencing (WES) (lower): Each dot represents a different tumor biopsy (with physical location on the figure above), and each colored line represents a tumor lineage with shared genomic alterations as indicated. We inferred 7 different tumor lineages (labelled 0 through 6) pre-existing at treatment initiation Phylogenies and lineages were inferred using point mutations and copy number events (Methods, Extended Data Figs. 4,5; Supplementary Fig 1)).
(b) Phylogenetic Relationships between Lineages: The most recent common ancestor (MRCA) for each lineage and their relationships was inferred . Distances are based on the number of different mutations, including gained and lost mutations (via deletion of chromosomal segments).
(c): Detailed Phylogenetic Relationships of Lineage 3: The phylogenetic relationships of tumors in the resistant lineage (Lineage 3) are depicted, with phylogenetic distance based on the number of gained and lost mutations.
Phylogenetic analysis integrating single nucleotide variants and copy number alterations (Methods) demonstrated a common tumor ancestor with a mutational spectrum consistent with UV damage, 618 shared mutations, driver hotspot mutations in IDH1 (p.R132C) and MAP2K1 (MEK1; p.E203K), and mutations in the cancer driver genes CTNNB1 (β-catenin; p.R582W) and ARID2 (p.P1664S)) (Extended Data Fig. 1, and Extended Data Fig. 2). No driver mutations in BRAF, NF1, or NRAS/HRAS/KRAS were detected. All tumors shared loss of heterozygosity (LOH) in segments of chromosome 3q, 6q, 9, 10, and 20 (Extended Data Fig. 3), which spanned tumor suppressors (CDKN2A/B; PTEN), interferon-gamma pathway genes (IFNGR1; JAK2), and the chromatin remodeler gene ARID1B. Analysis revealed the co-existence and evolution of seven lineages at therapy onset, each having distinct genomic features (Fig. 1ab, Extended Data Figs. 3-5, Supplementary Fig. 1), including whole genome doubling, loss of allelic chromosomal segments, and gains of mutational clusters, with the most recent common ancestor being the primary tumor. Lineage 0 (n=1) was characterized by a genome doubling of the original primary clone in a recurrent lesion observed nearly four years later. All other lineages descended from a non-genome doubled subclone with 10 additional mutations. Lineage 1 (n=8 tumors) exhibited substantial spatial and temporal heterogeneity with the most recent common ancestor (MRCA) the common ancestor of Lineages 1–6 without additional distinguishing copy number alterations or mutations. Lineage 2 (n=4) included one pre-treatment tumor, was characterized by an early LOH of part of chromosome 2q, followed by a genome doubling event in 3/4 tumors in the lineage. Lineage 3 (n=16) included bowel and brain early recurrences and all subsequent treatment-resistant lesions and was characterized by an allelic chromosome 15q deletion. Lineage 4 (n=3) was limited to the head and neck and shared a cluster of 9 distinct acquired mutations. Lineage 5 (n=2) was found at one time point (D29) co-located spatially and was characterized by partial allelic loss of chromosome 19q. Lineage 6 (n=2) spanned two skin lesions on (chin: D27; left groin: D92) with 6 distinct acquired mutations. The relationships between the MRCA of each lineage are shown in Fig 1b and highlight the diversity and continued evolution of melanoma within a single patient.
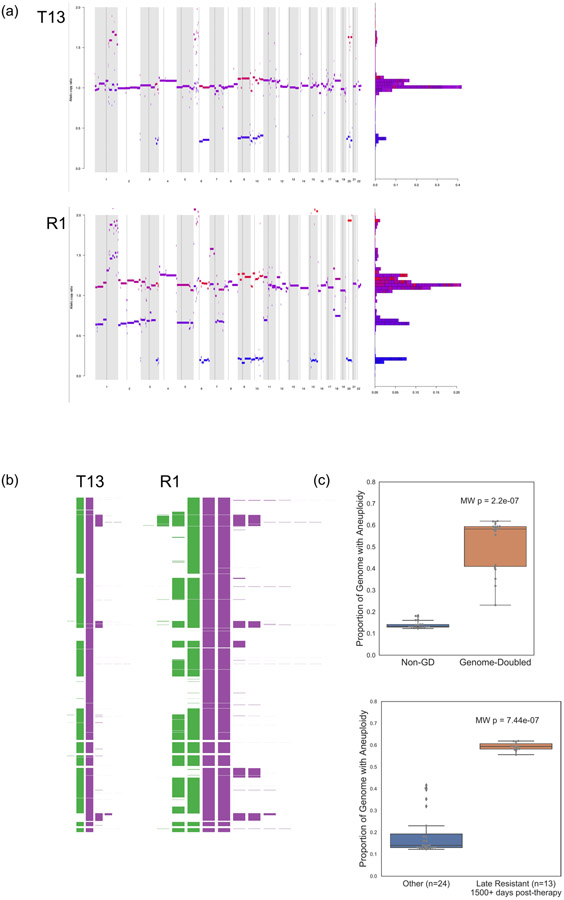
Across all lineages, we observed multiple genomic RAAs. Nearly all tumors (33/37) had a homozygous deletion in PTEN (Supplementary Table 1) arising from a common LOH of chromosome 10 with a focal deletion of a ~500KB region overlapping PTEN. In 19 tumors PTEN was examined via immunohistochemistry (IHC) and all were negative including two tumors without PTEN homozygous deletion (Supplementary Fig. 2), suggesting multiple routes to a PTEN-null phenotype. Post-treatment resistant lesions arose out of lineage 3, distinguished by regional loss of 15q, including B2M required for MHC-I antigen presentation10. Notably, we found four independent whole genome duplication events: (1) in the common ancestor of three tumors (T4, T9, T10) in lineage 2 prior to ICB, (2) twice in lineage 3 (small bowel metastasis and brain metastasis independently) distinguishing the post-treatment resistant tumors from earlier tumors in the lineage, and (3) in lineage 0 prior to ICB. Tumors with genome doubling had evidence of increased chromosomal instability with higher aneuploidy29, which has been associated with immunotherapy resistance12 (Mann-Whitney p<0.001) (Extended Data Fig. 6).
“Early” resistant lesions (small bowel [R1, D1028] and brain metastasis [R2, D1169]) showed accumulation of multiple genomic alterations associated with immunotherapy resistance: PTEN loss, 15q deletion (including B2M), and genome doubling, as well as additional driver alterations (e.g. CDKN2A homozygous deletion). “Late” resistant tumors (R3.1, R3.2 and autopsy tumors) descended from the small bowel (R1, D1028) clone with CDKN2A homozygous deletion, and demonstrated additional LOH of Chr11, including a frequently deleted region in melanoma30 including DNA damage sensor and response genes ATM and CHEK1 and epigenetic regulator KMT2A (Fig. 1c, Supplementary Fig. 3).
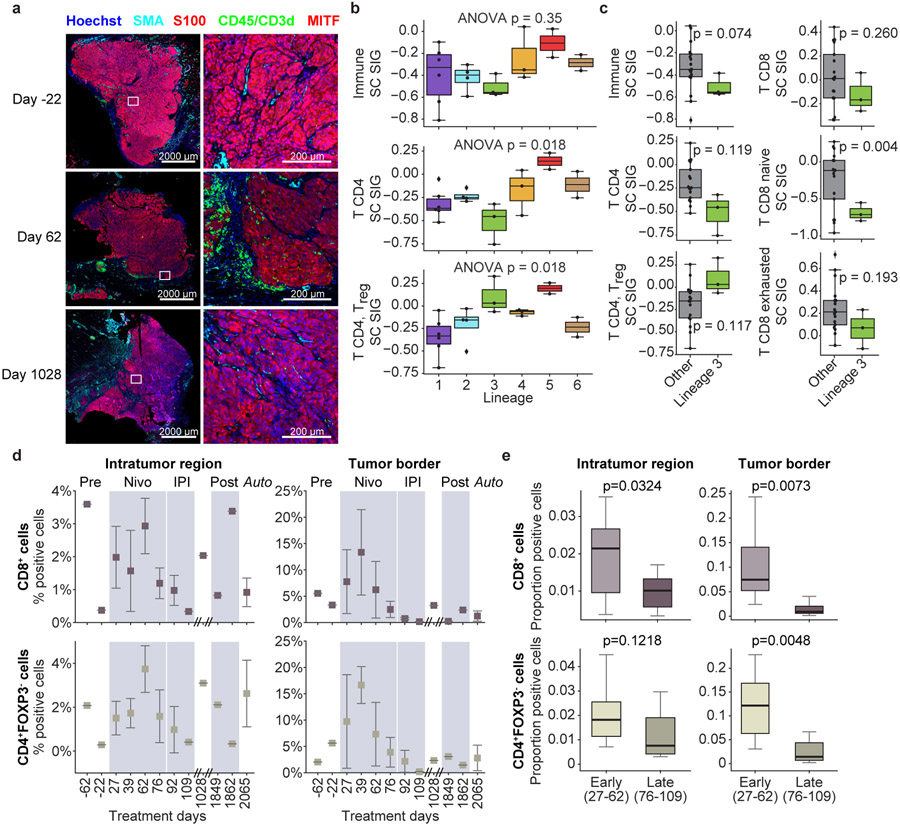
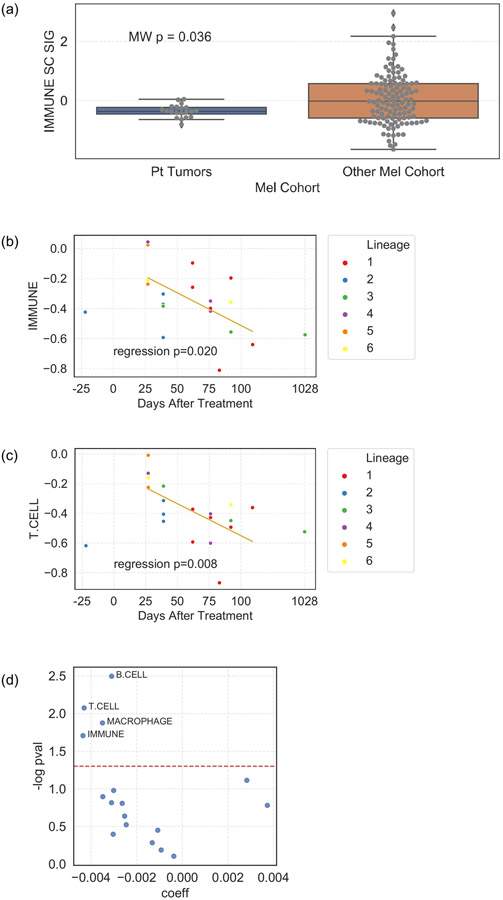
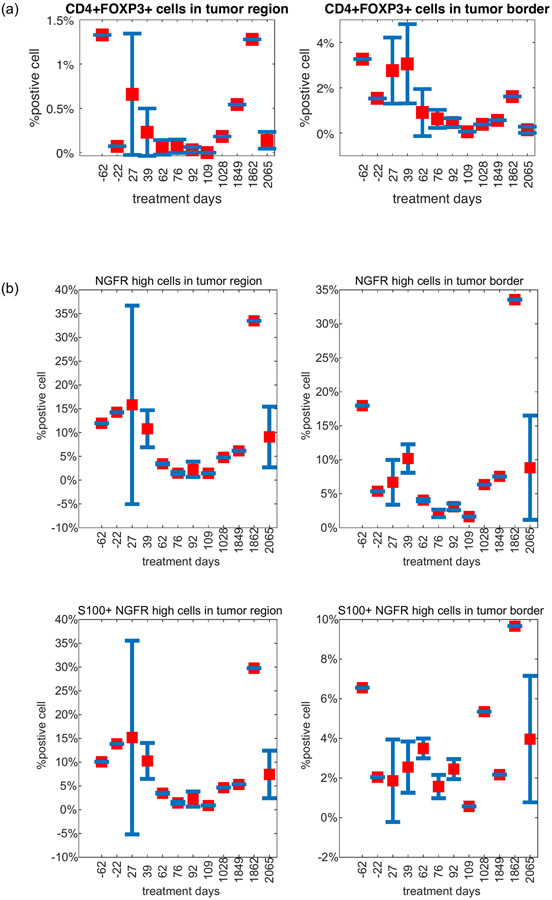
Tumors evolve in parallel with their microenvironment (TME), and tumor mutational status provides only a partial picture. Therefore, we characterized the TME using deconvolution of bulk RNAseq using single-cell derived signatures of immune cell subsets17 and analysis of cyclic multiplexed immunofluorescence (t-CyCIF) (Methods). Relative to a large cohort of aPD-1 treated melanoma patients31, these tumors had a low overall immune score (Extended Data Fig. 7), consistent with t-CyCIF imaging demonstrating that most tumors were immunologically “cold” with low levels of immune cells in the TME (Fig. 2a). Immune scores derived from RNAseq and corresponding immune cell proportions inferred using t-CyCIF correlated well (Supplementary Fig. 4). We next examined the association of lineage with specific immune cell subsets. Despite relatively few samples for each lineage, we detected a statistically significant overall association of lineage with expression of a CD4+ T cell and regulatory T cell signatures (ANOVA p = 0.018, BH FDR q = 0.09 (adjusted for 10 immune signatures), both, Fig. 2b). Comparing tumors in the resistant lineage (Lineage 3) vs other lineages, we observed a trend of lower CD4+ and CD8+ T-cell signature scores (Fig. 2c) with the notable exception of CD4+ regulatory T-cells being higher in Lineage 3, consistent with the hypothesis of a more immunosuppressive environment in the resistant lineage. However, with data from only 3 tumors in Lineage 3, these observations were mostly not statistically significant. Examining changes in the TME over time (Fig. 2d), we observe higher levels of CD8+ T effector and CD4+ Foxp3− T helper cells in the immediate post-IO initiation period (D27-62) compared to the later IO period (D76-109), particularly in the tumor border regions (Fig. 2e, Extended Data Fig. 7b-d, Extended Data Fig. 8).
Figure 2. Analysis of Immune Microenvironment by Lineage and Time.
Overall expression of immune cell signatures (from melanoma single-cell RNAseq17) was inferred in 20 tumors with bulk RNAseq transcriptomes and tested for association with lineage and time post-treatment. Concurrently, cyclic immunofluorescence (t-CyCIF) assessed proportion of immune cell subsets from digital imaging and cell classification (Methods).
(a) Representative digital imaging of cyclic immunofluorescence (t-CyCIF). Tumors from pre-treatment (D-22), on-treatment (D62), and post-treatment progression (D1028) highlight tumor cells (S100 or MITF, red), immune cells (CD45 or CD3d, green), and stromal cells (SMA, cyan).
(b) Expression of selected immune cell signatures by lineage. There was no statistically significant association between lineage and expression of overall immune cell signature (one-way ANOVA p = 0.35), but there was a statistically significant association with CD4 T cell and CD4 T regulatory cell signatures (one-way ANOVA p = 0.018, Benajmini-Hochberg FDR q = 0.09, both). Number of tumors per lineage: L1 (n=6); L2 (n=4); L3 (n=3); L4 (n=3); L5 (n=2); L6 (n=2).
(c) Overall expression of immune and T-cell signatures in resistant lineage (Lineage 3) (n=3) vs others (n=17). Observed mean immune and T-cell signature scores were lower in Lineage 3 tumors (except CD4 T regulatory cells, which were higher). Results were generally not statistically significant given small sample except naive CD8 T cells, unadjusted two-sided T-test p = 0.004.
(d) Overall proportion of CD8+ (effector) and CD4+/FoxP3− (helper) T cells over time and region. Proportions of immune populations are shown from 34 tumors analyzed using t-CyCIF. Error bars represent standard error of mean (S.E.M.).
(e) Comparison of immune cell proportions in early vs late on-treatment time points. Early on-treatment (D27-62) (n=10) vs. late on-treatment (D76-109) (n=8) tumors compare CD8+ (effector) and CD4+/FoxP3− (helper) T cell proportions in intratumoral regions and at tumor border. P-values were calculated with unpaired, two-sided t-test and unadjusted for multiple hypotheses.
Boxplots: box limits indicate the IQR (25th to 75th percentiles), with a center line indicating the median. Whiskers show value ranges up to 1.5 × IQR above the 75th or below the 25th percentiles, with outliers beyond those ranges shown as individual points.
We also performed a hallmark cancer geneset analysis, using single sample GSEA32 of hallmark cancer genesets33 (Methods) to characterize activity levels in samples and association with lineage and time. No individual genesets were statistically significantly associated with lineage or time after multiple hypothesis correction (Supplementary Fig. 5a-c), but PCA dimensionality reduction suggested clustering of Lineage 2 tumors driven in part by increased immune activity (Supplementary Fig. 5de).
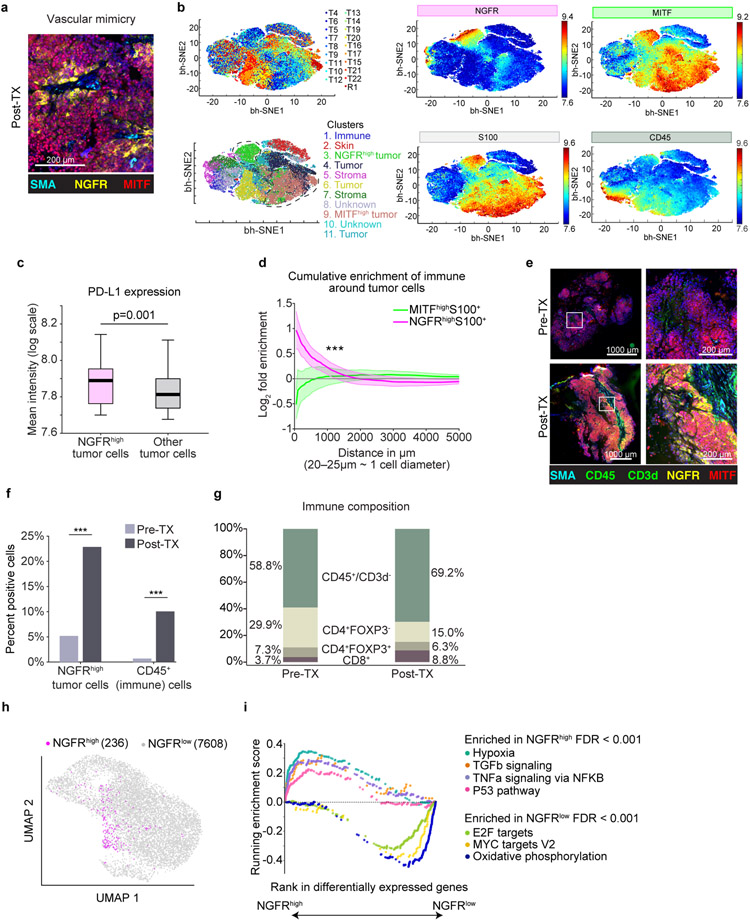
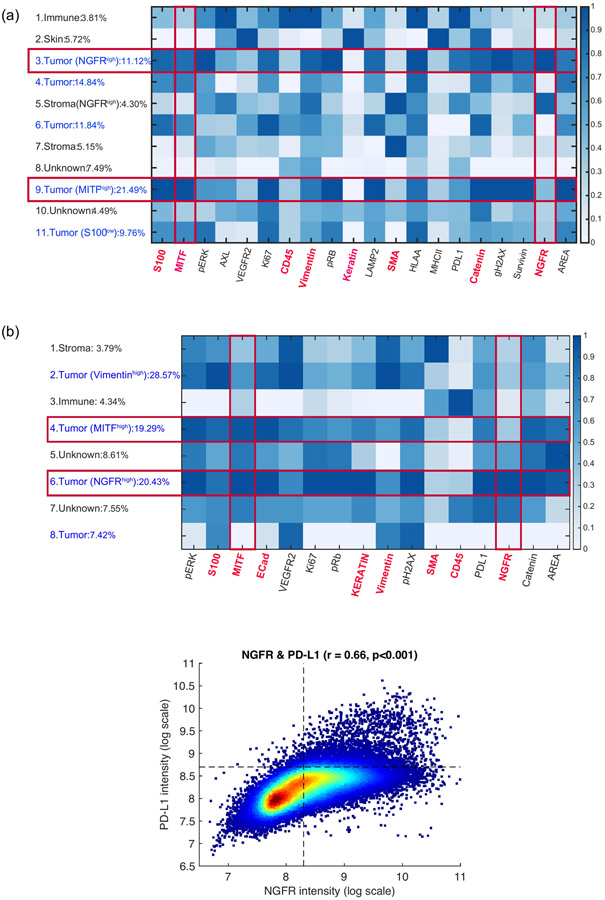
We then examined the relative spatial orientation and arrangement of tumor and immune cell subsets across tumors using t-CyCIF (Supplementary Table 1, https://www.cycif.org/data/liu-lin-2019/). We observed vascular-pattern networks comprised of non-endothelial lined neural-crest-like (NGFR-High) tumor cells consistent with vascular mimicry (Fig. 3a, Supplementary Fig. 6)34, a pattern previously associated with an aggressive and therapy resistant phenotype15,16,35. Clustering of single-cell t-CyCIF data (Fig. 3b, Methods) showed a distinct PD-L1 high NGFR-High tumor cell cluster (Fig. 3c, Extended Data Fig. 9a), and spatial enrichment analysis (Methods) showed cluster enrichment in proximity to immune cells (Fig. 3d). At the time of late recurrence, the patient was enrolled on a trial of intralesional TLR9 agonist plus anti-PD1, and we collected paired pre-treatment and post-treatment (Day 1849 and 1862) biopsies for direct intra-tumoral comparison of the non-responsive target tumor (Fig. 3e). t-CyCIF demonstrated post-treatment increase in immune infiltrate accompanied by an increase in the NGFR-High, PD-L1+ tumor population (Fig. 3f, Extended Data Fig 9b), with expansion of CD8+ T cells and non-lymphocytic immune cells (CD45+/CD3d–) as a proportion of the immune infiltrate (Fig. 3g, Fisher’s exact p < 0.001 for both)). Finally, single-cell RNAseq of the post-treatment tumor biopsy (Fig. 3h) confirmed the presence of an NGFR-High tumor population, and gene-set enrichment analysis (GSEA, Methods) revealed enrichment of hypoxia, immune-stimulatory and immunoregulatory genesets (TNFalpha/TGFbeta), EMT, and P53 pathways in NGFR-High tumor cells, while gene sets involving oxidative phosphorylation, cell cycle checkpoints, and MYC targets were enriched in the NGFR-Low cells (Fig. 3i). Separate single-cell RNAseq of the brain metastasis confirmed differential enrichment of these pathways between NGFR-High and NGFR-Low tumor cells (Supplementary Fig. 7, Supplementary Table 2).
Figure 3. Spatial and Immune Correlates of NGFR-High tumor cells.
(a) t-CyCIF: vasculogenic mimicry of tumor cells. Cyclic immunofluorescence (t-CyCIF) of R3.2 (post-treatment lesion, D1862)
(b) t-CyCIF single cell dimensionality-reduction representation using t-Stochastic Embedded (t-SNE) algorithm. Cells from 19 tumors (D-55 through D1028) highlighting (counter-clockwise from top left): cells from different tumors; inferred clusters using Gaussian Mixture Models (GMM);tumor cells (S100+); immune cells (CD45+); MITF-High cells; NGFR-High cells.
(c) PD-L1 expression in NGFR-High tumor cells (n = 10386) vs. other tumor cells (n = 124763; two-sided t-test p = 0.001, unadjusted).
(d) Spatial proximity: NGFR-High/MITF-High tumor cells to immune cells. Shaded regions cover two standard errors of log-fold enrichment of immune cells within a given radius. At < 1000um (~40-50 cell diameters), immune cells enrich in proximity to NGFR-High tumor cells relative to all tumor cells, but not MITF-High tumor cells (exponential regression Z-test, p < 3x10−40).
(e) t-CyCIF from same tumor pre- (R3.1, D1849) and post- (R3.2, D1862) treatment with TLR9 agonist plus aPD-1. Immune cells (CD45 or CD3d, green), MITF-High tumor cells (red), NGFR-High tumor cells (NGFR and S100, yellow), and stroma (SMA, cyan).
(f) Proportion of NGFR-High S100+ tumor cells (p = 8.3991−323) and CD45+ immune cells (p = 5.1214−62) in pre-/post-treatment tumors (two-tailed Fisher’s exact, unadjusted).
(g) Immune cell composition in pre- & post-treatment tumors. Proportions of immune subsets inferred using t-CyCIF. There are post-treatment increases in proportion of CD8+ T cells (p= 4.614−76) and non-T cell immune cell subsets (p = 3.4725−43) (two-tailed Fisher’s exact, unadjusted).
(h) UMAP of single-cell RNAseq of tumor cells from R3.2 (post-treatment D1862). NGFR-High tumor cells highlighted using an NGFR-program signature.
(i) GSEA of NGFR-High vs. NGFR-Low tumor cells using Hallmark Genesets64. Each point represents a gene within a geneset. Results from R3.2 (post treatment, D1862) are shown and concordant with R2 (brain metastasis, D1169) (Supplementary Fig. 6, Supplementary Table 2).
Boxplots: box limits indicate the IQR (25th to 75th percentiles) with center line indicating median. Whiskers show value ranges up to 1.5 × IQR above the 75th or below the 25th percentiles, with outliers shown as individual points.
* p<0.05
** p<0.01
*** p<0.001
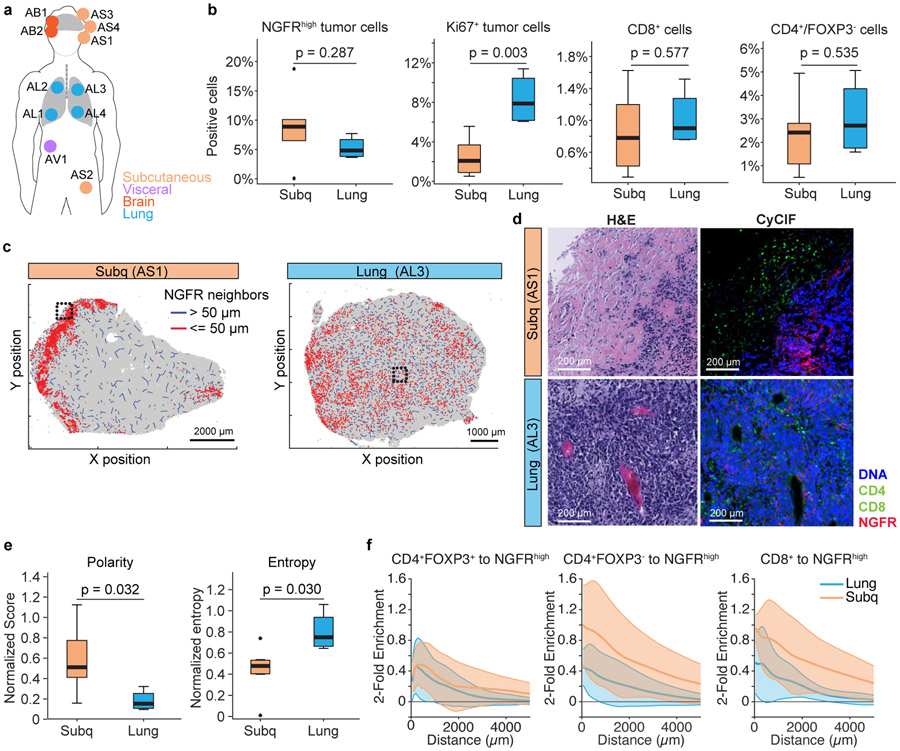
To compare differences in tumor and tumor-microenvironment between different tumor sites at the same time-point, we performed t-CyCIF on 11 rapid autopsy samples (Fig. 4a) and focused on differences in the tumor and microenvironment across the most represented metastatic sites: lung (n=4) and subcutaneous (n=4) metastases. There were no differences in NGFR-High tumor cell proportion or CD8+ cytotoxic or CD4+ T helper populations between lung and subcutaneous sites, but there were higher frequencies of Ki67+ tumor cells in the lung compared to subcutaneous tumors (p = 0.003, Fig. 4b). Despite no quantitative differences in NGFR-High tumor cell populations between lung and subcutaneous metastatic sites, we observed two different spatial patterns: (1) concentration of NGFR-High cells in the periphery of tumor adjacent to immune cells in subcutaneous metastases; and (2) a more diffuse NGFR-High tumor cell distribution throughout the tumor in lung metastases (Fig. 4c,d). Using metrics of polarity and entropy to quantify these observations (Methods), we found that NGFR-High tumor cells had higher polarity and lower entropy in subcutaneous vs lung locations (t-test p = 0.032, p = 0.030 respectively, Fig. 4e). Consistent with potentially distinct roles in immune cell response and pseudovascularization, there was a closer spatial relationship between NGFR-High tumor cells and cytotoxic and T helper cells in subcutaneous tumors compared to tumors in the lung (p < 8.2 X 10⁻¹¹, Fig. 4f).
Figure 4. NGFR-High Tumor and Immune Microenvironment by Metastatic Sites.
(a) autopsy biopsies from metastases in lung (n=4), subcutaneous (n=4), brain (n=2), and adrenals (n=1).
(b) t-CyCIF quantification of tumor & immune populations. NGFR-High or Ki67+ tumor cells were calculated and percentage of positive cells (over all cells quantified) are represented as boxplot (left). CD8a+ (Cytotoxic T cells) and CD4+/FoxP3− (helper T cell) were quantified (right). Unadjusted p-values were calculated with two-sided t-tests between lung or subcutaneous sites.
(c) Macro-scale patterns of NGFR distribution in representative examples of lung and skin metastases. Red lines represent a NGFR-High tumor neighbor within 50um, blue lines indicate neighbor more than 50 um distant.
(d) Exemplar H&E and t-CyCIF images of tumors from different anatomic locations (Lung versus Subcutaneous). Right panel is 4-channel CyCIF images (blue: DNA, green: CD8a, CD4, red: NGFR), and left panel is the corresponding H&E.
(e) Polarity and Entropy of NGFR-High cells in lung versus subcutaneous metastases. We find higher polarity in the subcutaneous lesions (p=0.032) and higher entropy in the lung lesions (p=0.030) (two-sided t-test, unadjusted) (Methods).
(f) Spatial association of NGFR-High tumor cells with immune cell populations. The log-fold enrichment of immune cells within a given radius of NGFR-High tumor cells relative to all tumor cells is shown for subcutaneous and lung lesions. Shaded regions cover two standard errors of the log-fold enrichment. Immune cells are enriched in the proximity of NGFR-High tumor cells in both lung and subcutaneous locations (exponential regression Z-test CD4+FOXP3+ (lung: p = 3.2 x 10−47; subcutaneous: p = 6.4 x 10−50); CD4+FOXP3− (lung: p = 5.5 x 10∓50; subcutaneous: p = 7.8 x 10−73); CD8+ (lung: p = 2.3 x 10−66; subcutaneous: p = 3.4 x 10−96)). However, the subcutaneous samples had stronger enrichment of CD4+FOXP3− and CD8+ cells (exponential regression Z-test, CD8+: p = 8.2 X 10⁻¹¹; CD4+FOXP3−: p = 9.5 x 10⁻¹⁸) but not CD4+FOXP3+ cells (p = 0.85) compared to lung samples.
Boxplots: box limits indicate the IQR (25th to 75th percentiles), with a center line indicating the median. Whiskers show value ranges up to 1.5 × IQR above the 75th or below the 25th percentiles, with outliers shown as individual points
In this study, we report tumor-intrinsic and immune evolutionary dynamics in a melanoma patient treated with ICB. Using molecular and protein characterization of 37 longitudinal tumor samples we deduced the branched evolutionary structure, mapped the timing of immune escape, analyzed the immune microenvironment, and demonstrated phenotypic selection for a less differentiated, NGFR-High program in tumor cells. Seven genomic lineages were inferred, suggesting significant tumor heterogeneity at the start of therapy36 and persisting through initial therapy. Multiple RAAs were identified, including PTEN loss6-8, genome doubling with increased aneuploidy12,13, and loss of antigen-presentation9,10. Post ICB, early recurrences demonstrated acquisition of multiple resistance alterations, arising out of the lineage with 15q deletion (including B2M) that harbored a PTEN homozygous deletion and additional genomic alterations, including genome doubling and biallelic CDKN2A loss. This supports the concept of immune pruning of susceptible clones37,38, propagation of clones with intrinsic (and multiple) immune-evasive adaptations, and suggests the insufficiency of any single alteration to intrinsically support survival and outgrowth. Notably, the clone comprising the early brain metastasis was an evolutionary dead-end, with no subsequent recurrence after resection and radiation, while the early bowel metastasis clone was the ancestor to all subsequent resistant metastases (including brain metastases at rapid autopsy), supporting the possibility of disease eradication with aggressive treatment of oligometastases.
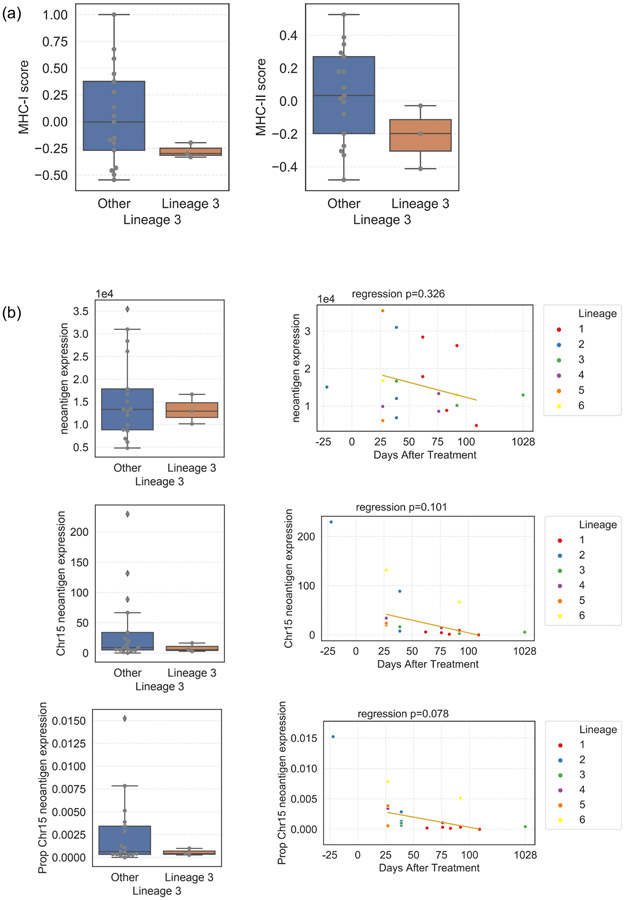
This patient’s clinical course is unusual, with a long interval between primary tumor and first metastasis, followed by rapid tumor growth and heterogeneous responses to ICB, and abrupt clinical complete response for which the trigger is unknown. Preceding complete response was initiation of CTLA-4 checkpoint inhibitors and palliative radiation suggesting the contribution of an abscopal effect. Additionallly, the features leading to the resistant clone arising from Lineage 3 (with chromosome 15q LOH including B2M) are not completely characterized. While RNAseq analysis suggests decreased MHC-I expression in Lineage 3 tumors (T-test p = 0.01, Extended Data Figure 10a), there is not complete loss via t-CyCIF with continued tumoral HLA-A protein expression. An alternate hypothesis is that mutations on the deleted segment of chromosome 15q generated immunogenic neoantigens. We see evidence of decreased expression of genes coding neoantigens in Lineage 3 tumors and over time (Extended Data Figure 10b). Finally, early recurrences occurred after steroid treatment for autoimmune nephritis followed by indolent disease progression for 2 years transitioning to later recurrence of more aggressive, rapidly therapy refractory disease, suggesting that causes of persistence of the resistant clone and subsequent progression are multifactorial.
Prior studies have defined an NGFR-High program within a subset of melanoma cells in association with dedifferentiation35, increased invasiveness and decreased proliferation16, and demonstrated that functional relevance to targeted therapy resistance15,39,40 and immunotherapy in vitro/in vivo41. However, a more granular assessment of the NGFR-High phenotype within ICB-treated patients has not been demonstrated. Here, we find that the melanoma NGFR-High state is characterized by high PD-L1 expression and close spatial association with immune cells, suggesting a role in tumor-immune interactions, consistent with recent in-vitro studies demonstrating resistance to T-cell killing in NGFR-High tumor cells41. We observe enrichment of hypoxia pathways in NGFR-High tumor cells and cytoarchitecture consistent with vascular mimicry34,42, suggesting a potential role in increasing circulation to the tumor34, regulating immune cell entry43, and nominating these cells as targets for therapeutic intervention. Our analysis describes distinct NGFR-High tumor cell distribution patterns in lung versus subcutaneous metastatic sites, potentially reflecting site-specific heterogeneity in tumor-immune interactions.
Whether the evolutionary dynamics of this patient’s tumor reflect the broader cohort of melanoma treated with ICB must be assessed in larger cohorts representing all melanoma genotypes and reflecting the breadth of clinical heterogeneity; however, this study provides molecular insight into the development of immunotherapy resistance and integrates longitudinal sequencing and imaging approaches to thoroughly define tumor and immune cell interactions. Further efforts are ongoing, including integrating analysis of plasma/PBMCs44,45 in parallel with deep molecular analysis of the tumor, potentially affording a less invasive means of tumor/immune assessment longitudinally; and integration of additional modalities (e.g. epigenetic sequencing) at different scales (bulk, single-cell) to dissect longitudinal intra-patient heterogeneity. We anticipate that clinically contextualized, longitudinal multimodal molecular analyses to dissect changes in the tumor- and tumor microenvironment under therapy will enable deeper understanding of the evolution of resistance and tumor heterogeneity and improve outcomes by identifying novel targets and informing rational combination therapies.
METHODS
PATIENT SAMPLES
IRB approval was obtained prior to study enrollment and written informed consent was obtained from the patient for the collection of tissue and blood samples and use of medical imaging for research and genomic profiling, as approved by the Dana-Farber/Harvard Cancer Center Institutional Review Board (DF/HCC Protocol 11-181). Response was assessed using modified RECIST 1.1 criteria, and restaging scans were performed at least every 3 months to assess response and progression.
Clinical History and Sample Context
A 67-year-old man with stage IIB nodular melanoma treated with wide excision and negative sentinel lymph node biopsies recurred 2.5 years later, and staging PET-CT images showed widespread disease including lymph node, lungs, subcutaneous, and visceral lesions. He enrolled in a phase 2 trial of sequential ICB15 and received nivolumab then ipilimumab then maintenance nivolumab. After 6 cycles of nivolumab, he had heterogeneous response to ICB (RECIST 1.1, PD: −17%) with overall rapid progression. He continued to progress over 4 cycles of ipilimumab and underwent palliative radiation of bone metastases. Coinciding with maintenance nivolumab (Day 182), he experienced an abrupt, precipitous response. Restaging scans (Day 221) demonstrated a partial response (RECIST 1.1, −45%) with continued disease regression. He completed 2 total years of ICB with excellent radiographic response (Day 753, RECIST 1.1, −73%), and was considered a complete clinical responder (only residual scar on imaging). Three months after trial completion (Day 831), he developed autoimmune nephritis requiring high-dose steroids. Six months later (Day 1015), imaging revealed an isolated jejunal metastasis that was resected. Five months later, imaging demonstrated a new occipital brain lesion that was resected (D1169) with post-operative radiation therapy. He then did well with no recurrence until a year and a half later when he had widespread metastatic recurrence. He resumed nivolumab, but progressed on therapy. He transitioned to a clinical trial of anti-PD1 therapy + TLR9 agonist (Day 1850) but progressed. Despite subsequent radiation, carboplatin and paclitaxel, the patient died of his disease approximately 1 year after metastatic recurrence and almost 6 years from initiation of ICB.
Multiple rounds of palliative resection of subcutaneous lesions were performed during the early on-treatment phase of his clinical course and ultimately biopsies from 37 tumors underwent molecular characterization from the original primary (n=1), pre-treatment (n=3), on-treatment (n=18), and post-treatment progression (n=15) time points, spanning 9 years.
DNA/RNA Extraction and Exome Sequencing
DNA extraction, whole exome library prep and sequencing was performed for samples as previously described25,46. Slides were cut from FFPE blocks and examined by a board-certified pathologist to select high-density cancer foci and ensure high purity of cancer DNA. Biopsy cores were taken from the corresponding tissue block for DNA/RNA extraction. DNA and RNA extraction was performed using Qiagen AllPrep DNA/RNA Mini Kit (#51306), and stored at −20 degrees Celsius. Whole exome capture libraries were constructed from 100ng of DNA from tumor and normal tissue after sample shearing, end repair, and phosphorylation and ligation to barcoded sequencing adaptors. Ligated DNA was size selected for lengths between 200-350 bp and subjected to exonic hybrid capture using Illumina library preps. The sample was multiplexed and sequenced using Illumina HiSeq technology. The Illumina exome uses Illumina’s in-solution DNA probe based hybrid selection method that uses similar principles as the Broad Institute-Agilent Technologies developed in-solution RNA probe based hybrid selection method47,48 to generate Illumina exome sequencing libraries.
Total RNA was assessed for quality using the Caliper LabChip GX2. The percentage of fragments with a size greater than 200nt (DV200) was calculated using software. An aliquot of 200ng of RNA was used as the input for first strand cDNA synthesis using Illumina’s TruSeq RNA Access Library Prep Kit. Synthesis of the second strand of cDNA was followed by indexed adapter ligation. Subsequent PCR amplification enriched for adapted fragments. The amplified libraries were quantified using an automated PicoGreen assay.
200ng of each cDNA library, not including controls, were combined into 4-plex pools. Capture probes that target the exome were added, and hybridized for recommended time. Following hybridization, streptavidin magnetic beads were used to capture the library-bound probes from the previous step. Two wash steps effectively remove any nonspecifically bound products. These same hybridization, capture and wash steps are repeated to assure high specificity. A second round of amplification enriches the captured libraries. After enrichment the libraries were quantified with qPCR using the KAPA Library Quantification Kit for Illumina Sequencing Platforms and then pooled equimolarly. The entire process is in 96-well format and all pipetting is done by either Agilent Bravo or Hamilton Starlet.
Pooled libraries were normalized to 2nM and denatured using 0.2 N NaOH prior to sequencing. Flowcell cluster amplification and sequencing were performed according to the manufacturer's protocols using either the HiSeq 2000 v3 or HiSeq 2500. Each run was a 76bp paired-end with a dual eight-base index barcode read. Data was analyzed using the Broad Picard Pipeline which includes de-multiplexing and data aggregation.
Quality Control and Variant Calling
Initial exome sequence data processing and analysis were performed using a customized version of the Getz Lab WES analysis pipeline (https://portal.firecloud.org/#methods/getzlab/CGA_WES_Characterization_Pipeline_v0.1_Dec2018/) at the Broad Institute. After alignment from the Broad Picard Pipeline, BAM files were uploaded into the Terra infrastructure (https://app.terra.bio) which managed intermediate analysis files executed by analysis pipelines.
Out of an initial 44 samples (43 tumor + 1 blood normal), all passed coverage (> 50x mean target coverage) and contamination estimation49 (< 5%) thresholds except the primary tumor (T1, D-1381, 34x mean target coverage, 13% contamination), which we kept due to its importance in phylogenetic analysis. We removed 6 tumors due to low tumor purity (< 10% tumor cells and no matched mutations in significantly mutated genes50,51), yielding 37 total tumor samples + 1 matched blood normal for analysis. Supplementary Table 1 shows sequencing characteristics.
The MuTect algorithm52 was applied to identify somatic single-nucleotide variants in targeted exons. Strelka53 was applied to identify small insertions or deletions. Alterations were annotated using Oncotator54. Filters were applied to detect and remove known artifacts and germline variants, including DNA oxidation during sequencing55.
Copy Number Variants
Total copy number alterations for individual tumors were inferred using adaptations of a binary segmentation algorithm56,57 (CapSeg) comparing fractional exon coverage for tumor segments to a panel of normal samples, generating exomic segments and segment copy number. Copy number data were inspected visually and manually for focal amplifications and deletions, and genes were annotated with Oncotator54. For allelic copy numbers, heterozygous SNPs were identified and integrated with the binary segmentation algorithm (Allelic CapSeg), and further adjusted for tumor purity and ploidy58. We then called allelic amplifications and deletions, following previously described criteria59 integrating segment focality and the revised allelic copy number.
Purity and Ploidy
Purity and ploidy was estimated using the ABSOLUTE algorithm58, which integrates variant allele frequency distributions and copy number variants to estimate absolute tumor purity and ploidy and infer cancer cell fraction (CCF), the proportion of cancer cells in the sample which contain each mutation. Post-purity and ploidy corrected allelic segments were used to estimate allelic copy number estimates.
Aneuploidy Calculation
We used an adaptation of the weighted Genome Instability Index29,60 to calculate a measure of genomic aneuploidy for each sample. First, we used the allelic segment output to determine the median genomic allelic copy number (e.g. 1 for non-genome doubled samples and 2 for genome doubled samples), semantically the 50th percentile of allelic copy number for base pairs across the genome. Then, to calculate genomic aneuploidy, we estimated the proportion of the genome with a different allelic copy number from this median.
PHYLOGENETIC ANALYSIS
Two complementary approaches were taken to perform phylogenetic analyses: PyClone61 and PhylogicNDT62.
A comprehensive list of all called point mutations and small insertion-deletions found in any tumor sample was generated. For each tumor sample, the number of alt and reference reads, estimated CCF, and purity and ploidy corrected minor and major copy number at each mutation locus was generated. PyClone61 (V0.13.1), a Bayesian clustering method for grouping mutations into clonal structures accounting for tumor purity and allelic copy numbers, was then used to generate clusters of mutations and their estimated CCF for each sample given the described mutation inputs and tumor purity. The following default parameters were used:
base_measure_params: {alpha: 1, beta: 1}
beta_binomial_precision_params:
prior: {rate: 0.001, shape: 1.0}
proposal: {precision: 0.01}
value: 1000
concentration:
prior: {rate: 0.001, shape: 1.0}
value: 1.0
density: pyclone_beta_binomial
init_method: disconnected
num_iters: 10000
31 clusters were inferred. After filtering for clusters with more than 3 mutations, 23 clusters remained (Extended Data Fig. 4a). Three informative patterns emerged:
Clusters with CCF ~1 in all tumors (C2, C4, C5): Three clusters representing a total of 548 mutations were found at >= 0.6 CCF in all samples (Supplementary Fig. 5a), and likely collectively represent the ancestral clone.
Clusters with CCF ~0 in most tumors and ~1 in a few tumors (C26, C16, C10, Supplementary Fig. 1df, Extended Data Fig 4c), suggesting a common ancestor for tumors containing these clusters.
Clusters with CCF ~1 in most tumors and 0 in a few tumors (C22, C14, C8, Extended Data Fig. 4b, Supplementary Fig 1ce), with mutations found in the same chromosomal segment, suggesting a common ancestor with deletion of the chromosomal segment containing the cluster mutations for tumors with inferred CCF of 0.
Hierarchical clustering was then performed using seaborn’s clustermap method21-23 (default clustering using Euclidean distance and the Nearest Point Algorithm for linkage between clusters) (Extended Data Fig. 5a), and seven lineages were inferred. Reassuringly, CNVs (which were not used to generate the lineages) were consistent with the inferred lineages, e.g. lineage 3 was inferred by lacking C14 composed of 20 mutations in chromosome 15q (Extended Data Fig. 4b), and all tumors in this lineage had a corresponding 15q LOH (Extended Data Fig. 3). Similarly, lineage 5 lacks C8 composed of 11 mutations in a segment of chromosome 19q (Supplementary Fig. 1e), which is inferred lost in the tumors in lineage 5 (Extended Data Fig. 3). The four tumors (T4, T9, T10, T12) in Lineage 2 shared loss of chromosome 2q mutations (Supplementary Fig. 1c) and had an inferred partial deletion of chromosome 2q. Three of these tumors (T4, T9, T10) also shared additional acquired mutations as well as a genome doubling event.
In parallel, we used PhylogicNDT62 to reconstruct the phylogeny of metastases from DNA sequencing data and inferred cell fractions. PhylogicNDT implements a multidimensional Dirichlet process to jointly estimate the cell population structure and genetic phylogency across all samples, taking copy number profiles, purity values, and joint mutational calls. In our case, we used the posterior distribution on CCF values associated with each mutation (taking into account purity, copy number profiles using ABSOLUTE58). PhylogicNDT Cluster and BuildTree was run on data from selected subsets of samples with the following default parameters: -rb -ni 2000, --seed 0.
Tumors lineages defined by the PyClone/hierarchical clustering approach were reproduced in the phylogenetic tree(s) inferred by PhylogicNDT (Supplementary Fig. 8ab). The inferred phylogenetic structure of tumors within each lineage is shown in Supplementary Fig. 8c. We extracted the inferred mutation patterns characterizing the MRCA of each lineage, and we used these ancestral patterns to infer the history of early lineage divergence (Fig. 1b)
IMMUNE DECONVOLUTION FROM BULK TRANSCRIPTOMIC SEQUENCING
For RNA-seq, we utilized RSEM63 to quantify TPM, FPKM, and RPFKM levels with bowtie264 as the mapper and hg19 as reference genome using default mapping parameters.
We inferred overall expression (OE) of 13 immune cell signatures derived from single-cell RNAseq in melanoma samples as previously described17: an overall immune cell signature (‘IMMUNE’), a general T-cell signature (‘T.CELL’), B-cell signature (‘B.CELL’), different T cell lineages and functional subgroups (‘T.CD4’, ‘T.CD8’, ‘T.CD4.TREG’, ‘T.CD8.NAIVE’, ‘T.CD8.CYTOTOXIC’, ‘T.CD4.NAIVE’, ‘T.CD8.EXHAUSTED’,’ T.CD4.EXHAUSTED’,), NK cells (‘NK’), and macrophages (‘MACROPHAGE’). Briefly, genes in these signatures were derived by examining genes most distinct to those cell types compared to all other cells in the single cell samples in an unbiased fashion with subsequent expert curation. Overall expression was determined as an averaged normalized score of genes within each geneset; for each tumor, gene expression is scored based on its normalized expression within the cohort of tumors. Details of signature derivation and scoring and code is available as previously described17.
NEOANTIGEN INFERENCE
Neoantigen prediction was run using Polysolver65 to determine the patient’s HLA types from the blood normal sample. Neoantigen predictions were made using NetMHCPan 4.066 from called mutations in each tumor, and a threshold for binding affinity of < 500nM, within the framework of the pVAC-seq67 pipeline.
MULTIPLEXED IMMUNOFLUORESCENCE
Formalin fixed and paraffin embedded (FFPE) slides were cut at 5 μm thickness and mounted on a glass slide at the Pathology Core of Massachusetts General Hospital. Due to the extension of sample collection across treatments of the patient, FFPE samples were processed in 3 batches, as indicated in Supplementary Table 1. We used a recently described method, tissue cyclic immunofluorescence (t-CyCIF) for multiplexed immunofluorescence (MxIF)68. In t-CyCIF, single-cell resolution imaging of multiple antigens on the same FFPE slide is achieved by an iterative process that includes staining, image acquisition (and storage) and inactivation of fluorophores, which encompasses a cycle. This cycle is repeated until all images are registered, and signal intensities are stacked for individual cells for proteins of interest. Briefly, dewaxing, rehydration and pre-staining were performed on a Leica Bond RX automated stainer using settings described in Lin et al69. Blocking was performed using Odyssey blocking buffer (LI-COR, Cat. 927401). To determine non-specific binding, FFPE were stained with three secondary antibodies conjugated with Alexa-647 anti-mouse (Invitrogen, Cat. A-21236), Alexa-555 anti-goat (Invitrogen, Cat. A-21432) and Alexa-488 anti-rabbit (Invitrogen, Cat. A-11034), followed by nuclear staining using Hoechst 33342 (Life Technologies, Cat. H3570). For t-CyCIF, fluorophore-conjugated antibodies binding to S100 (Abcam, Cat. 207367), MITF (Abcam, Cat. 3201), MHC Class I (Abcam, Cat. 199837), CD3 (Dako, Cat. A0452), phospho-RB (Santa Cruz, 16670) and Ki67 (CST, Cat. 11882) (Supplementary Data Table 3) were diluted in Odyssey blocking buffer, and incubated for ~12 hours at 4°C in a moisture chamber, followed by washing in 1x PBS four times. Additional antibody information and dilution used can be found in Supplementary Table 3. Following imaging, fluorophores were inactivated in 4.5% H2O2 and 24 mM NaOH in PBS for 1 hour at RT in the presence of white light and washed four times in 1x PBS. Imaging was performed on a CyteFinder slide scanning fluorescence microscope (RareCyte Inc. Seattle WA) using a 10X objective (for batch 1) and 20X objective (for batch 2&3). Background subtraction was performed using the previously established rolling ball algorithm (with a 50-pixel radius) in ImageJ68. To obtain intensity values for single cells, images were segmented using a previously described69 Watershed algorithm based on nuclear staining by Hoechst 33342. To generate virtual hyper-stacked images, the transformed coordinates were applied to images from four channel imaging of each CyCIF cycle. The region of interest was defined as tissue with positive S100 staining and immediately adjacent normal tissue. Single-cell intensity distributions are shown as log mean intensity values (x-axis) and cell count (y-axis). Additional details on used scripts and protocols can be found on http://www.cycif.org/.
GATING AND CLUSTERING OF SINGLE-CELL DATA USING MULTIPLEX IMMUNOFLUORESCENCE
Single cell data for given markers were gated using a 1D Gaussian mixture model, with the first mode considered as the negative population and the rest as the positive population. Expert manual inspection and adjustment was then applied in order to fine tune and/or correct gate values. An example of 1D GMM gating can be found in Supplementary Fig. 9. Single cell clustering was done by Gaussian mixture model (GMM) using the EMGM function in Cyt package70. Briefly, each CyCIF sample’s single-cell intensity data were first normalized by shifting and rescaling the 1st and 99th percentiles of each marker to be 5000 and 30000 RFU respectively. Then, the inverse hyperbolic sine (asinh) function in Cyt was applied. For GMM clustering, several K values (from 6 to 15) were tested, and K was chosen based on concordance with visible clusters in a t-SNE visualization. The markers used in clustering were S100, MITF, AXL, CD45, Vimentin, SMA, Catenin and NGFR. 10,000 cells from each sample were used.
IDENTIFICATION OF TUMOR REGIONS
A board-certified dermatopathologist (C.G.L.) reviewed the t-CyCIF images and defined the invasive margins (IMs) of each sample. To heuristically define which cells belonged to intra-tumor regions, we first defined tumor cells as the S100-High cells in a 2-component GMM of the tumor marker (S100) intensities in each sample. Then, a K-nearest-neighbor classifier (KNN) was trained on cells’ XY-coordinates to predict whether cells were tumor cells, for K=25. Cells that this classifier predicted to be tumor cells were then defined to be in the intra-tumor regions. MATLAB code is in supplemental materials/methods.
SPATIAL ENRICHMENT ANALYSIS
Each spatial enrichment curve is defined for a tumor population (NGFR-High or MITF-High tumor cells from clustering) and a target population (e.g. immune cells). The curve represents the ratio of CDF curves for 1) pairwise distances between a chosen tumor population and a target population, and 2) pairwise distances between a random tumor population and the target population. Random tumor population was defined by randomly labeling an equal number of tumor cells as the chosen tumor population. Each curve was computed by averaging results for 300 instances of random tumor populations, from a 10,000-cell subsample per tissue sample. Technically separated tissue pieces on the same slide were treated as distinct tissue samples. Differences between groups of curves were evaluated by fitting all curves in a group to an exponential, and comparing fit parameters with a Z-test. Fitting and confidence intervals were computed in MATLAB with fit(), using the Trust-Region algorithm with a manual initialization. Tumor population was defined as GMM clusters 3,4,6,9,11 and the immune population was GMM cluster 1 (from Fig. 3b) for the analysis in Fig. 3d, and the tumor and immune populations defined by gating for the analysis in Fig. 4f.
SPATIAL MORPHOLOGY ANALYSIS OF ENTROPY AND POLARITY
Single-cell CyCIF data was used to obtain the coordinates of particular cell types (e.g. NGFR+). Then, density plots of cell coordinates were converted to grayscale images on which Shannon entropy was computed using the MATLAB entropy() function. In order to account for the global distributions and shapes of individual tumors, cell type entropy was normalized by the entropy of tumor cells (S100+).
For the polarity calculation, single cell coordinates were translated to place the centroid of all cell coordinates at the origin. Polarity of a specific cell type was defined as the net displacement of all its cells’ coordinate vectors , normalized by cell-type count N and the scale L of each tissue sample (minimum between X or Y range of coordinates):
IMMUNOHISTOCHEMISTRY
Tissue sections were deparaffinized, rehydrated, and blocked with 3% hydrogen peroxide. All were stained on Bond 3 automated immunostainer (Leica Microsystems, Bannockburn, IL, USA) and Dako Autostainer (Dako Corporation, Carpinteria, CA) using EnVision (Dako) staining reagents. Sections were incubated for 60 min with PTEN (BioCare Medical), or NGFR (BD Biosciences) and ERG (Abcam) and were then incubated with the EnVision+ Dual Link (Dako) detection reagent for 30 min. Sections were washed and treated with a solution of diaminobenzidine and hydrogen peroxide (Dako) for 10 min, and after rinsing, a toning solution (DAB Enhancer, Dako) was used for 2 min to enrich the final color.
SINGLE CELL RNASEQ PROCESSING AND ANALYSIS
Fresh tumor sample was collected after surgery and was dissociated within half an hour using the human tumor dissociation kit (Miltenyi Biotec; 130-095-929) on the gentleMACS Octo Dissociator (Miltenyi Biotec; 130-095-937). For the neck sample, single cell libraries were prepared with Chromium Single Cell 3’ library kits using v2 chemistry (10x Genomics) according to the manual. For the brain sample, single cells were sorted into wells based on CD45 and CD3 markers or absence thereof via FACS, and lysed in a buffer containing free dNTPs and oligo(dT)-tailed oligonucleotides with a universal 5'-anchor sequence, and processed in accordance with the standard Smart-seq2 protocol. Transcripts from each cell were reverse transcribed in each droplet (neck) or well (brain) and barcoded cDNA were amplified in bulk. The resulting gene expression libraries were profiled by NextSeq 500 and/or NovaSeq 6000 system (Illumina).
Sample demultiplexing, barcode processing, alignment, filtering, and UMI counting were performed using the Cell Ranger analysis pipeline (v3.1) for the neck sample. For the brain sample the cumulus/smartseq2/7 workflow on Terra (https://portal.firecloud.org/?return=terra#methods/cumulus/smartseq2/7) was used for preprocessing and alignment, with the GRCh38_ens93filt reference. Downstream analyses were performed in R using the Seurat71 package (v3.1.0) and in python with the scanpy package (v 1.4.4.post1)72.
For each cell, two quality control metrics were calculated: (1) the total number of genes detected and (2) the proportion of UMIs contributed by mitochondrially encoded transcripts. Cells in which fewer than 200 genes were detected and in which mitochondrially encoded transcripts constituted greater than 20% of the total library were excluded from downstream analysis, yielding an expression matrix of 8,669 cells by 17,697 genes for the 10X neck sample, and 652 cells by 33,538 genes for the Smart-seq2 brain sample. Each gene expression measurement was normalized by total expression within the corresponding cell and multiplied by a scaling factor of 10,000. Mean and standardized variance values were calculated for each gene across all cells, and a subset of 5,000 highly variable genes was selected for principal components analysis (PCA). Following PCA, Uniform Manifold Approximation and Projection (UMAP) was performed on the first 30 principal components using default parameters. Unsupervised clustering using the default graph-based algorithm implemented in Seurat (resolution parameter 0.2) identified 9 distinct clusters (for the neck sample) and 8 clusters (for the brain sample) (Supplementary Fig 7). For classification of cell populations, differential expression analysis was performed between each cluster and all other cells using a Wilcoxon rank sum test. Clusters of malignant cells were identified using InferCNV with PTPRC+ cells as a reference population. Dimension reduction was performed on this subset of 7,844 malignant cells using PCA and UMAP as described above. Scoring of single cells with NGFR program signatures from previous literature was performed using the VISION R package16,73,74.. In the brain sample, 220 malignant cells were characterized. In both samples, cutoffs for NGFR-High tumor cells (based on NGFR program signatures) were chosen to be concordant with high NGFR single gene expression within that sample, and performed a GSEA comparing NGFR-High tumor cells thus defined to NGFR-Low tumor cells.
For pre-ranked GSEA, differential expression analysis was performed between NGFR-High and NGFR-Low cells using a Wilcoxon rank sum test, and log2(fold change) was selected as a ranking metric. Preranked GSEA was performed using a curated collection of gene sets consisting of sets from the Hallmark collection in the MSigDB database75.
Extended Data
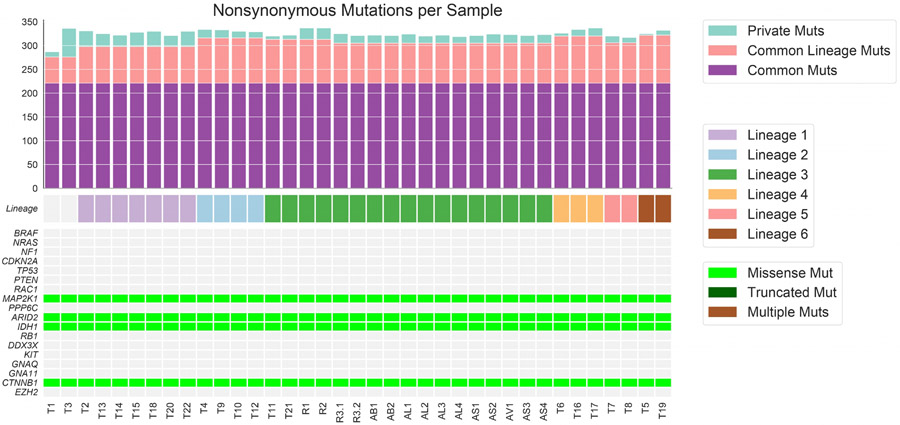
Extended Data Figure 1. Mutation Load and Mutations in Significant Melanoma Genes.
221 nonsynonymous clonal mutations were found in all tumors, including hotspot mutations in IDH1 (p.R132C) and MAP2K1 (p.E203K), and additional missense mutations in cancer driver genes CTNNB1 (p.R582W) and ARID2 (p.P1664S).
Extended Data Figure 2. Mutational Spectrum Profile of Common Ancestor.
489 common single nucleotide variants (including non-coding mutations) found in all tumors with mutations called individually in each sample are represented in their tri-nucleotide context; this mutational spectrum has cosine similarity of 0.965 with the ultraviolet DNA damage signature (Signature 7; https://cancer.sanger.ac.uk/cosmic/signatures). A similar analysis with 548 common ancestor mutations inferred jointly by PyClone generates similar results with cosine similarity of 0.962 to the UV signature (not shown).
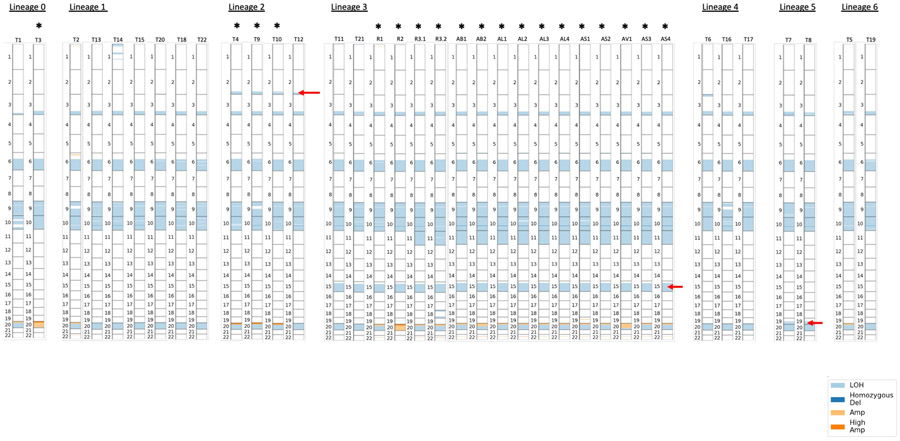
Extended Data Figure 3. Copy Number Alterations by Lineage and Tumor.
Each bar represents a tumor, with numbers indicating chromosomes and copy number alterations indicated by shade. Red arrows indicate the chromosomal segment loss of heterozygosity with corresponding loss of mutations in that segment that characterize the lineage, i.e. 2q for Lineage 2, 15q in Lineage 3, 19q in Lineage 5. Genome doubling is indicated by *.
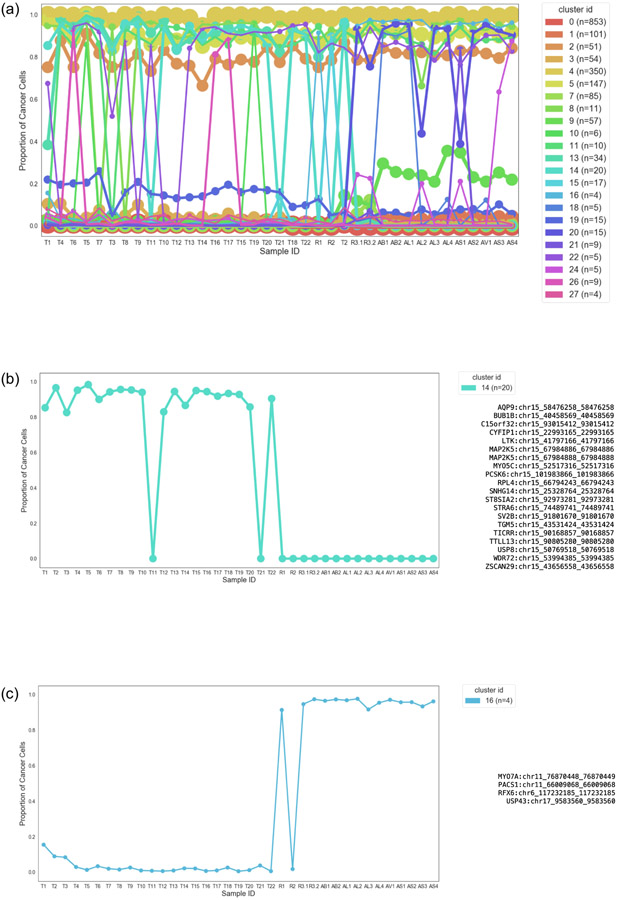
Extended Data Figure 4. Inferred Lineage-Defining Mutational Clusters and Cancer Cell Fractions by Tumor.
(a) Inferred Mutational Clusters and Cluster Cancer Cell Fraction by Tumor. Mutational clusters representing subclones and the proportion of cancer cells in each tumor sample with each mutational cluster was inferred using PyClone. The x-axis shows each tumor, the y-axis is the proportion of cancer cells in each sample containing the cluster, and the legend (n=xx) refers to the number of mutations for each inferred cluster. Only clusters containing more than 3 mutations were included (9 clusters excluded) in subsequent analyses. (b) Mutational Cluster Defining Lineage 3. This pattern demonstrates the loss of mutations in a common ancestor of the seventeen tumors in Lineage 3 (T11, T21, the early escape lesions (R1 and R2) and late-emerging resistant lesions (R2 and R3.2) and the post-autopsy lesions). These mutations are all found in chromosome 15, with a corresponding LOH in chromosome 15q. (c) Mutational Cluster Defining Early Resistant Small Bowel Metastasis. This cluster represents the acquired mutations shared between the small bowel metastasis (R1) and the other late resistant tumors which also share a bi-allelic CDKN2A deletion. 2/4 mutations were inferred to have multiplicity of 2, and 2/4 multiplicity of 1, consistent with a unique genome doubling event just prior to the emergence of this tumor in lineage 3, and present in all subsequent resistant tumors. These mutations were manually reviewed and showed no evidence of artifact, although MYO7A is detectable at a lower level in P4 than the subsequent resistant tumors.
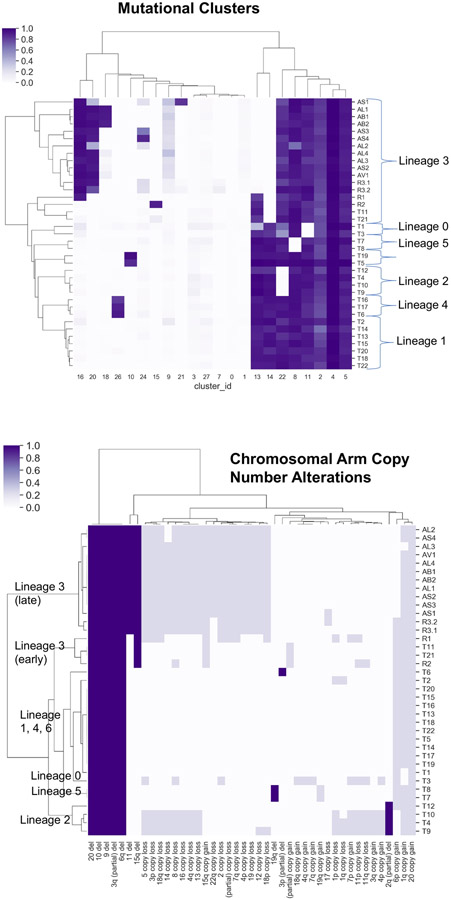
Extended Data Figure 5. Hierarchical Clustering of Mutational Clusters CCFs and Copy Number Alterations define concordant tumor lineages.
Top: Hierarchically clustered heatmap of inferred cancer cell fractions (CCFs) for each mutation cluster (columns) for each tumor (rows), demonstrating 7 different lineages. Bottom: Hierarchically clustered heatmap of large copy number alterations (columns) for each tumor (rows), demonstrating concordance with lineages derived from mutational clusters. Complete allelic deletions are dark blue, and copy number gains and losses are light blue.
Extended Data Figure 6. Aneuploidy in Genome-Doubled vs. non-Genome-Doubled tumors.
Aneuploidy here is defined as the proportion of the genome with copy number gain or loss (compared to the “baseline” allelic copy number, which is 1 for non-genome doubled tumors and 2 for genome doubled tumors). (a) Allelic copy number ratios for a representative non-genome doubled tumor (T13 from lineage 1, upper), and a genome-doubled tumor (R1, the jejunal metastasis from lineage 3, lower). The x axis is the genome (chromosomes in increasing number), and y represents the relative inferred copy number at that genomic location. (b) A different representation of the inferred allelic copy from T13 and R1 demonstrating increased aneuploidy in the genome-doubled tumor. (c) The genome doubled tumors (n=19) had evidence of chromosomal instability, with higher proportion of genome with aneuploidy (two-sided Mann-Whitney p=2.2e-07, Methods) compared to non-genome doubled tumors (n=18) (upper panel). Late resistant tumors (D1500+) had the higher aneuploidy compared to all other tumors, (lower panel). Boxplots: box limits indicate the IQR (25th to 75th percentiles), with a center line indicating the median. Whiskers show the value ranges up to 1.5 × IQR above the 75th or below the 25th percentiles, with outliers beyond those ranges shown as individual points
Extended Data Figure 7. Tumor Immune Microenvironment.
(a) Tumors from the patient (n=20) had lower overall immune signature score compared to a large cohort of PD-1 treated melanoma patients (n=121) (MWW nominal two-sided p = 0.036); . (b) overall Immune signature scores in tumors biopsied within the first 120 days after immunotherapy initiation decreased after initiation of immune checkpoint blockade (linear regression p = 0.020). (c) T cell signature scores in the same tumors decrease after initiation of immune checkpoint blockade (linear regression p = 0.008). (d) All immune cell signature scores in the same tumors and their association with time after treatment. Negative coefficients are associated with a decrease in score with time after treatment. Boxplots: box limits indicate the IQR (25th to 75th percentiles), with a center line indicating the median. Whiskers show the value ranges up to 1.5 × IQR above the 75th or below the 25th percentiles, with outliers beyond those ranges shown as individual points
Extended Data Figure 8. Quantification of Selected Immune and Tumor Populations from CyCIF. Selected immune cell and NGFR-high subset proportions over time by spatial compartment.
(a) CD4+ Treg cells; (b) NGFR-high tumor cells. Error bars represent standard error of the mean (S.E.M.). Sample numbers for each days are: 1(day −62), 1(day −22), 4(day 4), 4(day 39), 2(day 62), 3(day 76), 3(day 92), 1(day 109), 1(day 1028), 1(day 1849), 1(day 1862), 10(day 2065).
Extended Data Figure 9. Gaussian Mixture Modelling of CyCIF data.
(a) Heatmap demonstrating clusters of cells from Gaussian Mixture Model clustering characterized by a range of CyCIF quantitative fluorescence (Methods) from the 19 tumors in Batch 1. (b) Heatmap demonstrating clusters of cells from Gaussian Mixture Model clustering characterized by a range of CyCIF quantitative fluorescence (Methods) from the pre- and post-TLR9 + antiPD1 therapy tumors (Batch 2). (Top) There is a distinct NGFR-Hi tumor cell cluster, which is high in PD-L1 protein expression, a MITF-Hi/NGFR-lo tumor cell cluster, and an immune cell cluster. Several non-specific (i.e. non-NGFR-Hi, non-MITF-Hi) tumor cell clusters are also seen. (Bottom) There is a strong association between NGFR and PD-L1 expression among S100+ gated tumor cells (Pearson correlation coefficient r = 0.66 and p-value = 0, calculated by the default function in MATLAB).
Extended Data Figure 10. Expression of class I and class II MHC and of clonal ancestral neoantigens in lineage 3 and over time.
(a) MHC-I and −II scores were generated from bulk RNAseq and compared between Lineage 3 tumors (n=3) and other tumors (n=17). Scores for each sample were calculated using an averaged standardized z-score of 6 MHC-I genes (HLA-A, HLA-B, HLA-C, B2M, TAP1, TAP2) and 13 MHC-II genes (HLA-DMA, HLA-DMB, HLA-DOA, HLA-DOB, HLA-DPA1, HLA-DPB1, HLA-DQA1, HLA-DQA2, HLA-DQB1, HLA-DQB2, HLA-DRA, HLA-DRB1, HLA-DRB5). (Left) Lineage 3 has lower MHC-I score compared to other tumors (t-test p = 0.01). (Right) Lineage 3 tumors do not have a statistically significant difference in MHC-II score compared to other tumors (t-test p = 0.13). (b) Expression of clonal ancestral neoantigens in lineage 3 and over time. Neoantigens were inferred using NetMHCPan with inputs of the patient’s HLA and mutations. 174 genes with clonal ancestral mutations that coded for neoantigens were identified, and their RNAseq expression (TPM) in each tumor calculated. Overall expression, Chr15 neoantigen expression (i.e. the expression of the 3 genes with clonal ancestral mutations lost with LOH of Chr15 in Lineage 3 tumors), and the proportion of the overall neoantigen expression that Chr15 neoantigen genes represented were calculated. Left: Lineage 3 vs other tumors. Overall expression was not different, but there was a trend towards lower expression and proportion of expression of Chr15 neoantigen genes in Lineage 3 tumors. Right: Expression over time in the on-treatment time period (D27-D109). Overall neoantigen gene expression was not different by time, but Chr15 neoantigen gene expression and the proportion of Chr15 neoantigen gene expression trended towards decreasing with time.
Boxplots: box limits indicate the IQR (25th to 75th percentiles), with a center line indicating the median. Whiskers show the value ranges up to 1.5 × IQR above the 75th or below the 25th percentiles, with outliers beyond those ranges shown as individual points
Supplementary Material
ACKNOWLEDGEMENTS
This work was supported by the Dr. Miriam and Sheldon G. Adelson Medical Research Foundation (M.H.), the Harvard Ludwig Center for Cancer Research, the National Science Foundation (Grant No. DGE-1144152, Graduate Research Fellowship #2016226995), the Conquer Cancer Foundation Young Investigator Award (.D.L.), the Damon Runyon Cancer Research Foundation (Physician Scientist Training Grant (D.L.), Postdoctoral Fellowship (DRQ-03-20, D.S.)), the National Institutes of Health (Grants R01CA227388, K08CA222663 (B.I.), K08CA234458 (D.L.), and U54-CA225088 (B.I., .L., S.W., S.M., D.S., and P.K.S), P01 CA114046 (M.H.), P50 CA174523 (M.H.), U54 CA224070 (M.H.)), DoD – PRCRP W81XWH-16-1-0119 (CA150619) (M.H.), BroadNext10 (E.M.V.A.), Society for Immunotherapy of Cancer Translational Postdoctoral Fellowship (D.L.), the Burroughs Wellcome Fund Career Award for Medical Scientists (B.I.); the Louis V. Gerstner, Jr Scholars Program (B.I.); and the Velocity Fellow Program (B.I.), Abeloff V foundation scholar grant (B.I.), the Barr Award for Innovative Translational Research, Early Postdoc Mobility fellowship (no. P2ZHP3_181475) (D.S.), and the Swiss National Science Foundation (no. P2ZHP3_178022) (M.M).
Footnotes
Conflicts of Interest Statement
D.L. reports funding by a postdoctoral fellowship from the Society for Immunotherapy of Cancers which is funded in part by an educational grant from Bristol-Meyers Squibb (BMS). BMS has had no input into the conception, conduct, or reporting of the submitted work. D.C. has received consulting (GSK, Lilly, Boston Pharmaceuticals) and travel/speaking (Merck) support, outside the scope of the present work. G.M.B. had sponsored research agreements with Takeda Oncology, Palleon Pharmaceuticals, Olink Proteomics, which were not used to support this work. She served as a speaker for Novartis and on scientific advisory boards for Nektar Therapeutics and Novartis and consults for Merck, all of which are outside the scope of this work. P.K.B has consulted for Angiochem, Genentech-Roche, Lilly, Tesaro, Voyager Therapeutics, ElevateBio, Pfizer (Array), Pfizer, SK Life Sciences and Dantari, received grant/research support (to Massachusetts General Hospital) from Merck, BMS and Lilly and honoraria from Merck, Pfizer, Genentech-Roche and Lilly, outside the scope of this present work. R.J.S. has served as consultant and/or on Scientific Advisory Boards for Asana Biosciences, AstraZeneca, Bristol-Myers Squibb, Eisai, Iovance, Merck, Novartis, Oncosec, Pfizer, Replimune and reports research funding from Merck, outside the scope of this present work. A.S has received consulting (Lead Pharma, Checkmate, and C-reveal Therapeutics) support, outside the scope of the present work. Dr. Flaherty has/had served on the Board of Directors of Loxo Oncology, Clovis Oncology, Strata Oncology, Vivid Biosciences, Checkmate Pharmaceuticals, and Kinnate Pharmaceuticals; Corporate Advisory Board of X4 Pharmaceuticals; Scientific Advisory Boards of PIC Therapeutics, Sanofi, Amgen, Asana, Adaptimmune, Aeglea, Shattuck Labs, Tolero, Apricity, Oncoceutics, Fog Pharma, Neon, Tvardi, xCures, Monopteros, Vibliome; and as consultant to Lilly, Novartis, Genentech, BMS, Merck, Takeda, Verastem, Boston Biomedical, Pierre Fabre, Debiopharm; and received research funding from Novartis and Sanofi. B.I. is a consultant for Merck and Volastra Therapeutics. A.S has received consulting (Lead Pharma, Checkmate, and C-reveal Therapeutics) support, outside the scope of the present work. P.K.S is a member of the Board of Directors of Applied Biomath and Glencoe Software and member of the SAB for RareCyte and NanoString; he has equity in the first three of these companies. In the last five years the Sorger lab has received research funding from Novartis and Merck. E.M.V.A. has consulted or advised for Tango Therapeutics, Genome Medical, Invitae, Enara Bio, Janssen, Manifold Bio, Monte Rosa, and holds equity in Tango Therapeutics, Genome Medical, Syapse, Enara Bio, Manifold Bio, Microsoft, Monte Rosa; received research support from Novartis and BMS, travel reimbursement from Roche/Genentech, and has Institutional patents filed on chromatin mutations and immunotherapy response, and methods for clinical interpretation. All other authors declare no competing interests.
DATA AVAILABILITY
All requests for raw and analyzed data and materials will be promptly reviewed by the senior author (Dr. Boland) to verify if the request is subject to any intellectual property or confidentiality obligations. Patient-related data not included in the paper may be subject to patient confidentiality. Any data and materials that can be shared will be released via a Material Transfer Agreement. All analyzed sequencing data are in supplementary data available at the journal website, and any additional data made publicly available after publication will be found at https://github.com/davidliu-lab/Pt98. All t-CyCIF tissue images are available for online viewing: https://www.cycif.org/data/liu-lin-2019/. Raw sequencing data have been deposited into dbGAP, phs001427.v2.p1, which is publicly accessible. Matched clinical and sequencing characteristics of tumors are in Supplementary Table 1.
REFERENCES
- 1.Wolchok JD, Chiarion-Sileni V, Gonzalez R, et al. Overall Survival with Combined Nivolumab and Ipilimumab in Advanced Melanoma. N Engl J Med. 2017;377(14):1345–1356. doi: 10.1056/NEJMoa1709684 [DOI] [PMC free article] [PubMed] [Google Scholar]
- 2.Robert C, Schachter J, Long GV, et al. Pembrolizumab versus Ipilimumab in Advanced Melanoma. New England Journal of Medicine. 2015;372(26):2521–2532. doi: 10.1056/NEJMoa1503093 [DOI] [PubMed] [Google Scholar]
- 3.Larkin J, Chiarion-Sileni V, Gonzalez R, et al. Five-Year Survival with Combined Nivolumab and Ipilimumab in Advanced Melanoma. N Engl J Med. 2019;381(16):1535–1546. doi: 10.1056/NEJMoa1910836 [DOI] [PubMed] [Google Scholar]
- 4.Sharma P, Hu-Lieskovan S, Wargo JA, Ribas A. Primary, Adaptive, and Acquired Resistance to Cancer Immunotherapy. Cell. 2017;168(4):707–723. doi: 10.1016/j.cell.2017.01.017 [DOI] [PMC free article] [PubMed] [Google Scholar]
- 5.Spranger S, Bao R, Gajewski TF. Melanoma-intrinsic β-catenin signalling prevents anti-tumour immunity. Nature. 2015;523(7559):231. doi: 10.1038/nature14404 [DOI] [PubMed] [Google Scholar]
- 6.George S, Miao D, Demetri GD, et al. Loss of PTEN Is Associated with Resistance to Anti-PD-1 Checkpoint Blockade Therapy in Metastatic Uterine Leiomyosarcoma. Immunity. 46(2):197–204. doi: 10.1016/j.immuni.2017.02.001 [DOI] [PMC free article] [PubMed] [Google Scholar]
- 7.Xiao Q, Wu J, Wang W-J, et al. DKK2 imparts tumor immunity evasion through β-catenin-independent suppression of cytotoxic immune-cell activation. Nat Med. 2018;24(3):262–270. doi: 10.1038/nm.4496 [DOI] [PMC free article] [PubMed] [Google Scholar]
- 8.Peng W, Chen JQ, Liu C, et al. Loss of PTEN Promotes Resistance to T Cell-Mediated Immunotherapy. Cancer Discov. 2016;6(2):202–216. doi: 10.1158/2159-8290.CD-15-0283 [DOI] [PMC free article] [PubMed] [Google Scholar]
- 9.Zaretsky JM, Garcia-Diaz A, Shin DS, et al. Mutations Associated with Acquired Resistance to PD-1 Blockade in Melanoma. N Engl J Med. 2016;375(9):819–829. doi: 10.1056/NEJMoa1604958 [DOI] [PMC free article] [PubMed] [Google Scholar]
- 10.Sade-Feldman M, Jiao YJ, Chen JH, et al. Resistance to checkpoint blockade therapy through inactivation of antigen presentation. Nat Commun. 2017;8(1). [DOI] [PMC free article] [PubMed] [Google Scholar]
- 11.Gao J, Shi LZ, Zhao H, et al. Loss of IFN-Gamma Pathway Genes in Tumor Cells as a Mechanism of Resistance to Anti-CTLA-4 Therapy. Cell. 167(2):397–404.e9. doi: 10.1016/j.cell.2016.08.069 [DOI] [PMC free article] [PubMed] [Google Scholar]
- 12.Davoli T, Uno H, Wooten EC, Elledge SJ. Tumor aneuploidy correlates with markers of immune evasion and with reduced response to immunotherapy. Science (New York, NY). 2017;355(6322). doi: 10.1126/science.aaf8399 [DOI] [PMC free article] [PubMed] [Google Scholar]
- 13.Roh W, Chen P-L, Reuben A, et al. Integrated molecular analysis of tumor biopsies on sequential CTLA-4 and PD-1 blockade reveals markers of response and resistance. Sci Transl Med. 2017;9(379). doi: 10.1126/scitranslmed.aah3560 [DOI] [PMC free article] [PubMed] [Google Scholar]
- 14.Goel S, DeCristo MJ, Watt AC, et al. CDK4/6 inhibition triggers anti-tumour immunity. Nature. 2017;548(7668):471. doi: 10.1038/nature23465 [DOI] [PMC free article] [PubMed] [Google Scholar]
- 15.Rambow F, Rogiers A, Marin-Bejar O, et al. Toward Minimal Residual Disease-Directed Therapy in Melanoma. Cell. 2018;174(4):843–855.e19. doi: 10.1016/j.cell.2018.06.025 [DOI] [PubMed] [Google Scholar]
- 16.Restivo G, Diener J, Cheng PF, et al. The low affinity neurotrophin receptor CD271 regulates phenotype switching in melanoma. Nature Communications. 2017;8(1):1988. doi: 10.1038/s41467-017-01573-6 [DOI] [PMC free article] [PubMed] [Google Scholar]
- 17.Jerby-Arnon L, Shah P, Cuoco MS, et al. A Cancer Cell Program Promotes T Cell Exclusion and Resistance to Checkpoint Blockade. Cell. 2018;175(4):984–997.e24. doi: 10.1016/j.cell.2018.09.006 [DOI] [PMC free article] [PubMed] [Google Scholar]
- 18.Burrell RA, McGranahan N, Bartek J, Swanton C. The causes and consequences of genetic heterogeneity in cancer evolution. Nature. 2013;501(7467):338–345. doi: 10.1038/nature12625 [DOI] [PubMed] [Google Scholar]
- 19.Gerlinger M, Rowan AJ, Horswell S, et al. Intratumor Heterogeneity and Branched Evolution Revealed by Multiregion Sequencing. New England Journal of Medicine. 2012;366(10):883–892. doi: 10.1056/NEJMoa1113205 [DOI] [PMC free article] [PubMed] [Google Scholar]
- 20.Jamal-Hanjani M, Wilson GA, McGranahan N, et al. Tracking the Evolution of Non–Small-Cell Lung Cancer. New England Journal of Medicine. 2017;376(22):2109–2121. doi: 10.1056/NEJMoa1616288 [DOI] [PubMed] [Google Scholar]
- 21.Faltas BM, Prandi D, Tagawa ST, et al. Clonal evolution of chemotherapy-resistant urothelial carcinoma. Nat Genet. Published online October17, 2016. doi: 10.1038/ng.3692 [DOI] [PMC free article] [PubMed] [Google Scholar]
- 22.Andor N, Graham TA, Jansen M, et al. Pan-cancer analysis of the extent and consequences of intratumor heterogeneity. Nat Med. 2016;22(1):105–113. doi: 10.1038/nm.3984 [DOI] [PMC free article] [PubMed] [Google Scholar]
- 23.Ding L, Kim M, Kanchi KL, et al. Clonal Architectures and Driver Mutations in Metastatic Melanomas. PLOS ONE. 2014;9(11):e111153. doi: 10.1371/journal.pone.0111153 [DOI] [PMC free article] [PubMed] [Google Scholar]
- 24.Jiménez-Sánchez A, Memon D, Pourpe S, et al. Heterogeneous Tumor-Immune Microenvironments among Differentially Growing Metastases in an Ovarian Cancer Patient. Cell. 2017;170(5):927–938.e20. doi: 10.1016/j.cell.2017.07.025 [DOI] [PMC free article] [PubMed] [Google Scholar]
- 25.Liu D, Abbosh P, Keliher D, et al. Mutational patterns in chemotherapy resistant muscle-invasive bladder cancer. Nature Communications. 2017;8(1):2193. doi: 10.1038/s41467-017-02320-7 [DOI] [PMC free article] [PubMed] [Google Scholar]
- 26.Juric D, Castel P, Griffith M, et al. Convergent loss of PTEN leads to clinical resistance to a PI(3)Kalpha inhibitor. Nature. 2015;518(7538):240–244. doi: 10.1038/nature13948 [DOI] [PMC free article] [PubMed] [Google Scholar]
- 27.Chen P-L, Roh W, Reuben A, et al. Analysis of Immune Signatures in Longitudinal Tumor Samples Yields Insight into Biomarkers of Response and Mechanisms of Resistance to Immune Checkpoint Blockade. Cancer Discov. 2016;6(8):827–837. doi: 10.1158/2159-8290.CD-15-1545 [DOI] [PMC free article] [PubMed] [Google Scholar]
- 28.Edwards J, Tasker A, da Silva IP, et al. Prevalence and Cellular Distribution of Novel Immune Checkpoint Targets Across Longitudinal Specimens in Treatment-naïve Melanoma Patients: Implications for Clinical Trials. Clin Cancer Res. 2019;25(11):3247–3258. doi: 10.1158/1078-0432.CCR-18-4011 [DOI] [PubMed] [Google Scholar]
- 29.Dewhurst SM, McGranahan N, Burrell RA, et al. Tolerance of whole-genome doubling propagates chromosomal instability and accelerates cancer genome evolution. Cancer Discov. 2014;4(2):175–185. doi: 10.1158/2159-8290.CD-13-0285 [DOI] [PMC free article] [PubMed] [Google Scholar]
- 30.TCGA. Genomic Classification of Cutaneous Melanoma. Cell. 2015;161(7):1681–1696. [DOI] [PMC free article] [PubMed] [Google Scholar]
- 31.Liu D, Schilling B, Liu D, et al. Integrative molecular and clinical modeling of clinical outcomes to PD1 blockade in patients with metastatic melanoma. Nat Med. 2019;25(12):1916–1927. doi: 10.1038/s41591-019-0654-5 [DOI] [PMC free article] [PubMed] [Google Scholar]
- 32.Barbie DA, Tamayo P, Boehm JS, et al. Systematic RNA interference reveals that oncogenic KRAS-driven cancers require TBK1. Nature. 2009;462(7269):108–112. doi: 10.1038/nature08460 [DOI] [PMC free article] [PubMed] [Google Scholar]
- 33.Liberzon A, Birger C, Thorvaldsdóttir H, Ghandi M, Mesirov JP, Tamayo P. The Molecular Signatures Database Hallmark Gene Set Collection. Cell Systems. 2015;1(6):417–425. doi: 10.1016/j.cels.2015.12.004 [DOI] [PMC free article] [PubMed] [Google Scholar]
- 34.Maniotis AJ, Folberg R, Hess A, et al. Vascular channel formation by human melanoma cells in vivo and in vitro: vasculogenic mimicry. Am J Pathol. 1999;155(3):739–752. doi: 10.1016/S0002-9440(10)65173-5 [DOI] [PMC free article] [PubMed] [Google Scholar]
- 35.Landsberg J, Kohlmeyer J, Renn M, et al. Melanomas resist T-cell therapy through inflammation-induced reversible dedifferentiation. Nature. 2012;490(7420):412–416. doi: 10.1038/nature11538 [DOI] [PubMed] [Google Scholar]
- 36.Sottoriva A, Kang H, Ma Z, et al. A Big Bang model of human colorectal tumor growth. Nature Genetics. 2015;47(3):209–216. doi: 10.1038/ng.3214 [DOI] [PMC free article] [PubMed] [Google Scholar]
- 37.Rooney MS, Shukla SA, Wu CJ, Getz G, Hacohen N. Molecular and genetic properties of tumors associated with local immune cytolytic activity. Cell. 2015;160(1–2):48–61. doi: 10.1016/j.cell.2014.12.033 [DOI] [PMC free article] [PubMed] [Google Scholar]
- 38.Riaz N, Havel JJ, Makarov V, et al. Tumor and Microenvironment Evolution during Immunotherapy with Nivolumab. Cell. Published online October11, 2017. doi: 10.1016/j.cell.2017.09.028 [DOI] [PMC free article] [PubMed] [Google Scholar]
- 39.Lehraiki A, Cerezo M, Rouaud F, et al. Increased CD271 expression by the NF-kB pathway promotes melanoma cell survival and drives acquired resistance to BRAF inhibitor vemurafenib. Cell Discov. 2015;1(1):1–13. doi: 10.1038/celldisc.2015.30 [DOI] [PMC free article] [PubMed] [Google Scholar]
- 40.Shaffer SM, Dunagin MC, Torborg SR, et al. Rare cell variability and drug-induced reprogramming as a mode of cancer drug resistance. Nature. 2017;546(7658):431–435. doi: 10.1038/nature22794 [DOI] [PMC free article] [PubMed] [Google Scholar]
- 41.Boshuizen J, Vredevoogd DW, Krijgsman O, et al. Reversal of pre-existing NGFR-driven tumor and immune therapy resistance. Nature Communications. 2020;11(1):3946. doi: 10.1038/s41467-020-17739-8 [DOI] [PMC free article] [PubMed] [Google Scholar]
- 42.Valyi-Nagy K, Kormos B, Ali M, Shukla D, Valyi-Nagy T. Stem cell marker CD271 is expressed by vasculogenic mimicry-forming uveal melanoma cells in three-dimensional cultures. Mol Vis. 2012;18. [PMC free article] [PubMed] [Google Scholar]
- 43.Tan LY, Martini C, Fridlender ZG, Bonder CS, Brown MP, Ebert LM. Control of immune cell entry through the tumour vasculature: a missing link in optimising melanoma immunotherapy? Clin Transl Immunology. 2017;6(3):e134. doi: 10.1038/cti.2017.7 [DOI] [PMC free article] [PubMed] [Google Scholar]
- 44.Shi A, Kasumova GG, Michaud WA, et al. Plasma-derived extracellular vesicle analysis and deconvolution enable prediction and tracking of melanoma checkpoint blockade outcome. Science Advances. 2020;6(46):eabb3461. doi: 10.1126/sciadv.abb3461 [DOI] [PMC free article] [PubMed] [Google Scholar]
- 45.Marsavela G, Lee J, Calapre L, et al. Circulating Tumor DNA Predicts Outcome from First-, but not Second-line Treatment and Identifies Melanoma Patients Who May Benefit from Combination Immunotherapy. Clin Cancer Res. 2020;26(22):5926–5933. doi: 10.1158/1078-0432.CCR-20-2251 [DOI] [PubMed] [Google Scholar]
Methods only references:
- 46.Van Allen EM, Wagle N, Stojanov P, et al. Whole-exome sequencing and clinical interpretation of formalin-fixed, paraffin-embedded tumor samples to guide precision cancer medicine. Nat Med. 2014;20(6):682–688. doi: 10.1038/nm.3559 [DOI] [PMC free article] [PubMed] [Google Scholar]
- 47.Fisher S, Barry A, Abreu J, et al. A scalable, fully automated process for construction of sequence-ready human exome targeted capture libraries. Genome biology. 2011;12(1):R1. doi: 10.1186/gb-2011-12-1-r1 [DOI] [PMC free article] [PubMed] [Google Scholar]
- 48.Gnirke A, Melnikov A, Maguire J, et al. Solution hybrid selection with ultra-long oligonucleotides for massively parallel targeted sequencing. Nature biotechnology. 2009;27(2):182–189. doi: 10.1038/nbt.1523 [DOI] [PMC free article] [PubMed] [Google Scholar]
- 49.Cibulskis K, McKenna A, Fennell T, Banks E, DePristo M, Getz G. ContEst: Estimating cross-contamination of human samples in next generation sequencing data. Bioinformatics. Published online 2011. [DOI] [PMC free article] [PubMed] [Google Scholar]
- 50.Lawrence MS, Stojanov P, Mermel CH, et al. Discovery and saturation analysis of cancer genes across 21 tumour types. Nature. 2014;505(7484):495–501. doi: 10.1038/nature12912 [DOI] [PMC free article] [PubMed] [Google Scholar]
- 51.Hodis E, Watson IR, Kryukov GV, et al. A landscape of driver mutations in melanoma. Cell. 2012;150(2):251–263. [DOI] [PMC free article] [PubMed] [Google Scholar]
- 52.Cibulskis K, Lawrence MS, Carter SL, et al. Sensitive detection of somatic point mutations in impure and heterogeneous cancer samples. Nat Biotechnol. 2013;31(3):213–219. doi: 10.1038/nbt.2514 [DOI] [PMC free article] [PubMed] [Google Scholar]
- 53.Saunders CT, Wong WSW, Swamy S, Becq J, Murray LJ, Cheetham RK. Strelka: accurate somatic small-variant calling from sequenced tumor–normal sample pairs. Bioinformatics. 2012;28(14):1811–1817. [DOI] [PubMed] [Google Scholar]
- 54.Ramos AH, Lichtenstein L, Gupta M, et al. Oncotator: cancer variant annotation tool. Human mutation. 2015;36(4):E2423–9. doi: 10.1002/humu.22771 [DOI] [PMC free article] [PubMed] [Google Scholar]
- 55.Costello M, Pugh TJ, Fennell TJ, et al. Discovery and characterization of artifactual mutations in deep coverage targeted capture sequencing data due to oxidative DNA damage during sample preparation. Nucleic Acids Res. 2013;41(6):e67. doi: 10.1093/nar/gks1443 [DOI] [PMC free article] [PubMed] [Google Scholar]
- 56.Olshen AB, Venkatraman ES, Lucito R, Wigler M. Circular binary segmentation for the analysis of array-based DNA copy number data. Biostatistics. 2004;5(4):557–572. doi: 10.1093/biostatistics/kxh008 [DOI] [PubMed] [Google Scholar]
- 57.Shen R, Olshen AB, Ladanyi M. Integrative clustering of multiple genomic data types using a joint latent variable model with application to breast and lung cancer subtype analysis. Bioinformatics. 2009;25(22):2906–2912. doi: 10.1093/bioinformatics/btp543 [DOI] [PMC free article] [PubMed] [Google Scholar]
- 58.Carter SL, Cibulskis K, Helman E, et al. Absolute quantification of somatic DNA alterations in human cancer. Nature biotechnology. 2012;30(5):413–421. doi: 10.1038/nbt.2203 [DOI] [PMC free article] [PubMed] [Google Scholar]
- 59.Brastianos PK, Carter SL, Santagata S, et al. Genomic Characterization of Brain Metastases Reveals Branched Evolution and Potential Therapeutic Targets. Cancer Discov. 2015;5(11):1164–1177. doi: 10.1158/2159-8290.CD-15-0369 [DOI] [PMC free article] [PubMed] [Google Scholar]
- 60.Burrell RA, McClelland SE, Endesfelder D, et al. Replication stress links structural and numerical cancer chromosomal instability. Nature. 2013;494(7438):492–496. doi: 10.1038/nature11935 [DOI] [PMC free article] [PubMed] [Google Scholar]
- 61.Roth A, Khattra J, Yap D, et al. PyClone: statistical inference of clonal population structure in cancer. Nature Methods. 2014;11(4):396–398. doi: 10.1038/nmeth.2883 [DOI] [PMC free article] [PubMed] [Google Scholar]
- 62.Leshchiner I, Livitz D, Gainor JF, et al. Comprehensive analysis of tumour initiation, spatial and temporal progression under multiple lines of treatment. bioRxiv. Published online December31, 2018:508127. doi: 10.1101/508127 [DOI] [Google Scholar]
- 63.Li B, Dewey CN. RSEM: accurate transcript quantification from RNA-Seq data with or without a reference genome. BMC bioinformatics. 2011;12:323. doi: 10.1186/1471-2105-12-323 [DOI] [PMC free article] [PubMed] [Google Scholar]
- 64.Langmead B, Salzberg SL. Fast gapped-read alignment with Bowtie 2. Nat Methods. 2012;9(4):357–359. doi: 10.1038/nmeth.1923 [DOI] [PMC free article] [PubMed] [Google Scholar]
- 65.Shukla SA, Rooney MS, Rajasagi M, et al. Comprehensive analysis of cancer-associated somatic mutations in class I HLA genes. Nature Biotechnology. 2015;33(11):1152. doi: 10.1038/nbt.3344 [DOI] [PMC free article] [PubMed] [Google Scholar]
- 66.Jurtz V, Paul S, Andreatta M, Marcatili P, Peters B, Nielsen M. NetMHCpan-4.0: Improved Peptide-MHC Class I Interaction Predictions Integrating Eluted Ligand and Peptide Binding Affinity Data. J Immunol. 2017;199(9):3360–3368. doi: 10.4049/jimmunol.1700893 [DOI] [PMC free article] [PubMed] [Google Scholar]
- 67.Hundal J, Carreno BM, Petti AA, et al. pVAC-Seq: A genome-guided in silico approach to identifying tumor neoantigens. Genome Medicine. 2016;8(1):11. doi: 10.1186/s13073-016-0264-5 [DOI] [PMC free article] [PubMed] [Google Scholar]
- 68.Lin J-R, Izar B, Wang S, et al. Highly multiplexed immunofluorescence imaging of human tissues and tumors using t-CyCIF and conventional optical microscopes. Elife. 2018;7. doi: 10.7554/eLife.31657 [DOI] [PMC free article] [PubMed] [Google Scholar]
- 69.Lin J-R, Fallahi-Sichani M, Sorger PK. Highly multiplexed imaging of single cells using a high-throughput cyclic immunofluorescence method. Nat Commun. 2015;6:8390. doi: 10.1038/ncomms9390 [DOI] [PMC free article] [PubMed] [Google Scholar]
- 70.Amir ED, Davis KL, Tadmor MD, et al. viSNE enables visualization of high dimensional single-cell data and reveals phenotypic heterogeneity of leukemia. Nature Biotechnology. 2013;31(6):545–552. doi: 10.1038/nbt.2594 [DOI] [PMC free article] [PubMed] [Google Scholar]
- 71.Satija R, Farrell JA, Gennert D, Schier AF, Regev A. Spatial reconstruction of single-cell gene expression data. Nat Biotechnol. 2015;33(5):495–502. doi: 10.1038/nbt.3192 [DOI] [PMC free article] [PubMed] [Google Scholar]
- 72.Wolf FA, Angerer P, Theis FJ. SCANPY: large-scale single-cell gene expression data analysis. Genome Biology. 2018;19(1):15. doi: 10.1186/s13059-017-1382-0 [DOI] [PMC free article] [PubMed] [Google Scholar]
- 73.DeTomaso D, Jones MG, Subramaniam M, Ashuach T, Ye CJ, Yosef N. Functional interpretation of single cell similarity maps. Nat Commun. 2019;10(1):4376. doi: 10.1038/s41467-019-12235-0 [DOI] [PMC free article] [PubMed] [Google Scholar]
- 74.Tirosh I, Izar B, Prakadan SM, et al. Dissecting the multicellular ecosystem of metastatic melanoma by single-cell RNA-seq. Science (New York, NY). 2016;352(6282):189–196. doi: 10.1126/science.aad0501 [DOI] [PMC free article] [PubMed] [Google Scholar]
- 75.Subramanian A, Tamayo P, Mootha VK, et al. Gene set enrichment analysis: a knowledge-based approach for interpreting genome-wide expression profiles. Proceedings of the National Academy of Sciences of the United States of America. 2005;102(43):15545–15550. doi: 10.1073/pnas.0506580102 [DOI] [PMC free article] [PubMed] [Google Scholar]
Associated Data
This section collects any data citations, data availability statements, or supplementary materials included in this article.
Supplementary Materials
Data Availability Statement
All requests for raw and analyzed data and materials will be promptly reviewed by the senior author (Dr. Boland) to verify if the request is subject to any intellectual property or confidentiality obligations. Patient-related data not included in the paper may be subject to patient confidentiality. Any data and materials that can be shared will be released via a Material Transfer Agreement. All analyzed sequencing data are in supplementary data available at the journal website, and any additional data made publicly available after publication will be found at https://github.com/davidliu-lab/Pt98. All t-CyCIF tissue images are available for online viewing: https://www.cycif.org/data/liu-lin-2019/. Raw sequencing data have been deposited into dbGAP, phs001427.v2.p1, which is publicly accessible. Matched clinical and sequencing characteristics of tumors are in Supplementary Table 1.


