

Abstract
Objective: This study aimed to examine the relationship between microalbuminuria and long-term life expectancy or limb events in patients with peripheral arterial disease (PAD).
Materials and Methods: A prospective cohort study was performed in 714 patients with PAD. The primary outcomes were cardiovascular or cerebrovascular death (CCVD) and all-cause death (AD), and secondary outcomes were major adverse cardiovascular events (MACE) and cardiovascular and/or limb events (CVLE).
Results: The 5, 10, and 15 year survival rates were 82.4%, 53.1%, and 33.0%, respectively. The prevalence of patients with increased microalbuminuria was 39.2%. Higher microalbuminuria, age, C-reactive protein (CRP), lower serum albumin, estimated glomerular filtration rate (eGFR), ankle–brachial pressure index (ABI), diabetes, cerebral infarction, and coronary heart disease (CHD) were associated with CCVD; higher microalbuminuria, age, CRP, D-dimer, lower serum albumin, eGFR, and critical limb ischemia were related to AD; higher microalbuminuria, age, CRP, lower serum albumin, ABI, diabetes, and CHD were related to MACE; higher microalbuminuria, age, lower ABI, cerebral infarction, and CHD were related to CVLE in Cox multivariate analyses (p<0.05). Statins reduced CCVD, AD, MACE, and CVLE (p<0.001).
Conclusion: Higher microalbuminuria was a significant predictor for CCVD, AD, MACE, and CVLE in PAD patients.
Keywords: urinary microalbumin, mortality, major adverse cardiovascular events, events of leg
Introduction
Peripheral arterial disease (PAD) has been associated with reduced survival because of coronary heart disease (CHD) and cerebral infarction.1–5) PAD is frequently associated with chronic kidney disease (CKD),6–8) which is a risk factor for cardiovascular disease and stroke.6,9) Moreover, increased urinary level of microalbumin (MA) is related to a higher risk of CHD and cardiovascular morbidity.10) In patients with established heart failure, reduced estimated glomerular filtration rate (eGFR) and increased urinary MA are independent predictors for heart failure progression and mortality.11) Hence, CKD is classified on the basis of Cause, eGFR categories, and Albuminuria categories, abbreviated as CGA categories.12)
However, long-term cardiovascular or all-cause mortality and cardiovascular or limb event related to the urinary level of MA have not been examined clearly in PAD patients. In the present study, we analyzed the relationship between microalbuminuria and long-term life expectancy or leg event in patients with PAD.
Materials and Methods
Subjects
A total of 725 patients with PAD at the Cardiovascular Hospital of Central Japan were recruited from February 1, 2000, and January 31, 2021. Before initiation, the study protocol was approved by the Medical Ethical Committee of our hospital (CCJ-EA-006), and the study was conducted according to the Declaration of Helsinki. The patients received a full explanation of the study and gave written informed consent. The criteria used for PAD included an ankle–brachial pressure index (ABI) of <0.90, clinical symptoms, and iliac or femoropopliteal artery stenosis of ≥70% defined with ultrasound or angiography. Patients with nephrosis syndrome or those on hemodialysis were excluded from this study.
Baseline patient characteristics
Baseline clinical characteristics for each patient included age, body mass index (BMI), ABI, smoking history, diabetes mellitus (fasting plasma glucose level of >126 mg/dL at least two measurements or a requirement for antidiabetic therapy), and hypertension (receiving oral therapy or blood pressure ≥140/90 mmHg recorded at least twice). A fasting blood sample was collected to measure serum basic metabolic panels. Moreover, we collected a morning urine sample for urinary albumin and creatinine measures. Urinary albumin concentration was measured via turbidimetric immunological technique (Hitachi 7180 automatic analyzer, Hitachi High-Tech Fielding Co., Tokyo, Japan). The urine albumin/creatinine ratio was calculated as mg/g of creatinine (Cr). Patients with an albumin level of <30 mg/gCr were defined as having normoalbuminuria (A1), those with an albumin level of 30–300 mg/gCr (A2), and those with an albumin level of >300 mg/gCr (A3), according to CGA categories.12) All assays were performed at the Health Science Research Institute, Inc. (Saitama, Japan).
An electrocardiogram was recorded for each patient. CHD was determined as a positive sign in stress/rest myocardial perfusion scintigraphy or coronary angiography and a history of this treatment. The eGFR was calculated with the Modification of Diet in Renal Disease equation with Cr level.13)
Endpoints
Each subject was followed up at 1, 2, and 4 months after the procedure and assessed intervals were 4 or 6 months. Medical statuses were evaluated using hospital records and questionnaires for life statuses assessed by the Foot Care Club in our hospital.3,14,15)
The definition of myocardial infarction was described previously.14,16) Cerebral infarction was determined as the presence of a new focal neurological deficit confirmed with computed tomography or magnetic resonance imaging. Restenosis was determined as a decrease in ABI of ≥0.15 and ≥50% stenosis on ultrasonography or angiography,14,17) and major amputation was determined as above-the-ankle amputation.
The primary outcomes were cardiovascular or cerebrovascular death (CCVD) and all-cause death (AD), and secondary outcomes were major adverse cardiovascular events (MACE: AD, nonfatal myocardial or cerebral infarction, or transient ischemic attack) and cardiovascular and/or limb events (CVLE: CCVD, nonfatal myocardial or cerebral infarction, transient ischemic attack, major amputation, or any repeat revascularization for a limb).
Analysis methods
All calculations were performed with IBM SPSS Statistics ver. 25.0 (IBM Corp., Armonk, NY, USA). We used a median (interquartile range) to express continuous variables compared via the Wilcoxon test, and a number (%) to express categorical variables compared via chi-square test. In the follow-up term, the Kaplan–Meier estimates were used to define CCVD, AD, MACE, and CVLE and compared using the log-rank test with Bonferroni correction. In Cox univariate analysis, a hazard ratio and 95% confidence interval were calculated for each factor. In this analysis, risk factors with p<0.05 were used to define significant factors related to outcomes in Cox multivariate analysis. In all analyses, p<0.05 was defined as significant.
Results
AD, urinary MA, and characteristics of subjects
Among 725 subjects, follow-up was available for 714 patients. The median follow-up time was 78 (range, 2–238) months. The mean age of the 714 patients was 72.4±9.3 years. The patients who died were 328 (45.9%) throughout the follow-up time. The causes of deaths were cardiovascular disease (n=119, 36.3%), cerebrovascular disease (n=43, 13.1%), malignancy (n=74, 22.6%), pneumonia (n=49, 14.9%), and other causes (n=43, 13.1%). The prevalence of CCVD was 49.4% (n=162). In all patients, the 5, 10, and 15 year freedom from AD rates were 82.4%, 53.1%, and 33.0%, respectively.
Before patients were separated into two subgroups, the prevalence of urinary MA level of A1, A2, or A3 was 60.8% (n=434), 28.2% (n=201), or 11.1% (n=79), respectively. Table 1 summarizes the baseline clinical characteristics of subjects with normal or increased urinary MA. Patients in A2 or A3 were older; had higher BMI, C-reactive protein (CRP), triglyceride, and D-dimer; and had a lower eGFR. The rates of critical limb ischemia (CLI), stroke, hypertension, and diabetes mellitus were higher in A2 or A3.
Table 1 Characteristics of subjects in A1 and A2 or A3 categories.
| All patients n=714 | A1 n=434 (60.8%) | A2 or A3 n=280 (39.2%) | p-value | |
|---|---|---|---|---|
| Age (years) | 73 (67–79) | 73 (66–79) | 74 (68–79) | 0.035 |
| Gender (male) | 550 (77.0%) | 333 (76.7%) | 217 (77.5%) | 0.442 |
| Body mass index (kg/m2) | 22.4 (20.2–24.5) | 22.1 (19.6–24.1) | 22.8 (20.9–25.1) | 0.001 |
| Ankle–brachial pressure index | 0.68 (0.52–0.82) | 0.68 (0.54–0.81) | 0.68 (0.49–0.82) | 0.432 |
| Critical limb ischemia | 107 (15.0%) | 51 (11.8%) | 56 (20.0%) | 0.021 |
| Coronary heart disease | 250 (35.0%) | 144 (33.2%) | 106 (37.9%) | 0.115 |
| Cerebral infarction | 120 (16.8%) | 64 (14.7%) | 56 (20.0%) | 0.042 |
| Diabetes mellitus | 271 (38.0%) | 127 (29.3%) | 144 (51.4%) | <0.001 |
| Hypertension | 483 (67.6%) | 275 (63.4%) | 208 (74.3%) | 0.001 |
| Smoking | 540 (75.6%) | 330 (76.0%) | 210 (75.0%) | 0.409 |
| Basic metabolic panel | ||||
| Total cholesterol (mg/dL) | 191 (164–220) | 192 (165–223) | 188 (162–217) | 0.817 |
| Triglyceride (mg/dL) | 130 (94–187) | 127 (87–183) | 133 (102–189) | 0.020 |
| HDL-C (mg/dL) | 49 (40–59) | 49 (41–59) | 47 (39–56) | 0.092 |
| LDL-C (mg/dL) | 116 (94–137) | 117 (95–138) | 113 (91–136) | 0.631 |
| C-reactive protein (mg/dL) | 0.18 (0.08–0.45) | 0.16 (0.07–0.43) | 0.20 (0.09–0.46) | 0.005 |
| D-dimer (µg/dL) | 0.8 (0.5–1.7) | 0.7 (0.5–1.5) | 0.9 (0.5–2.1) | 0.016 |
| eGFR (mL/min/1.73 m2) | 60.4 (49.1–72.4) | 63.4 (54.5–73.7) | 54.4 (41.9–71.1) | <0.001 |
| Urinary albumin (mg/gCr) | 18.0 (6.8–83.5) | 8.3 (4.9–15.3) | 108.1 (52.3–340.9) | <0.001 |
| Serum albumin (g/dL) | 4.0 (3.8–4.2) | 4.0 (3.8–4.3) | 4.0 (3.8–4.2) | 0.057 |
| Revascularization | 458 (64.1%) | 286 (65.9%) | 172 (61.4%) | 0.128 |
| Medications | ||||
| Thienopyridines | 264 (37.0%) | 166 (38.2%) | 98 (35.0%) | 0.212 |
| Aspirin | 424 (59.4%) | 263 (60.6%) | 161 (57.5%) | 0.228 |
| Beraprost | 287 (40.2%) | 171 (39.4%) | 116 (41.4%) | 0.322 |
| Cilostazol | 165 (23.1%) | 100 (23.0%) | 65 (23.2%) | 0.514 |
| Ca antagonist | 359 (50.3%) | 206 (47.5%) | 153 (54.6%) | 0.061 |
| β-blocker | 100 (14.0%) | 55 (12.7%) | 45 (16.1%) | 0.122 |
| ARB | 231 (32.4%) | 137 (31.6%) | 94 (33.6%) | 0.316 |
| ACE inhibitor | 76 (10.6%) | 40 (9.2%) | 36 (12.9%) | 0.079 |
| Statin | 464 (65.0%) | 288 (66.4%) | 176 (62.9%) | 0.338 |
A1: urinary albumin levels less than 30 mg/gCr (normoalbuminuria), A2: urinary albumin levels with 30–300 mg/gCr, A3: urinary albumin levels more than 300 mg/gCr HDL-C: high-density lipoprotein cholesterol; LDL-C: low-density lipoprotein cholesterol; eGFR: estimated glomerular filtration rate; ARB: angiotensin receptor blocker; ACE: angiotensin-converting enzyme
Factors for CCVD and AD
The 5, 10, and 15 year rates for freedom from CCVD among A1, A2, or A3 with significant differences (p<0.01) are shown in Fig. 1(a). Higher level of urinary MA, age, CRP, D-dimer, lower level of serum albumin, BMI, ABI, eGFR, CLI, diabetes, cerebral infarction, and CHD were related to CCVD in Cox univariate analysis (Table 2(a), p<0.05). Statin was related to CCVD. Higher urinary level of MA, age, CRP, lower level of serum albumin, eGFR ABI, diabetes, cerebral infarction, and CHD were also associated with CCVD, and statin reduced CCVD in Cox multivariate analysis (p<0.05).
Fig. 1 (a) Freedom from cardiovascular or cerebrovascular death (CCVD) in A1, A2, or A3 category. There were significant differences among A1, A2, or A3 categories (p-values were <0.001, <0.001, and 0.009 in A1 vs. A2, A1 vs. A3, and A2 vs. A3, respectively). (b) Freedom from all-cause death (AD) in A1, A2, or A3 category. There were significant differences among A1, A2, and A3 categories (p-values were 0.048, <0.001, and 0.039 in A1 vs. A2, A1 vs. A3, and A2 vs. A3, respectively).
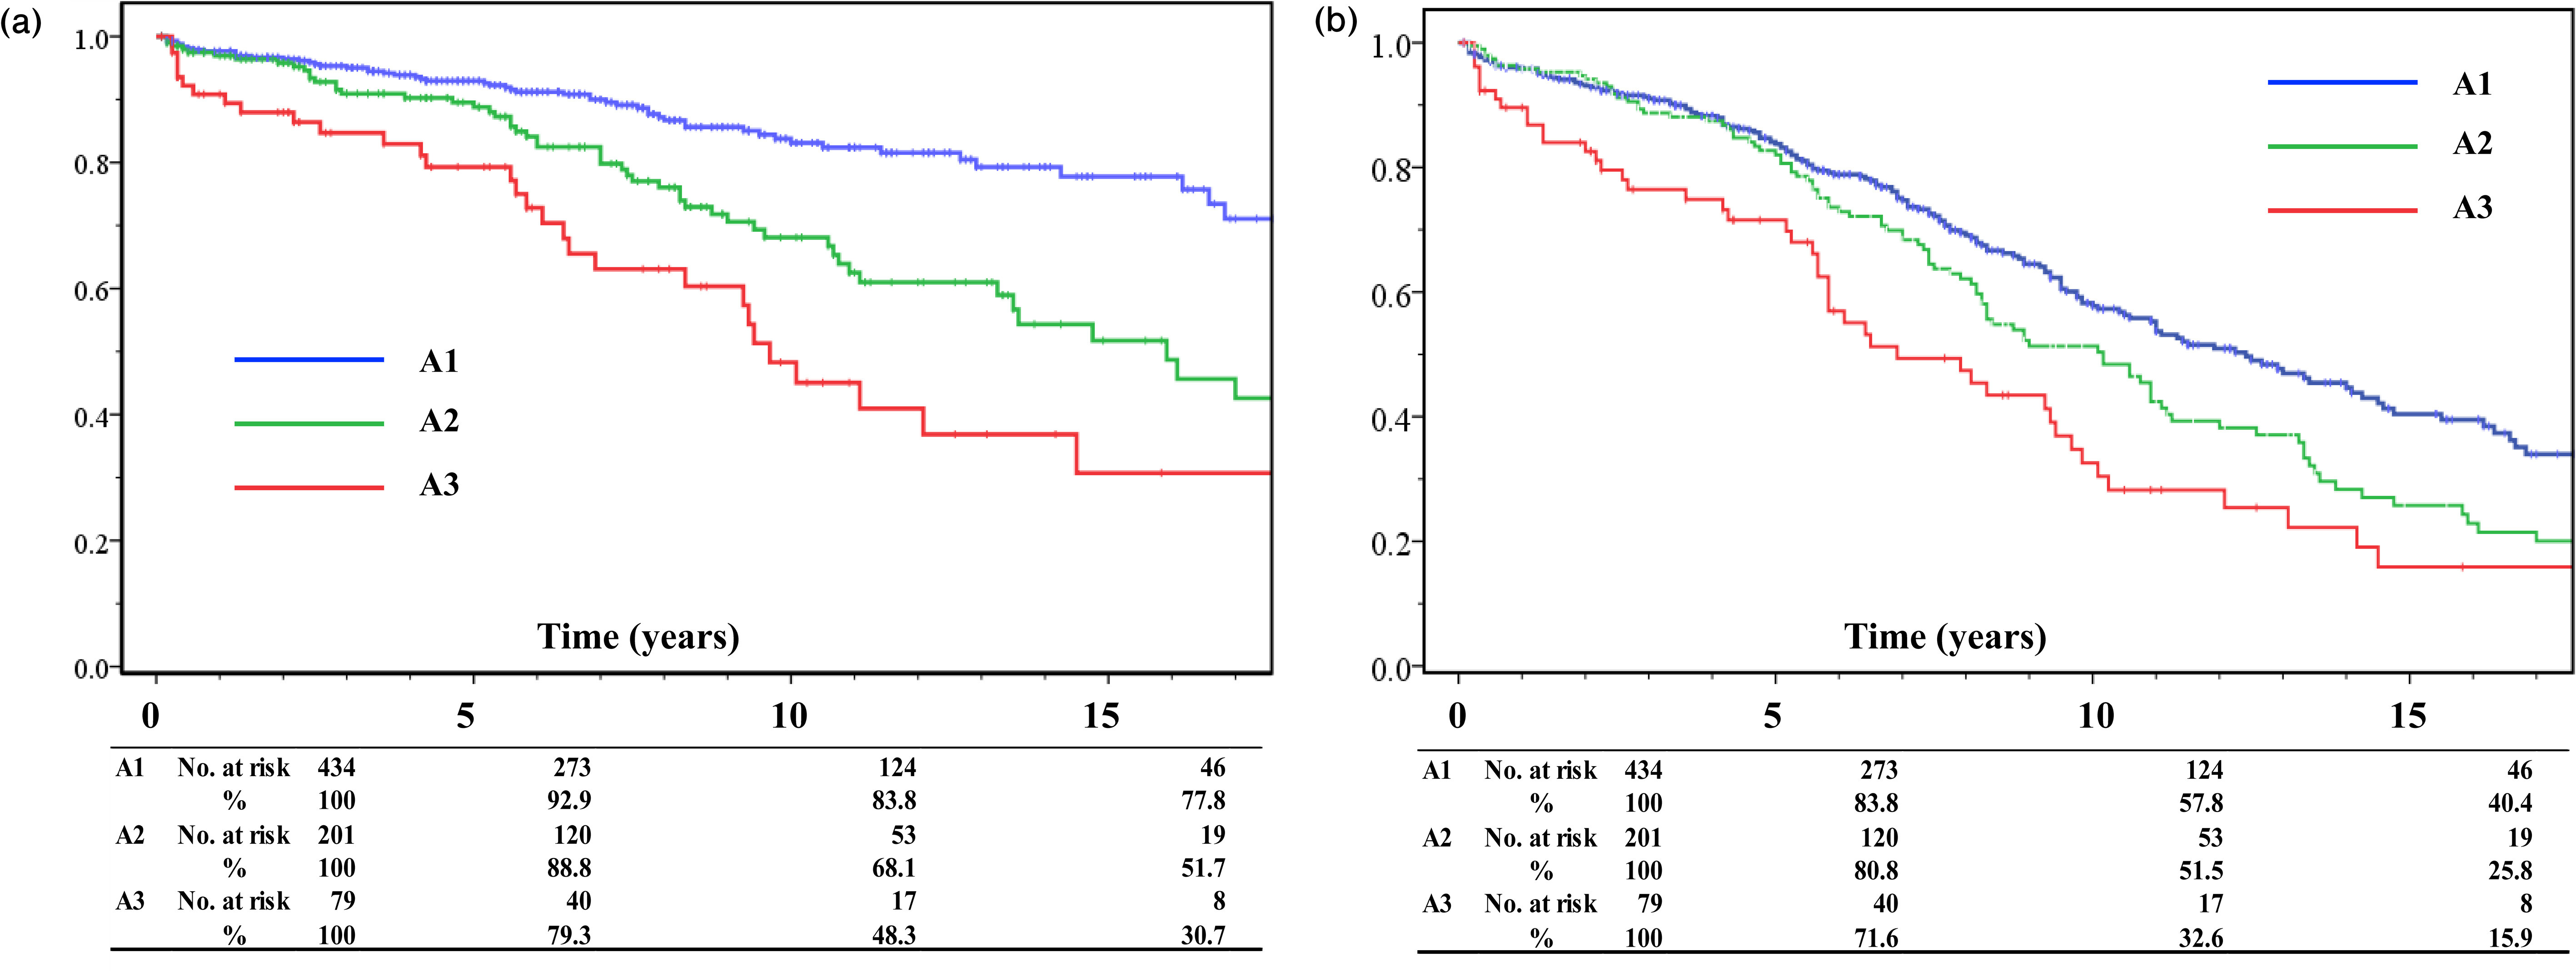
Table 2(a) Univariate and multivariate analyses for cardiovascular or cerebrovascular death.
| Univariate | Multivariate | |||||
|---|---|---|---|---|---|---|
| HR | 95%CI | p-value | HR | 95%CI | p-value | |
| Age (years) | 1.066 | 1.046–1.087 | <0.001 | 1.045 | 1.023–1.068 | <0.001 |
| Sex (male) | 1.049 | 0.693–1.586 | 0.822 | |||
| Body mass index (kg/m2) | 0.902 | 0.855–0.953 | <0.001 | 0.965 | 0.907–1.027 | 0.265 |
| Ankle–brachial pressure index | 0.265 | 0.146–0.478 | <0.001 | 0.431 | 0.205–0.902 | 0.026 |
| Critical limb ischemia | 3.004 | 2.010–4.490 | <0.001 | 1.279 | 0.956–1.711 | 0.098 |
| Diabetes mellitus | 1.699 | 1.222–2.362 | 0.002 | 1.570 | 1.048–2.350 | 0.029 |
| Cerebral infarction | 2.371 | 1.629–3.451 | <0.001 | 1.602 | 1.025–2.504 | 0.039 |
| Coronary heart disease | 1.543 | 1.136–2.178 | 0.006 | 1.482 | 1.001–2.194 | 0.048 |
| Urinary albumin (mg/gCr) | 1.001 | 1.001–1.001 | <0.001 | 1.001 | 1.000–1.001 | 0.020 |
| Serum albumin (g/dL) | 0.225 | 0.153–0.330 | <0.001 | 0.432 | 0.266–0.703 | 0.001 |
| eGFR (mL/min/1.73 m2) | 0.975 | 0.966–0.987 | <0.001 | 0.989 | 0.979–1.000 | 0.042 |
| C-reactive protein (mg/dL) | 1.178 | 1.084–1.280 | <0.001 | 1.168 | 1.046–1.305 | 0.006 |
| D-dimer (µg/dL) | 1.017 | 1.002–1.032 | <0.001 | 1.006 | 0.983–1.030 | 0.615 |
| Statin | 0.308 | 0.213–0.445 | <0.001 | 0.450 | 0.296–0.686 | <0.001 |
HR: hazard ratio; CI: confidence interval; eGFR: estimated glomerular filtration rate
The 5, 10, and 15 year rates for freedom from AD among A1, A2, and A3 with significant differences (p<0.05) are shown in Fig. 1(b). Higher level of urinary MA, age, CRP, D-dimer, lower level of serum albumin, BMI, ABI, eGFR, and CLI were related to AD in Cox univariate analysis (Table 2(b), p<0.05). Revascularization, statin, or aspirin was related to AD. Higher urinary level of MA, age, CRP, D-dimer, lower level of serum albumin, eGFR, and CLI were also associated with AD, and statin reduced AD in multivariate analysis (p<0.05).
Table 2(b) Univariate and multivariate analyses for all-cause death.
| Univariate | Multivariate | |||||
|---|---|---|---|---|---|---|
| HR | 95%CI | p-value | HR | 95%CI | p-value | |
| Age (year) | 1.076 | 1.062–1.090 | <0.001 | 1.054 | 1.039–1.070 | <0.001 |
| Sex (male) | 1.226 | 0.943–1.701 | 0.117 | |||
| Body mass index (kg/m2) | 0.897 | 0.865–0.930 | <0.001 | 0.964 | 0.927–1.002 | 0.061 |
| Ankle–brachial pressure index | 0.340 | 0.226–0.512 | <0.001 | 0.709 | 0.432–1.162 | 0.173 |
| Critical limb ischemia | 2.533 | 1.901–3.375 | <0.001 | 1.517 | 1.049–2.193 | 0.027 |
| Urinary albumin (mg/gCr) | 1.001 | 1.000–1.001 | <0.001 | 1.001 | 1.000–1.001 | 0.045 |
| Serum albumin (g/dL) | 0.257 | 0.196–0.336 | <0.001 | 0.460 | 0.331–0.639 | <0.001 |
| eGFR (mL/min/1.73 m2) | 0.966 | 0.980–0.992 | <0.001 | 0.993 | 0.987–0.999 | 0.034 |
| C-reactive protein (mg/dL) | 1.175 | 1.113–1.241 | <0.001 | 1.064 | 1.080–1.255 | <0.001 |
| D-dimer (µg/dL) | 1.021 | 1.012–1.029 | <0.001 | 1.011 | 1.000–1.022 | 0.047 |
| Aspirin | 0.781 | 0.627–0.953 | 0.028 | 0.805 | 0.813–1.353 | 0.715 |
| Statin | 0.463 | 0.357–0.570 | <0.001 | 0.462 | 0.353–0.605 | <0.00 |
| Revascularization | 0.711 | 0.564–0.896 | 0.004 | 0.805 | 0.610–1.063 | 0.126 |
HR: hazard ratio; CI: confidence interval; eGFR: estimated glomerular filtration rate
Factors for MACE and CVLE
The 5, 10, and 15 year rates for freedom from MACE are shown in Fig. 2(a). Significant differences were found between A1 and A3 (p=0.009) and A2 and A3 categories (p=0.039), but there was no significant difference between A1 and A2 categories (p=0.141). Higher level of urinary MA, age, CRP, D-dimer, lower level of serum albumin, BMI, ABI, eGFR, CLI, diabetes, and CHD were related to MACE, and statin therapy was related to MACE significantly in Cox univariate analysis (Table 3(a), p<0.05). Higher level of urinary MA, age, CRP, lower level of serum albumin, ABI, diabetes, and CHD were related to MACE, and statin therapy was related to MACE in multivariate analysis (p<0.05).
Fig. 2 (a) Freedom from major adverse cardiovascular events (MACE) in A1, A2, or A3 category. There were significant differences in A1 versus (vs.) A3 (p=0.009) and A2 vs. A3 categories (p=0.039), but there was no significant difference in A1 vs. A2 categories (p=0.141). (b) Freedom from cardiovascular and/or limb events (CVLE: cardiovascular or cerebrovascular death, nonfatal myocardial or cerebral infarction, transient ischemic attack, major amputation, or repeat revascularization for a limb) in A1, A2, or A3 category. There were significant differences in A1 vs. A3 (p<0.001) and A2 vs. A3 categories (p=0.006), but there was no significant difference in A1 vs. A2 categories (p=0.126).

Table 3(a) Univariate and multivariate analyses for major adverse cardiovascular events.
| Univariate | Multivariate | |||||
|---|---|---|---|---|---|---|
| HR | 95%CI | p-value | HR | 95%CI | p-value | |
| Age (years) | 1.050 | 1.038–1.061 | <0.001 | 1.042 | 1.030–1.055 | <0.001 |
| Body mass index (kg/m2) | 0.945 | 0.916–0.976 | 0.001 | 0.992 | 0.958–1.027 | 0.663 |
| Ankle–brachial pressure index | 0.397 | 0.277–0.568 | <0.001 | 0.610 | 0.393–0.947 | 0.028 |
| Critical limb ischemia | 2.183 | 1.681–2.835 | <0.001 | 1.251 | 0.901–1.737 | 0.181 |
| Diabetes mellitus | 1.348 | 1.101–1.650 | 0.004 | 1.332 | 1.053–1.666 | 0.017 |
| Coronary heart disease | 1.731 | 1.421–2.108 | <0.001 | 2.152 | 1.724–2.686 | <0.001 |
| Urinary albumin (mg/gCr) | 1.001 | 1.000–1.001 | <0.001 | 1.000 | 1.000–1.001 | 0.033 |
| Serum albumin (g/dL) | 0.356 | 0.281–0.452 | <0.001 | 0.625 | 0.470–0.832 | 0.001 |
| eGFR (mL/min/1.73 m2) | 0.991 | 0.995–0.996 | 0.001 | 1.000 | 0.995–1.006 | 0.959 |
| C-reactive protein (mg/dL) | 1.133 | 1.073–1.195 | <0.001 | 1.113 | 1.037–1.194 | 0.003 |
| D-dimer (µg/dL) | 1.016 | 1.007–1.025 | <0.001 | 1.010 | 0.998–1.022 | 0.089 |
| Statin | 0.372 | 0.302–0.459 | <0.001 | 0.422 | 0.334–0.535 | <0.001 |
HR: hazard ratio; CI: confidence interval; eGFR: estimated glomerular filtration rate
The 5, 10, and 15 year rates for freedom from CVLE are shown in Fig. 2(b). There were significant differences between A1 and A3 (p<0.001) and A2 and A3 categories (p=0.006), but no significant difference was found between A1 and A2 categories (p=0.126). Higher level of urinary MA, age, CRP, lower level of serum albumin, ABI, eGFR, CLI, diabetes, cerebral infarction, and CHD were related to CVLE, and statin therapy was related to CVLE in Cox univariate analysis (Table 3(b), p<0.05). Higher urinary level of MA, age, lower ABI, cerebral infarction, and CHD were related to CVLE, and statin therapy was also related to CVLE in multivariate analysis (p<0.05). The higher urinary level of MA was a significant factor associated with CVLE in this analysis (p=0.007).
Table 3(b) Univariate and multivariate analyses for cardiovascular and/or limb events (CVLE: cardiovascular or cerebrovascular death, nonfatal myocardial or cerebral infarction, transient ischemic attack, major amputation, or repeat revascularization for a limb).
| Univariate | Multivariate | |||||
|---|---|---|---|---|---|---|
| HR | 95%CI | p-value | HR | 95%CI | p-value | |
| Age (years) | 1.019 | 1.005–1.032 | 0.007 | 1.016 | 1.001–1.031 | 0.039 |
| Ankle–brachial pressure index | 0.383 | 0.245–0.599 | <0.001 | 0.452 | 0.261–0.781 | 0.004 |
| Critical limb ischemia | 1.857 | 1.316–2.621 | <0.001 | 1.347 | 0.980–1.851 | 0.066 |
| Diabetes mellitus | 1.433 | 1.109–1.853 | 0.006 | 1.278 | 0.962–1.698 | 0.091 |
| Cerebral infarction | 1.632 | 1.187–2.242 | 0.003 | 1.450 | 1.016–2.069 | 0.041 |
| Coronary heart disease | 2.175 | 1.687–2.805 | <0.001 | 2.091 | 1.575–2.776 | <0.001 |
| Urinary albumin (mg/gCr) | 1.001 | 1.000–1.001 | <0.001 | 1.001 | 1.000–1.001 | 0.007 |
| Serum albumin (g/dL) | 0.498 | 0.365–0.679 | <0.001 | 0.797 | 0.555–1.143 | 0.217 |
| eGFR (mL/min/1.73 m2) | 0.990 | 0.983–0.997 | 0.003 | 1.000 | 0.993–1.008 | 0.918 |
| C-reactive protein (mg/dL) | 1.087 | 1.002–1.179 | 0.045 | 1.052 | 0.955–1.159 | 0.306 |
| Statin | 0.479 | 0.363–0.621 | <0.001 | 0.515 | 0.386–0.687 | <0.001 |
HR: hazard ratio; CI: confidence interval; eGFR: estimated glomerular filtration rate
Discussion
Our data represented the first clinical evidence for the relationship between microalbuminuria and long-term life expectancy or leg events in PAD patients. In this study, the prevalence of albuminuria categories (A2 or A3) was 39.2%, and the higher level of urinary MA was a predictive factor for CCVD and AD. In this study, CCVD was correlated with the higher urinary level of MA, age, CRP, lower level of serum albumin, eGFR, ABI, diabetes, cerebral infarction, and CHD. And AD was correlated with the higher urinary level of MA, age, CRP, D-dimer, lower level of serum albumin, eGFR, and CLI. Some studies have reported that CKD is a risk factor for CHD, valvular heart disease, and cerebrovascular disease,6,9,18) and cardiovascular death is markedly accelerated in patients on hemodialysis.6) Moreover, microalbuminuria is independently related to increased cardiovascular risks and morbidity.10) We have reported that urinary level of MA is related to low-density lipoprotein cholesterol, age, CHD, CLI, and diabetes in patients with PAD.8) Hence, CKD is classified on the basis of eGFR categories, and urinary levels of MA are added in CGA categories.12)
CLI and lower ABI are associated with a higher risk of cardiovascular events because of systemic or severe atherosclerosis.3,19) Cardiovascular and cerebrovascular diseases were major causes of AD. Moreover, malnutrition is a strong risk factor for AD.3,20) We have reported that the geriatric nutritional risk index is a meaningful predictor for AD, MACE, and major adverse cardiovascular and limb events in PAD patients.21) These results suggest that patients with lower serum albumin, lower ABI, or CLI have causes of higher mortality based on systemic severe atherosclerosis.
In this study, higher albuminuria was also an independent predictive factor for MACE and CVLE. Higher level of urinary MA, age, CRP, lower level of serum albumin, ABI, diabetes, and CHD were related to MACE, and higher urinary MA level, age, lower ABI, cerebral infarction, and CHD were related to CVLE. Microalbuminuria has been reported to be independently related to increased cardiovascular risk factors and MACE.10) Moreover, reduced eGFR and albuminuria are independent predictors of heart failure progression and mortality in patients with heart failure.11) We have reported that cerebral infarction, diabetes, and CKD are predictive risk factors for aggravation of stages of PAD.15,22) Sensory disturbance, decreased physical faculties, and systemic atherosclerosis may be related to the causes of these outcomes.1,22) Urinary MA levels are associated linearly with an increasing likelihood for the presence of PAD, even in the normal range of albuminuria in the Japanese general population.23) Systemic vascular atherosclerosis reflected by a higher level of urinary MA might be responsible for MACE and CVLE. In this study, a higher level of urinary MA was a significant risk factor associated with CVLE. Hence, higher urinary MA level was related to systemic vascular atherosclerosis including limb vessels in patients with PAD.
Statin therapy has an antiatherogenic effect on CHD and reduces MACE.24,25) Treatments with statins are efficient for improving AD and MACE in PAD patients with or without symptoms detected via the measurements of ABI.26) However, treatments with statins appear to be less effective in decreasing risks of CHD in patients with CKD and those on hemodialysis treatment.27,28) Additionally, statins are recommended for all patients with PAD in recent guidelines.29) Our findings also suggested that statins improve long-term CCVD and AD and decrease the risks of MACE and CVLE in patients with PAD.
The present study had some limitations: 1) the number of patients was relatively small; 2) this study was based on the data from a single institution; 3) a single morning urine sample was used to measure albumin and creatinine levels; 4) the prevalence of CLI was low as a result of the inclusion criteria in which patients on hemodialysis were excluded; and 5) the rate of statin therapy was relatively lower than in the recent guidelines, but the rate has risen over time. These limitations need further study with a larger patient cohort with PAD for CCVD, AD, MACE, and CVLE.
Conclusion
The urinary level of MA was a significant predictor for CCVD, AD, MACE, and CVLE in patients with PAD.
Disclosure Statement
All authors have no conflict of interest.
Author Contributions
Study conception: HK, SI
Data collection: KN, RF, YM, KS, AI
Analysis: HK, RF
Investigation: HK, RF, SI
Writing: KN, HK, TI
Funding acquisition: None
Critical review and revision: all authors
Final approval of the article: all authors
Accountability for all aspects of the work: all authors
References
- 1).Norgren L, Hiatt WR, Dormandy JA, et al. Inter-society consensus for the management of peripheral arterial disease (TASC II). J Vasc Surg 2007; 45 Suppl S: S5-67. [DOI] [PubMed]
- 2).Banerjee A, Fowkes FG, Rothwell PM. Associations between peripheral artery disease and ischemic stroke: implications for primary and secondary prevention. Stroke 2010; 41: 2102-7. [DOI] [PubMed] [Google Scholar]
- 3).Kumakura H, Kanai H, Aizaki M, et al. The influence of the obesity paradox and chronic kidney disease on long-term survival in a Japanese cohort with peripheral arterial disease. J Vasc Surg 2010; 52: 110-7. [DOI] [PubMed] [Google Scholar]
- 4).Murphy TP, Dhangana R, Pencina MJ, et al. Ankle–brachial index and cardiovascular risk prediction: an analysis of 11,594 individuals with 10-year follow-up. Atherosclerosis 2012; 220: 160-7. [DOI] [PubMed] [Google Scholar]
- 5).Kumakura H, Kanai H, Matsuo Y, et al. Asymptomatic cerebral infarction is a predictor of long-term survival and vascular or limb events in peripheral arterial disease. Eur Heart J Qual Care Clin Outcomes 2019; 5: 43-50. [DOI] [PubMed] [Google Scholar]
- 6).Sarnak MJ, Levey AS, Schoolwerth AC, et al. Kidney disease as a risk factor for development of cardiovascular disease: a statement from the American Heart Association Councils on Kidney in Cardiovascular Disease, High Blood Pressure Research, Clinical Cardiology, and Epidemiology and Prevention. Circulation 2003; 108: 2154-69. [DOI] [PubMed] [Google Scholar]
- 7).Maithel SK, Pomposelli FB, Williams M, et al. Creatinine clearance but not serum creatinine alone predicts long-term postoperative survival after lower extremity revascularization. Am J Nephrol 2006; 26: 612-20. [DOI] [PubMed] [Google Scholar]
- 8).Endo M, Kumakura H, Kanai H, et al. Prevalence and risk factors for renal artery stenosis and chronic kidney disease in Japanese patients with peripheral arterial disease. Hypertens Res 2010; 33: 911-5. [DOI] [PubMed] [Google Scholar]
- 9).Nakamura M, Yamashita T, Yajima J, et al. Impact of reduced renal function on prognosis in Japanese patients with coronary artery disease: a prospective cohort of Shinken Database 2007. Hypertens Res 2009; 32: 920-6. [DOI] [PubMed] [Google Scholar]
- 10).Hillege HL, Janssen WM, Bak AA, et al. Microalbuminuria is common, also in a nondiabetic, nonhypertensive population, and an independent indicator of cardiovascular risk factors and cardiovascular morbidity. J Intern Med 2001; 249: 519-26. [DOI] [PubMed] [Google Scholar]
- 11).Nayor M, Larson MG, Wang N, et al. The association of chronic kidney disease and microalbuminuria with heart failure with preserved vs. reduced ejection fraction. Eur J Heart Fail 2017; 19: 615-23. [DOI] [PMC free article] [PubMed] [Google Scholar]
- 12).Kidney Disease: Improving Global Outcomes Diabetes Work Group. KDIGO 2020 Clinical Practice Guideline for Diabetes Management in Chronic Kidney Disease. Kidney Int 2020; 98 Suppl: S1-115. [DOI] [PubMed] [Google Scholar]
- 13).Matsuo S, Imai E, Horio M, et al. Revised equations for estimated GFR from serum creatinine in Japan. Am J Kidney Dis 2009; 53: 982-92. [DOI] [PubMed] [Google Scholar]
- 14).Kumakura H, Kanai H, Araki Y, et al. 15-Year patency and life expectancy after primary stenting guided by intravascular ultrasound for iliac artery lesions in peripheral arterial disease. JACC Cardiovasc Interv 2015; 8: 1893-901. [DOI] [PubMed] [Google Scholar]
- 15).Kumakura H, Kanai H, Hojo Y, et al. Long-term survival and fate of the leg in de novo intermittent claudication. Eur Heart J Qual Care Clin Outcomes 2017; 3: 208-15. [DOI] [PubMed] [Google Scholar]
- 16).Thygesen K, Alpert JS, Jaffe AS, et al. Third universal definition of myocardial infarction. Circulation 2012; 126: 2020-35. [DOI] [PubMed] [Google Scholar]
- 17).Ranke C, Creutzig A, Alexander K. Duplex scanning of the peripheral arteries: correlation of the peak velocity ratio with angiographic diameter reduction. Ultrasound Med Biol 1992; 18: 433-40. [DOI] [PubMed] [Google Scholar]
- 18).Hojo Y, Kumakura H, Kanai H, et al. Lipoprotein(a) is a risk factor for aortic and mitral valvular stenosis in peripheral arterial disease. Eur Heart J Cardiovasc Imaging 2016; 17: 492-7. [DOI] [PubMed] [Google Scholar]
- 19).Mehler PS, Coll JR, Estacio R, et al. Intensive blood pressure control reduces the risk of cardiovascular events in patients with peripheral arterial disease and type 2 diabetes. Circulation 2003; 107: 753-6. [DOI] [PubMed] [Google Scholar]
- 20).Davenport DL, Xenos ES, Hosokawa P, et al. The influence of body mass index obesity status on vascular surgery 30-day morbidity and mortality. J Vasc Surg 2009; 49: 140-7. [DOI] [PubMed] [Google Scholar]
- 21).Matsuo Y, Kumakura H, Kanai H, et al. The geriatric nutritional risk index predicts long-term survival and cardiovascular or limb events in peripheral arterial disease. J Atheroscler Thromb 2020; 27: 134-43. [DOI] [PMC free article] [PubMed] [Google Scholar]
- 22).Kumakura H, Kanai H, Araki Y, et al. Sex-related differences in Japanese patients with peripheral arterial disease. Atherosclerosis 2011; 219: 846-50. [DOI] [PubMed] [Google Scholar]
- 23).Usui T, Ninomiya T, Nagata M, et al. Albuminuria as a risk factor for peripheral arterial disease in a general population: the Hisayama study. J Atheroscler Thromb 2011; 18: 705-12. [DOI] [PubMed] [Google Scholar]
- 24).Drozda JP Jr, Ferguson TB Jr, Jneid H, et al. 2015 ACC/AHA focused update of secondary prevention lipid performance measures: a report of the American College of Cardiology/American Heart Association Task Force on Performance Measures. Circ Cardiovasc Qual Outcomes 2016; 9: 68-95. [DOI] [PubMed] [Google Scholar]
- 25).Nicholls SJ, Hsu A, Wolski K, et al. Intravascular ultrasound-derived measures of coronary atherosclerotic plaque burden and clinical outcome. J Am Coll Cardiol 2010; 55: 2399-407. [DOI] [PubMed] [Google Scholar]
- 26).Antoniou GA, Fisher RK, Georgiadis GS, et al. Statin therapy in lower limb peripheral arterial disease: systematic review and meta-analysis. Vascul Pharmacol 2014; 63: 79-87. [DOI] [PubMed] [Google Scholar]
- 27).Wanner C, Krane V, Marz W, et al. Atorvastatin in patients with type 2 diabetes mellitus undergoing hemodialysis. N Engl J Med 2005; 353: 238-48. [DOI] [PubMed] [Google Scholar]
- 28).Silbernagel G, Fauler G, Genser B, et al. Intestinal cholesterol absorption, treatment with atorvastatin, and cardiovascular risk in hemodialysis patients. J Am Coll Cardiol 2015; 65: 2291-8. [DOI] [PubMed] [Google Scholar]
- 29).Aboyans V, Björck M, Brodmann M, et al. Questions and answers on diagnosis and management of patients with Peripheral Arterial Diseases: a companion document of the 2017 ESC Guidelines for the Diagnosis and Treatment of Peripheral Arterial Diseases, in collaboration with the European Society for Vascular Surgery (ESVS): endorsed by: the European Stroke Organisation (ESO) The Task Force for the Diagnosis and Treatment of Peripheral Arterial Diseases of the European Society of Cardiology (ESC) and of the European Society for Vascular Surgery (ESVS). Eur Heart J 2018; 39: e35-41. [DOI] [PubMed] [Google Scholar]