

Abstract
Introduction
This study aimed at generating a new simplified prognostic score (SPS) using common clinical and biological variables to discriminate a limited number of subgroups of patients with SCLC differing by their overall survival (OS).
Methods
The SPS was developed exploring the Montpellier University Hospital retrospective database of 401 patients over a 16-year period. All patients had received etoposide - platinum-based chemotherapy as first-line treatment. The SPS development took into account significant determinants of OS in the Cox model, weighted by their regression β coefficients. Validation of the consequent SPS has been done separately in a combined population of 213 patients accrued from two different published trials (NCT03059667 and NCT00930891).
Results
The significant independent determinants of OS included the following: (1) American Joint Committee on Cancer TNM stage IV (hazard ratio [HR]: 2.52; 95% confidence interval [CI]: 1.91–3.33); (2) Eastern Cooperative Oncology Group performance status greater than 1 (HR: 2.27; 95% CI: 1.79–2.87); (3) the presence of liver metastases (HR: 1.66; 95% CI: 1.29–2.15); and (4) neutrophil-to-lymphocyte ratio greater than 4 (HR: 1.39; 95% CI: 1.11–1.92). The SPS generated with these four variables, segregated three groups (good, intermediate, and poor prognosis) with respective median OS of 26.9 months (95% CI: 20.1–38.9), 11.5 months (95% CI: 9.8–13.0), and 6.8 months (95% CI: 5.8–8.3; log-rank p < 10–4). Harrell's C statistic estimate was 0.68 ± 0.012, suggesting goodness of calibration. In the validation cohort, the SPS segregated the aforementioned three subgroups in a nearly similar manner, with respective median OS: 27.2, 12.3, and 8.6 months (log-rank p < 10–3; Harrell’s C statistic: 0.58 ± 0.02).
Conclusions
The SPS is easy to calculate in real-life practice and efficiently discriminates three populations with different prognoses. This study deserves further validation of this score in patients with SCLC receiving immunochemotherapy.
Keywords: Small cell lung cancer, Prognosis, Prognostic score, Chemotherapy, Serum markers
Introduction
SCLC is a recalcitrant disease with few therapeutic advances during the past three decades. In the past, several attempts at improving the outcome of patients with SCLC failed to exhibit an unquestionable progress. Chemotherapy intensification offers a weak survival advantage that is jeopardized by an increase in treatment-related morbidity.1 Anti-angiogenic therapies such as thalidomide,2 bevacizumab,3 or sunitinib4 have been tested in several phase II or III studies, but the clinical benefit seemed weak, if any. Several targeted therapies are evaluated in the setting of SCLC. For example, rovalpituzumab–tesirine targets deltalike ligand-3, an inverse agonist of the Notch pathway, but its development has been stopped because of safety concern.5 The cases for anti-poly(ADP-ribose) polymerase,6 anti-enhancer of zeste homolog 2,7 and anti-Aurora A8 therapies are still unclear as long as they are in early development. Until recently, international guidelines recommend cisplatin (or carboplatin)–etoposide as the backbone of SCLC therapy with the addition of thoracic radiotherapy concomitantly delivered, for patients with limited-disease stage.9 An important step forward in SCLC therapy was the recent introduction of immunochemotherapy as first-line treatment for extensive-disease SCLC; this strategy was rapidly implemented in SCLC treatment guidelines after the publication of two randomized phase III studies comparing etoposide - platinum with or without anti–programmed death-ligand 1 immune checkpoint inhibitors.10,11
Although SCLC qualifies as a recalcitrant disease, prognosis of SCLC is not uniformly poor, and some clinical variables such as the performance status (PS) and the disease stage are paramount prognostic determinants and key eligibility criteria in clinical trials.12,13
In an attempt to characterize patient subgroups with distinct prognoses, several scores have been proposed. Unfortunately, some simple scores such as the Manchester score14 are not used any longer because the guidelines of staging and care have been totally modified since the time of their development a long time ago. More recently, Wang et al.,15 exploring a cohort of 24,680 patients with SCLC extracted from the National Cancer Database, have established a prognostic nomogram on the basis of the following pretreatment variables: age, sex, ethnicity, Charlson-Deyo comorbidity index,16 disease stage according to the eighth TNM, thoracic involvement laterality (unilateral, versus bilateral, versus median), and the type of treatment received. The strength of this study consisted of the large cohort in which the score was generated and validated. However, the PS was not an explored criterion probably because this variable was not systematically registered in the database. Another possible bias consisted of the introduction of the treatment as a prognostic variable, whereas treatment decision depends on the other prognostic variables.
This study aimed at generating and validating a new score designed such as simplified prognostic score (SPS) using common clinical variables to discriminate a limited number of subgroups differing by their overall survival (OS) and to help clinicians in determining pretherapeutic risk factors.
Materials and Methods
Patients’ Selection
Development and external validation of the score were conducted in two different cohorts.
Development Cohort
This is a retrospective study conducted at the Montpellier University Hospital. The selected patients had a proven histologic or cytologic diagnosis of SCLC, whatever the stage, and had received at least one course of chemotherapy on the basis of etoposide - platinum (cisplatin or carboplatin) as first-line treatment between January 1, 2002, and December 31, 2018. The collection start date was the date of computerization of chemotherapy prescriptions at the centralized pharmacy of the Montpellier University Hospital. Patients who did not receive a platinum compound or did not receive etoposide, and patients admitted for second-line treatment or further were excluded. All data were directly extracted from the Montpellier University centralized computing system, saving patients’ medical records (DxCare, Medasys, Gif sur Yvette, France).
In this development cohort, all patients had the following pretreatment work-up: clinical examination, chest x-ray, computed tomography scan of the thorax and abdomen, brain imaging by magnetic resonance imaging or scanner, and bone scanner. The latter test was replaced by fluorodeoxyglucose-positron emission tomography from 2005 onward for more precise staging. Recorded variables were age, sex, smoking habits, PS according to the Eastern Cooperative Oncology Group (ECOG) at diagnosis, body mass index, and Charlson-Deyo comorbidity index.16 The eighth American Joint Committee on Cancer TNM staging13 was rebuilt, taking into account the separate T status, nodal status, and number and distribution of metastases. The pretherapeutic biological assessment included cell blood counts; renal function (creatinine clearance estimated with the modification of diet in renal disease equation); liver tests, including alanine aminotransferase, aspartate aminotransferase, bilirubin, gamma-glutamyl transferase, alkaline phosphatases, lactate dehydrogenase, prothrombin, and serum albumin; bicarbonates; C-reactive protein (CRP); calcemia–phosphoremia; serum sodium; and neuron-specific enolase. The neutrophils-to-lymphocytes ratio (NLR) was calculated and a value less than 4 was considered as normal. Glasgow prognostic score (GPS)17 was calculated for 245 patients for whom both serum albumin and CRP were available. All patients received treatment according to international guidelines. The following variables belonging to therapeutic options were recorded: modality of first-line chemotherapy, thoracic radiotherapy (received or not), number of lines of systemic therapy received. The prophylactic cranial irradiation (PCI) variable was not recorded, because unlike the aforementioned variables that are planned at diagnosis, the PCI cannot be decided before the end of the entire initial treatment program in as much as it is recommended only for patients with a complete response. Consequently, PCI was delivered to patients with, by essence, a good prognosis. In addition, timing of PCI at the end of the induction program gives patients who have received it a guarantee of time (immortality bias). The Montpellier academic hospital institutional review board (IRB) approved this retrospective single center study (IRB No. 2019_IRB-MTP_11-14). An information letter was prepared and approved by the IRB, but patient’s signature was not required.
Validation Cohort
Validation of the score was conducted by a different statistician working on the combined populations of two different SCLC randomized trial conducted by the French Thoracic Oncologic Intergroup (IFCT). The NCT00930891 trial was a randomized phase II to III study of bevacizumab in combination with chemotherapy in previously untreated SCLC.18 A total of 147 patients were accrued by 49 French institutions in this trial. The NCT03059667 trial was a randomized noncomparative phase II study evaluating atezolizumab, an anti–programmed death-ligand 1 checkpoint protein inhibitor, in patients with relapse SCLC.19 A total of 73 patients were accrued by 24 French institutions in this trial. All variables needed were available in the database to retest the SPS capability to discriminate prognostic groups. Authorizations to explore prognosis of these populations for validation purpose were formally delivered by the scientific board and the administrative board of the IFCT after study design submission. The information letters of the original studies indicated that data collected might be used in the future to perform ancillary studies, pending on signature of the informed consent.
End Points
The score was developed to predict OS defined as the time from histologic diagnosis to the date of death owing to any cause. The secondary end point was the performance of the score in prognostication of progression-free survival (PFS) defined as the time elapsed from histologic diagnosis to either Response Evaluation Criteria in Solid Tumors 1.1 disease progression or death from any cause, whichever occurred first.
Statistics
Survival Analyses
Survival analyses were processed as follows: the cutoff date for the entire population of this study was defined as the latest date for which we have an informative point (death or censorship). In the development cohort, for patients who were lost to follow-up before the cutoff date (April 1, 2019) and who were known to have experienced a tumor progression informative censorship), a penalizing survival analysis was applied so that, the OS was defined as the time from the date of diagnosis to date of previous contact. The cutoff date in the validation cohort was defined as the cutoff date of the respective trials.
The nonparametric Kaplan-Meier estimates were used to calculate probabilities and plot survival curves. Survival distributions of groups defined by the different states of covariates, were compared using the log-rank test. Covariates related to the occurrence of the survival event with a p less than 0.15 were included in a multivariate Cox hazard proportional model. The proportional hazard assumption was tested graphically (function LOG [–LOG (S (t))]) and, where needed, by a time-dependent Cox model. Where covariates did not meet the proportional hazard assumption, a stratified Cox model was applied. Stepwise, backward and forward variable selections were tested. The variables with an alpha risk less than or equal to 5% were selected in the final model. Subgroup analyses were performed in stage IV and in non–stage IV separately and in subgroups according to the year of diagnosis. To verify that there were no period effects, the population was divided into four equal 4-year periods and the survival of each subgroup thus defined was analyzed.
Variable Weighting and Elaboration of the SPS
The significant variables in the Cox model were incorporated into the SPS. Each variable was assigned to a weight proportional to its regression β coefficient. However, a weighting approximation was applied (weight of the variable round up to the nearest 0.5 value). Therefore, the score which is the sum of the values of each significant variable that made up the SPS, could be done by head calculation. As a result of this process, the SPS ranged from 0 (best prognosis) to 3 (worst prognosis). The score was then tested in the development cohort database and the survival curve of the subgroup of patients defined by a given SPS value was compared with the survival of patients with SPS equal to 0. Individual SPS scores were grouped as clusters of subgroups of score values having similar OS, to generate a three-modality score (poor, intermediate, and good prognosis). Harrell's C test was used to assess the goodness of calibration of the model.
Score Validation
The Manchester score was calculated for each patient using the values of the following variables: lactate dehydrogenase, tumor stage, serum sodium, pretreatment Karnofsky performance score (after conversion of the ECOG PS), alkaline phosphatases, and serum bicarbonate.14 As recommended by Manchester score publication, each variable was weighted as one point and the sum was then assigned to one of the three groups: good, intermediate, or poor prognosis. Interrater reliability of SPS and Manchester score was tested by Cohen’s kappa test.
Finally, the performance of the SPS as a prognostic determinant of the OS was tested in the validation cohort. The nonparametric Kaplan-Meier estimates were used to calculate probabilities of survival and plot survival curves. Harrell’s C test was used to assess the goodness of calibration.
Results
Description of the Development Cohort
A total of 494 patients having received an etoposide - platinum-based chemotherapy at our institution were screened for eligibility. Among them, 93 were found ineligible, mainly for histology other than SCLC. For the seven patients (1.7%) who were lost to follow-up, a penalizing survival analysis was applied. The final development cohort encompassed 401 patients, 286 men, with a median age of 64.4 years (range: 27.1–87.8). Median [interquartile] follow-up was 11.6 months [7.0–21.8]. Median PFS and OS in the whole population were 7.7 months (95% confidence interval [CI]: 7.2–8.1) and 12.5 months (95% CI: 10.9–14.0), respectively. Two-thirds of the patients presented with an ECOG PS of 0 or 1 (n = 266, 66.3%). Almost all of the patients were active or former smokers. The stage was metastatic at diagnosis for 264 patients (65.8%), of whom 121 (30.2% of the entire cohort) had liver metastases and most stage IV patients had a multiple organ metastatic status. Histologic diagnosis was mixed SCLC with a minor non-SCLC component in 21 cases (5.2%), most of which was a large cell neuroendocrine cancer component (n = 11) or a squamous cell carcinoma component (n = 6).
All patients received an etoposide - platinum-based regimen as first-line chemotherapy, of whom 123 (30.7%) received carboplatin-etoposide doublet, 167 (41.6%) received cisplatin and etoposide doublet, and 111 (27.7%) received a four-drug regimen consisting of cisplatin–etoposide–4' epidoxorubin and cyclophosphamide. A total of 119 patients (29.7%) received chest radiotherapy and 168 patients (41.9%) received prophylactic brain irradiation. Roughly, one-half of the patients received a second-line therapy consisting of either etoposide - platinum re-induction chemotherapy or single-drug topotecan. A total of 17 patients (4.2%) underwent surgical resection at curative intent owing to very limited stage and response to induction chemotherapy.
Univariate Analyses
All variables known as prognostic determinants in the literature were also related to the OS in the development cohort (Table 1). In univariate analyses, an age of 70 years or less, a nonmetastatic stage, a PS of 0 to 1, no liver metastases, and unilateral chest disease, were all patient demographic or disease characteristics associated with a longer PFS and OS when compared with the opposite features of each variable. Among the variables belonging to treatment plan, cisplatin–etoposide–4' epidoxorubin and cyclophosphamide chemotherapy (versus doublet chemotherapy), chest radiotherapy, prophylactic cerebral irradiation, and surgery were associated with a longer PFS and OS. Mixed histology did not significantly differ from SCLC in terms of prognosis as a result of the limited number of patients in this subgroup. As previously published by several groups (including ours), many biological variables were related to the OS in univariate analysis, namely, neuron-specific enolase, serum sodium, alkaline phosphatase, NLR, serum albumin, CRP, lactate dehydrogenase, GPS. The only variable previously published as a prognostic factor14 and not reaching statistical significance was bicarbonates level.
Table 1.
Univariate Analysis of Overall Survival Determinants in the Development Cohort
| Variable | n | Median | 95% CI | Log-rank |
|---|---|---|---|---|
| Age | ||||
| <70 y | 284 | 13.2 | 11.6–15.6 | 0.02 |
| ≥70 y | 117 | 10.9 | 8.8–11.7 | |
| Sex | ||||
| Male | 286 | 12.5 | 10.1–14.5 | 0.81 |
| Female | 115 | 12.3 | 10.8–14.2 | |
| ECOG performance status | ||||
| 0–1 | 266 | 16.0 | 14.1–18.1 | <10–4 |
| ≥2 | 135 | 7.9 | 6.7–9.3 | |
| Disease stage | ||||
| Nonmetastatic | 137 | 24.1 | 19.0–30.1 | <10–4 |
| IV | 264 | 9.2 | 8.4–10.1 | |
| Mixed histology | ||||
| No | 280 | 11.8 | 10.8–13.9 | 0.58 |
| Yes | 21 | 16.7 | 6.8–25.4 | |
| Charlson-Deyo score | ||||
| 0–1 | 234 | 13.2 | 11.2–15.2 | 0.20 |
| ≥ 2 | 162 | 11.1 | 9.3–12.9 | |
| Laterality | ||||
| Bilateral | 146 | 10.1 | 8.8–11.8 | < 0.01 |
| Median | 28 | 11.4 | 6.7–20.5 | |
| Unilateral | 225 | 14.4 | 11.8–17.1 | |
| BMI | ||||
| Underweight | 29 | 7.8 | 6.3–14.5 | 0.43 |
| Normal weight | 188 | 11.7 | 10.1–14.8 | |
| Overweight | 124 | 13.9 | 10.8–16.3 | |
| Obese | 46 | 14.1 | 9.2–17.8 | |
| Liver metastases | ||||
| No | 280 | 16.1 | 14.1–17.9 | 10–4 |
| Yes | 121 | 8.0 | 7.1–8.8 | |
| Neutrophils-to-lymphocytes ratio | ||||
| <4 | 202 | 15.6 | 12.8–18.3 | <10–4 |
| ≥4 | 194 | 10.1 | 9.2–11.8 | |
| Alkaline phosphatases (UI/L) | ||||
| 312 | 14.4 | 12.5–16.3 | <10–4 | |
| ≥130 | 82 | 7.9 | 6.6–9.3 | |
| Lactate dehydrogenase (UI/L) | ||||
| <220 | 76 | 17.7 | 13.5–22.0 | <0.01 |
| ≥220 | 303 | 11.6 | 10.0–13.0 | |
| Neuron-specific enolase (ng/mL) | ||||
| <12.5 | 26 | 24.9 | 14.1–49.3 | <0.01 |
| ≥12.5 | 335 | 11.7 | 10.3–13.5 | |
| Serum sodium (mmol/L) | ||||
| <135 | 93 | 9.5 | 7.7–11.6 | 0.01 |
| ≥135 | 303 | 13.5 | 11.6–15.7 | |
| Bicarbonates (mmol/L) | ||||
| <20 | 21 | 14.2 | 7.8–28.6 | 0.24 |
| ≥20 | 373 | 12.3 | 10.8–13.9 | |
| Albumin (g/L) | ||||
| ≥35 | 338 | 13.8 | 11.8–15.6 | <10–4 |
| <35 | 55 | 8.0 | 6.8–9.9 | |
| C-reactive protein (mg/L) | ||||
| ≤10 | 116 | 14.7 | 11.6–17.6 | <10–4 |
| >10 | 131 | 8.8 | 8.0–10.5 | |
| Glasgow prognostic score | ||||
| 0 | 112 | 15.9 | 11.8–17.7 | <10–4 |
| 1 | 97 | 10.5 | 8.6–13.5 | |
| 2 | 36 | 7.3 | 5.8–8.4 | |
| First-line chemotherapy | ||||
| PCDE | 111 | 17.4 | 14.4–23.0 | <10–4 |
| etoposide - platinum | 290 | 10.9 | 9.6–12.3 | |
| Thoracic radiotherapy | ||||
| Yes | 119 | 23.4 | 18.9–28.6 | <10–4 |
| No | 282 | 9.3 | 8.4–10.4 | |
| Surgery | ||||
| Yes | 17 | 49.3 | 16.4–NR | <10–3 |
| No | 384 | 11.7 | 10.3–13.2 | |
| Prophylactic cranial irradiation | ||||
| Yes | 168 | 20.4 | 17.8–25.0 | <10–4 |
| No | 232 | 8.4 | 7.5–9.6 | |
| Period of inclusion | ||||
| 2000–2004 | 73 | 14.5 | 11.2–17.4 | 0.13 |
| 2005–2009 | 93 | 13.8 | 10.0–17.8 | |
| 2010–2014 | 130 | 11.5 | 9.6–13.5 | |
| 2015–2019 | 105 | 10.8 | 8.4–13.9 |
PCDE, cisplatin–etoposide–4' epidoxorubin and cyclophosphamide; BMI, body mass index; NR, not reached; ECOG, Eastern Cooperative Oncology Group; CI, confidence interval.
A survival analysis was also carried out according to the year of diagnosis, given the extent of our accrual period (16 y) by separating four subgroups of 4 years each. OS did not significantly differ among the four subgroups.
Multivariate Analysis
All covariates related to the occurrence of the survival event with p < 0.15 and that fit the proportional hazard assumption were tested in the multivariate hazard proportional model with the exception of GPS and CRP owing to the high rate of missing data (38%). In the Cox model, a PS of 0 to 1, no liver metastases, an otherwise nonmetastatic stage and, an NLR less than 4 were independent determinants of a longer OS. Hazard ratio (HR) and β coefficients are summarized in Table 2. Harrell’s C test was 0.71 ± 0.01.
Table 2.
Cox Proportional Hazard Model of Overall Survival in the Development Cohort
| Variable | β Coefficient | HR | 95% CI | p Values |
|---|---|---|---|---|
| ECOG performance status: ≥2 vs. 0–1 | 0.82 | 2.27 | 1.79–2.87 | <10–4 |
| Disease stage: IV vs. non-IV | 0.92 | 2.52 | 1.91–3.33 | <10–4 |
| Liver metastases: Yes vs. no | 0.51 | 1.66 | 1.29–2.15 | <0.01 |
| NLR: ≥4 vs. <4 | 0.33 | 1.39 | 1.11–1.72 | <10–4 |
HR, hazard ratio; NLR, neutrophils-to-lymphocytes ratio; ECOG, Eastern Cooperative Oncology Group; CI, confidence interval.
Subgroup Analyses by Disease Stage
PS and NLR were also independent prognostic determinants of the OS in subgroup analysis by stage. HR for a PS greater than 1 was slightly higher in the metastatic stage 2.39 (95% CI: 1.81–3.13) than in the entire cohort and slightly lower in the nonmetastatic stage 1.76 (95% CI: 1.05–2.94). HRs for NLR were nearly similar in the two subgroups (1.35 and 1.61 in the metastatic and the nonmetastatic subgroups, respectively). Presence of liver metastases remained a significant determinant of shorter OS in the subpopulation of patients with an otherwise metastatic disease with an HR of 1.65 (95% CI: 1.27–2.13).
Score Development
As a result of the multivariate analysis, the four independent determinants of OS were included in the primary score with an assigned weight proportionally approaching their β coefficients (Table 2). Thus an ECOG PS greater than 1 or a metastatic disease stage, were separately assigned as a value of 1 into the primary score, whereas liver metastases or an NLR greater than or equal to 4 were separately assigned as a value of 0.5 in the primary score. This scoring approximation allows a head calculation of the score. The patient’s primary score was the sum of these values and could therefore take one of the seven score values ranging from 0 to 3 by half-point interval.
Median OS Kaplan-Meier estimates of each of the subgroups as defined by each primary score value were 37.5 months (95% CI: 23.1–52.9), 20.1 months (95% CI: 16.0–25.5), 17.6 months (95% CI: 13.0–21.2), 11.3 months (95% CI: 8.6–13.8), 8.8 months (95% CI: 7.8–10.1), 7.3 months (95% CI: 6.2–9.3), and 5.7 months (95% CI: 3.2–7.1) from score equal to 0 to 3 by half-point interval (Fig. 1). OS of each primary score subgroup ranging from 0.5 to 3 significantly differed from score equal to 0 taken as the baseline hazard (log-rank test: p < 104 each comparison) except for patients assigned to score equal to 0 and score equal to 0.5 for whom the OS did not significantly differ (log-rank test: p = 0.07; Table 3). Harrell’s C test was estimated at 0.71 ± 0.01, a value close to the one observed in the main model.
Figure 1.
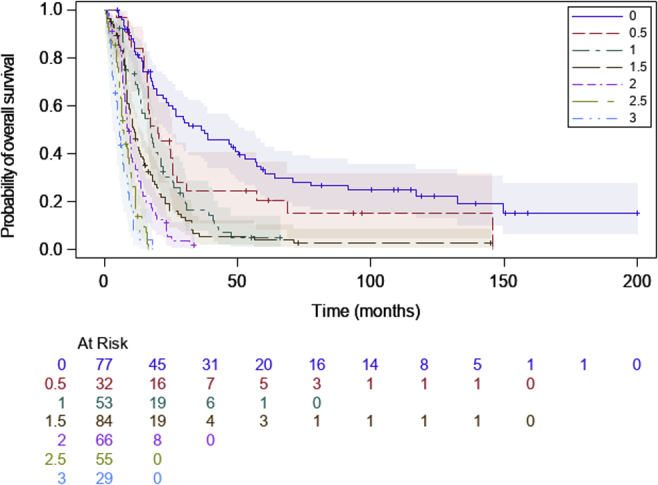
Kaplan-Meier estimate of overall survival according to patients’ subgroups defined by the primary score in the development cohort (log-rank: p < 0.01)
Table 3.
Maximum Likelihood Estimation of Overall Survival According to Primary Score Distribution in the Development Cohort
| Primary Score | β Coefficient | Hazard Ratio | 95% CI | p Values |
|---|---|---|---|---|
| 0 | — | 1 | — | — |
| 0.5 | 0.43 | 1.53 | 0.96–2.46 | 0.07 |
| 1 | 0.88 | 2.41 | 1.61–3.62 | <10–4 |
| 1.5 | 1.21 | 3.36 | 2.34–4.83 | <10–4 |
| 2 | 1.67 | 5.31 | 3.58–7.88 | <10–4 |
| 2.5 | 2.22 | 9.22 | 6.01–14.13 | <10–4 |
| 3 | 2.61 | 13.65 | 8.26–22.56 | <10–4 |
CI, confidence interval.
To allow a convenient clinical use of the score, the primary score was simplified into a three-modality score, namely the SPS. To do so, subgroups of the primary score with a close OS curve profile were gathered in three modalities in a way that allowed maintaining the Harrell’s C score close to the 0.71 value. This process resulted in the SPS, described as follows: good prognostic group (group I): 0 or 0.5; intermediate prognostic (group II): 1, 1.5, or 2; and poor prognostic group (group III): 2.5 or 3. The median OS and 1-year OS rates were 26.9 months (95% CI: 20.1–38.9) and 82%; 11.5 months (95% CI: 9.8–13) and 48%; and 6.8 months (95% CI: 5.8–8.3) and 13% for groups I, II, and III, respectively. HR for group I was 1 and HR for group II was 2.96 (95% CI: 2.24–3.92) versus 8.58 for group III (95% CI: 6.00–12.25; log-rank test: p < 10–4 each comparison; Fig. 2A; Table 4). Harrell's C test was 0.68 ± 0.01. The proportional hazard assumption was tested and certified.
Figure 2.

Kaplan-Meier estimate of overall survival according to patients’ subgroups defined by the simplified prognostic score in the development cohort: group I: good prognosis (score 0 or 0.5); group II: intermediate prognosis (scores 1, 1.5, or 2); group III: poor prognosis (score 2.5 or 3). (A) Development cohort (log-rank: p < 0.01); (B) validation cohort (log-rank: p < 10-4).
Table 4.
Maximum Likelihood Estimation of Overall Survival According to Simplified Prognostic Score Distribution in the Development Cohort
| SPS | β Coefficient | Hazard Ratio | 95% CI | p Values |
|---|---|---|---|---|
| Group I | — | 1 | — | — |
| Group II | 1.09 | 2.96 | 2.24–3.92 | <10–4 |
| Group III | 2.15 | 8.58 | 6.00–12.25 | <10–4 |
CI, confidence interval; SPS, simplified prognostic score.
Group I: good prognosis (score 0 or 0.5); group II: intermediate prognosis (scores 1, 1.5, or 2); group III: poor prognosis (2.5 or 3).
The median PFS and 1-year PFS rate were 16.6 months (95% CI: 11.5–18.9) and 58%; 7.3 months (95% CI: 6.8–7.9) and 15%; and 5.4 months (95% CI: 4.6–6.0) and 1% for groups I, II, and III, respectively. HR was 1 for group I and 3.02 for group II (95% CI: 2.31–3.96) versus 6.73 for group III (95% CI: 4.80–9.45; log-rank test: p < 104 each comparison; Fig. 3). Harrell's C test was 0.67 ± 0.01. The proportional hazard assumption was tested and certified.
Figure 3.

Kaplan-Meier estimate of progression-free survival according to patients’ subgroups defined by the simplified prognostic score in the development cohort: group I: good prognosis (score 0 or 0.5); group II: intermediate prognosis (scores 1, 1.5, or 2); group III: poor prognosis (score 2.5 or 3).
Comparison of the SPS With the Manchester Score
According to the Manchester score assignment, median OS and the 1-year OS rates were 18.1 months (95% CI: 16.6–22) and 72%; 9 months (95% CI: 7.7–10.1) and 33%; and 6.8 months (95% CI: 5.8–8.9) and 15% for good prognosis, intermediate, and poor prognostic groups, respectively. The function LOG (–LOG [S (t)]) revealed a lack of proportional hazard assumption. Kappa coefficient was 0.3403 ± 0.038, demonstrating a weak agreement between the two scores.
External Validation in the IFCT Cohort
The populations of the two IFCT studies have been exhaustively described in their respective trial reports.18,19 A total of 213 patients comprised the validation cohort after exclusion of five patients from the 0802 study and two from the 1603 study owing to missing data. OS of each primary score subgroup ranging from 0.5 to 3 significantly differed from the score of 0 taken as the baseline hazard (log-rank test: p < 104 each comparison; Table 5). After grouping in the three-modality SPS, the median OS and 1-year OS rate were 27.2 months (95% CI: 18.2–31.6) and 92%; 12.3 months (95% CI: 10.8–14.1) and 52%; and 8.6 months (95% CI: 5.7–14.9) and 36% for groups I, II, and III, respectively. Group I HR was 1 and group II HR was 3.81 (95% CI: 1.78–8.15) versus group III HR of 8.11 (95% CI: 3.41–19.30; log-rank test: p < 10–3 each comparison; Fig. 2B). Harrell's C test was 0.58 ± 0.02.
Table 5.
Maximum Likelihood Estimation of Overall Survival According to Primary Score Distribution in the Validation Cohort
| Primary Score | Hazard Ratio | 95% CI | p Values |
|---|---|---|---|
| 0 | 1 | — | — |
| 0.5 | 6.54 | 1.46–29.37 | 0.01 |
| 1 | 5.02 | 1.56–16.19 | <0.01 |
| 1.5 | 9.28 | 2.92–29.47 | <10–3 |
| 2 | 9.72 | 2.94–32.09 | <10–3 |
| 2.5 | 13.76 | 3.94–48.02 | <10–4 |
| 3 | 28.36 | 7.01–114.79 | <10–4 |
CI, confidence interval.
Discussion
In this study, the survival analyses of a retrospective database of patients with SCLC having received etoposide - platinum-based first-line chemotherapy, allowed the generation of a prognostic score, the SPS, easy to use at the patient's bedside. This score encompasses four pretherapeutic variables, the stage (IV versus non-IV), the presence of liver metastases, the ECOG PS, and the NLR ratio (≥4 versus <4). The SPS discriminates three groups that statistically differ by their OS and PFS with minimal loss of prognostic information when compared with the detailed model as shown by the value of Harrell's C estimate. External validation in databases consisting of patients accrued in controlled, randomized multicenter trials exhibited a good reliability of the SPS.
The four variables in the SPS are well-known and routinely tested prognostic factors in the SCLC. ECOG PS is a prognostic factor in a wide panel of human malignancies, including SCLC and, in the setting of randomized clinical trials, it is a major criterion for patients' eligibility and for stratification. PS is a variable included in several SCLC prognostic scores such as the prognostic score by Maestu et al.20 and more recently, for extended-disease SCLC, the score by Xie et al.21 Manchester score14 considers the Karnofsky index in the score calculation as the means to evaluate the general condition of the patient. There is, however, an accepted correspondence between the Karnofsky index and the ECOG PS that allowed us to test the Manchester score in the development cohort of this study. The graphical comparison of the survival curves of groups I, II, and III as defined either by the Manchester score or by the SPS favored the latter score in as much as the distinction between groups seems more pronounced with the SPS three-modality assignment. Although easily tested, the PS cannot be defined retrospectively if not recorded at the time of diagnosis. One can hypothesize that the absence of PS as a prognostic variable in SCLC prognostic scores recently developed from large cohorts is due not to a lower impact of PS in recently treated patients but is related to the lack of recording of this variable. This nonreporting of the PS might be considered a weakness of these studies, which is not completely compensated by the large size of the cohort and the good representativeness of cancer care center diversity.15
The eighth American Joint Committee on Cancer TNM classification of lung cancer is becoming the standard staging method for SCLC. During the first years of the accrual period of the development cohort, this staging was not in use, but the Veterans Administration lung cancer study group two-stage classification was applied. Therefore, for the purpose of this study, the staging has been rebuilt from the specific staging of each of the TNM components. This procedure did not allow a complete accuracy of the staging. The low proportion of early-stage patients in our cohort precluded a subgroup analysis. Therefore, the dichotomization as chosen for the TNM staging in the SPS is almost similar to the former Veterans Administration lung cancer study group’s limited versus extended-disease binary staging. One can argue that the work-up process to establish staging has changed during the accrual period with the implementation of brain magnetic resonance imaging and positron emission tomography,22 leading to, for some patients with low metastatic burden, the migration from the nonmetastatic stage to stage IV. However, the OS did not significantly differ when different periods of time were compared. Therefore, as in many other SCLC prognostic scores, the dichotomy of nonmetastatic stage and stage IV is a prognostic determinant in the SPS, beyond its paramount role in treatment decision making. The absence of period effect over the 16 years of the study also probably reflects the lack of any marked improvement in the treatment of this disease.
The integration of liver metastases to SPS is, to the best of our knowledge, a new variable not already used in previous scores, although its detrimental effect on OS has been recognized by many authors.23,24 It is noteworthy that liver metastases carry over a more unfavorable prognosis than brain or bone metastases in SCLC. In this study, liver metastases remained a significant determinant of OS even in the subgroup of stage IV patients. Recently, this variable was recognized as predicting resistance to immunotherapy in NSCLC during therapies targeting the programmed cell death-1 – programmed cell death-ligand1 pathway.25 This deserves the SPS evaluation in the emerging setting of SCLC immunotherapy insofar as SPS takes into account the presence or absence of liver metastases at the time of diagnosis.
A property of the development cohort of our study is the almost exhaustive exploration of putative biological variables (except recently described gene profiling of SCLC). Among the numerous variables significantly related to the OS in the univariate analyses, NLR was the sole variable retained as an independent determinant of prognosis, as was the case for the recently described prognostic score for extended-disease by Xie et al.21 There is a preclinical rationale for the prognostic significance of NLR: it partly reflects the inflammatory response associated with an unfavorable prognosis in solid tumors. Neutrophils are recruited and activated by chemokines released by tumor cells. Activated neutrophils differ from native neutrophils in their tumor promotion effects such as anti-apoptosis, angiogenesis, tumor growth, metastatic invasion phenotype, and suppression of adaptive immune response.26 Therefore, one can consider that NLR is a convenient biological variable in evaluating the inflammatory status of the tumor-host interaction.
A clinical advantage of the SPS is the limited number of required variables. These prognostic determinants are always tested at the time of pretherapeutic workup, whatever the setting (real-life practice or controlled studies). As a difference with several other scores, therapeutic variables such as thoracic radiotherapy or PCI were voluntarily excluded from the score development process. We consider that treatment decision making and planning of therapy are routinely defined patient-by-patient by considering the key variables such as PS or disease stage, and consequently, therapeutic sequences are surrogate variables of the latter key variables, potentially leading to an immortality bias in survival analyses.
Our study has limitations. The monocentric nature of the development cohort and the relatively small number of patients might be addressed. One can consider that subgroup of the nonmetastatic stages or subgroups by GPS would have been better explored in a larger database. Moreover, the monocentric nature might be regarded as a weakness of the development cohort, as the results might be too specific to our center. Our choice to generate the score in this database was justified by the exhaustive analysis of known biological variables (except genotypic profiling that we plan to incorporate in a second time). In addition, there is a clear need to test either ECOG PS or Karnofsky score when generating a score in consideration of its weight in all prognostic studies that have tested the PS as a prognostic determinant. The validation cohort is by nature prospective, insofar as patients were prospectively accrued in two registered and published studies. This confers the strength of a multicenter appraisal of the SPS. Although some overestimation of the OS might have occurred in the validation cohort owing to the fact that the random allocation in the study IFCT 0802 occurred only at the third chemotherapy cycle, there is a congruence of the SPS three-modality classification: the OS curves of each group of the three-modality SPS, either in the development or in the validation cohort, were almost identical, and the Harrell’s C test suggested a limited loss of prognostic information with the SPS survival model. These results deserve further prospective evaluation of the SPS in the real-life setting and in controlled trials, particularly at the time of the immunochemotherapy strategy emergence.
In conclusion, the SPS is easy to generate in real-life practice and efficiently discriminates three populations with different prognoses in patients receiving first-line etoposide - platinum-based chemotherapy. This study deserves further development steps, namely validation of this score in patients receiving immunochemotherapy for SCLC and addition of pertinent genotypic characterization to this score.
Acknowledgments
The authors thank the IFCT investigators.
Footnotes
Disclosure: Dr. Quoix reports grants and nonfinancial support from BMS, nonfinancial support from Roche and Takeda, and personal fees from Chugaï and Medscape, outside of the submitted work.
Dr. Molinier reports personal fees from Bristol Meyers Squibb, AstraZeneca, Tesaro, and Menarini, outside of the submitted work.
Dr. Greillier reports personal fees and nonfinancial support from Abbvie, Bristol Myers Squibb, Boehringer Ingelheim, AstraZeneca, Roche, Novartis, MSD, Pfizer, and Takeda, outside of the submitted work.
Dr. Audigier-Valette reports grants, personal fees, and nonfinancial support from Roche, during the conduct of the study; and grants, personal fees, and nonfinancial support from BMS, MSD, AstraZeneca, Boehringer, Pfizer, and Takeda, outside of the submitted work.
Dr. Moro-Sibilot reports grants, personal fees, and nonfinancial support from Roche, during the conduct of the study; grants, personal fees, and nonfinancial support from BMS; personal fees and nonfinancial support from MSD and Lilly; personal fees from Boehringer Ingelheim, Pfizer, AstraZeneca, Novartis, and Amgen; and grants and personal fees from AbbVie, outside of the submitted work.
Dr. Westeel reports personal fees from Roche, outside of the submitted work.
The remaining authors declare no conflict of interest.
References
- 1.Arriagada R., Le Chevalier T., Pignon J.P. Initial chemotherapeutic doses and survival in patients with limited small-cell lung cancer. N Engl J Med. 1993;329:1848–1852. doi: 10.1056/NEJM199312163292504. [DOI] [PubMed] [Google Scholar]
- 2.Pujol J.L., Breton J.L., Gervais R. Phase III double-blind, placebo-controlled study of thalidomide in extensive-disease small-cell lung cancer after response to chemotherapy: an intergroup study FNCLCC cleo04 IFCT 00-01. J Clin Oncol. 2007;25:3945–3951. doi: 10.1200/JCO.2007.11.8109. [DOI] [PubMed] [Google Scholar]
- 3.Spigel D.R., Townley P.M., Waterhouse D.M. Randomized phase II study of bevacizumab in combination with chemotherapy in previously untreated extensive-stage small-cell lung cancer: results from the SALUTE trial. J Clin Oncol. 2011;29:2215–2222. doi: 10.1200/JCO.2010.29.3423. [DOI] [PubMed] [Google Scholar]
- 4.Ready N.E., Pang H.H., Gu L. Chemotherapy with or without maintenance sunitinib for untreated extensive-stage small-cell lung cancer: a randomized, double-blind, placebo-controlled Phase II study-CALGB 30504 (alliance) J Clin Oncol. 2015;33:1660–1665. doi: 10.1200/JCO.2014.57.3105. [DOI] [PMC free article] [PubMed] [Google Scholar]
- 5.Morgensztern D., Besse B., Greillier L. Efficacy and safety of rovalpituzumab tesirine in third-line and beyond patients with DLL3-expressing, relapsed/refractory small-cell lung cancer: results from the phase II TRINITY study. Clin Cancer Res. 2019;25:6958–6966. doi: 10.1158/1078-0432.CCR-19-1133. [DOI] [PMC free article] [PubMed] [Google Scholar]
- 6.de Bono J., Ramanathan R.K., Mina L. Phase I, dose-escalation, two-part trial of the PARP inhibitor talazoparib in patients with advanced germline BRCA1/2 mutations and selected sporadic cancers. Cancer Discov. 2017;7:620–629. doi: 10.1158/2159-8290.CD-16-1250. [DOI] [PMC free article] [PubMed] [Google Scholar]
- 7.Gardner E.E., Lok B.H., Schneeberger V.E. Chemosensitive relapse in small cell lung cancer proceeds through an EZH2-SLFN11 axis. Cancer Cell. 2017;31:286–299. doi: 10.1016/j.ccell.2017.01.006. [DOI] [PMC free article] [PubMed] [Google Scholar]
- 8.Owonikoko T.K., Niu H., Nackaerts K. Randomized phase II study of paclitaxel plus alisertib versus paclitaxel plus placebo as second-line therapy for SCLC: primary and correlative biomarker analyses. J Thorac Oncol. 2020;15:274–287. doi: 10.1016/j.jtho.2019.10.013. [DOI] [PubMed] [Google Scholar]
- 9.Kalemkerian G.P., Loo B.W., Akerley W. NCCN guidelines insights: small cell lung cancer, version 2.2018. J Natl Compr Cancer Netw. 2018;16:1171–1182. doi: 10.6004/jnccn.2018.0079. [DOI] [PubMed] [Google Scholar]
- 10.Paz-Ares L., Dvorkin M., Chen Y. Durvalumab plus platinum-etoposide versus platinum-etoposide in first-line treatment of extensive-stage small-cell lung cancer (Caspian): a randomised, controlled, open-label, phase 3 trial. Lancet Lond Engl. 2019;394:1929–1939. doi: 10.1016/S0140-6736(19)32222-6. [DOI] [PubMed] [Google Scholar]
- 11.Horn L., Mansfield A.S., Szczęsna A. First-line Atezolizumab plus chemotherapy in extensive-stage small-cell lung cancer. N Engl J Med. 2018;379:2220–2229. doi: 10.1056/NEJMoa1809064. [DOI] [PubMed] [Google Scholar]
- 12.Micke P., Faldum A., Metz T. Staging small cell lung cancer: veterans administration lung study group versus international association for the study of lung cancer—what limits limited disease? Lung Cancer. 2002;37:271–276. doi: 10.1016/s0169-5002(02)00072-7. [DOI] [PubMed] [Google Scholar]
- 13.Nicholson A.G., Chansky K., Crowley J. The international association for the study of lung cancer lung cancer staging project: proposals for the revision of the clinical and pathologic staging of small cell lung cancer in the forthcoming eighth edition of the TNM classification for lung cancer. J Thorac Oncol. 2016;11:300–311. doi: 10.1016/j.jtho.2015.10.008. [DOI] [PubMed] [Google Scholar]
- 14.Cerny T., Anderson H., Bramwell V., Thatcher N., Blair V. Pretreatment prognostic factors and scoring system in 407 small-cell lung cancer patients. Int J Cancer. 1987;39:146–149. doi: 10.1002/ijc.2910390204. [DOI] [PubMed] [Google Scholar]
- 15.Wang S., Yang L., Ci B. Development and validation of a nomogram prognostic model for SCLC patients. J Thorac Oncol. 2018;13:1338–1348. doi: 10.1016/j.jtho.2018.05.037. [DOI] [PMC free article] [PubMed] [Google Scholar]
- 16.Deyo R.A., Cherkin D.C., Ciol M.A. Adapting a clinical comorbidity index for use with ICD-9-CM administrative databases. J Clin Epidemiol. 1992;45:613–619. doi: 10.1016/0895-4356(92)90133-8. [DOI] [PubMed] [Google Scholar]
- 17.Zhou T., Hong S., Hu Z. A systemic inflammation-based prognostic scores (mGPS) predicts overall survival of patients with small-cell lung cancer. Tumor Biol. 2015;36:337–343. doi: 10.1007/s13277-014-2623-4. [DOI] [PubMed] [Google Scholar]
- 18.Pujol J.L., Lavole A., Quoix E. Randomized phase II-III study of bevacizumab in combination with chemotherapy in previously untreated extensive small-cell lung cancer: results from the IFCT-0802 trial†. Ann Oncol. 2015;26:908–914. doi: 10.1093/annonc/mdv065. [DOI] [PubMed] [Google Scholar]
- 19.Pujol J.L., Greillier L., Audigier-Valette C. A randomized non-comparative phase II study of anti-programmed cell death-ligand 1 atezolizumab or chemotherapy as second-line therapy in patients with small cell lung cancer: results from the IFCT-1603 trial. J Thorac Oncol. 2019;14:903–913. doi: 10.1016/j.jtho.2019.01.008. [DOI] [PubMed] [Google Scholar]
- 20.Maestu I., Pastor M., Gómez-Codina J. Pretreatment prognostic factors for survival in small-cell lung cancer: a new prognostic index and validation of three known prognostic indices on 341 patients. Ann Oncol. 1997;8:547–553. doi: 10.1023/a:1008212826956. [DOI] [PubMed] [Google Scholar]
- 21.Xie D., Marks R., Zhang M. Nomograms predict overall survival for patients with small-cell lung cancer incorporating pretreatment peripheral blood markers. J Thorac Oncol. 2015;10:1213–1220. doi: 10.1097/JTO.0000000000000585. [DOI] [PubMed] [Google Scholar]
- 22.Brink I., Schumacher T., Mix M. Impact of [18F]FDG-PET on the primary staging of small-cell lung cancer. Eur J Nucl Med Mol Imaging. 2004;31:1614–1620. doi: 10.1007/s00259-004-1606-x. [DOI] [PubMed] [Google Scholar]
- 23.Ren Y., Dai C., Zheng H. Prognostic effect of liver metastasis in lung cancer patients with distant metastasis. Oncotarget. 2016;7:53245–53253. doi: 10.18632/oncotarget.10644. [DOI] [PMC free article] [PubMed] [Google Scholar]
- 24.Li J., Zhu H., Sun L., Xu W., Wang X. Prognostic value of site-specific metastases in lung cancer: a population based study. J Cancer. 2019;10:3079–3086. doi: 10.7150/jca.30463. [DOI] [PMC free article] [PubMed] [Google Scholar]
- 25.Tumeh P.C., Hellmann M.D., Hamid O. Liver metastasis and treatment outcome with anti-PD-1 monoclonal antibody in patients with melanoma and NSCLC. Cancer Immunol Res. 2017;5:417–424. doi: 10.1158/2326-6066.CIR-16-0325. [DOI] [PMC free article] [PubMed] [Google Scholar]
- 26.Fridlender Z.G., Sun J., Kim S. Polarization of tumor-associated neutrophil phenotype by TGF-beta: “N1” versus “N2” TAN. Cancer Cell. 2009;8:183–194. doi: 10.1016/j.ccr.2009.06.017. [DOI] [PMC free article] [PubMed] [Google Scholar]