

Abstract
Background
Classical randomization of clinical trial patients creates a source of genetic variance that may be contributing to the high failure rate seen in neurodegenerative disease trials. Our objective was to quantify genetic difference between randomized trial arms and determine how imbalance can affect trial outcomes.
Methods
5851 Parkinson’s disease patients of European ancestry data and two simulated virtual cohorts based on public data were used. Data was resampled at different sizes for 1000 iterations and randomly assigned to the two arms of a trial. False negative and false positive rates were estimated using simulated clinical trials, and percent difference in genetic risk score (GRS) and allele frequency was calculated to quantify variance between arms.
Results
5851 Parkinson’s patients (mean [sd] age, 61.02 [12.61] years; 2095 women [35.81%]) as well as simulated patients from virtually created cohorts were used in the study. Approximately 90% of the iterations had at least one statistically significant difference in individual risk SNPs between each trial arm. Approximately 5–6% of iterations had a statistically significant difference between trial arms in mean GRS. For significant iterations, the average percent difference for mean GRS between trial arms was 130.87%, 95% CI [120.89, 140.85] (n=200). GBA only simulations see an average 18.86%, 95% CI[18.01, 19.71] difference in GRS scores between trial arms (n=50). When adding a drug effect of −0.5 points in MDS-UPDRS per year at n=50, 33.9% of trials resulted in false negatives.
Conclusions
Our data support the hypothesis that within genetically unmatched clinical trials, genetic heterogeneity could confound true therapeutic effects as expected. Clinical trials should undergo pre-trial genetic adjustment or, at the minimum, post-trial adjustment and analysis for failed trials.
INTRODUCTION
In the past few decades, clinical trials for neurodegenerative disease-modifying drugs have repeatedly failed. Between the years 2002 and 2012, 413 Alzheimer’s Disease (AD) trials were performed, with 99.6% resulting in failure.1 83 of these trials were in phase III, which can cost an estimated $11.5 to $52.9 million.2 Success has also been elusive for Parkinson’s Disease (PD), where drugs such as Preladenant, that show potency in phase II, often fail to be successful in phase III.3 Failures at this stage of clinical trials can be attributed to numerous reasons, but one reason for failure may be attributable to genetic risk variability and non-optimal randomization of patient trial arms that can create large sources of variation in genetic risk factors across trial arms.
For PD, motor or cognitive symptoms serve as measurable outcomes in clinical trials. The Unified Parkinson’s Disease Rating Scale (UPDRS) as well as the Movement Disorder Society’s updated revision of this test (MDS-UPDRS), are used to assess the severity of PD symptoms. A combination of the UPDRS parts II (Activities of Daily Living) and III (Motor Examination) is often used as an endpoint in PD clinical trials. However, genetic heterogeneity can cause variance in terms of the progression and presentation of PD symptoms, potentially affecting overall MDS-UPDRS readings, and thus, trial outcomes. It was shown that PD genetic risk score (GRS - a score composed of the combined effects of common variants that are associated with a disease in genome wide association studies)4 can affect time to progression to H&Y stage 3.5 Furthermore, studies on common genetic variants that are part of the GRS, such as variants in GBA, MAPT and SNCA were suggested to affect progression of motor and/or cognitive symptoms.6,7 For example, the p.E326K variant in GBA, a component of GRS which is relatively common in PD and can be found in more than 5% of PD patients,8 is also associated with motor and cognitive progression in PD.6 A study investigating predictors of motor progression in PD patients found that an interaction between two SNPs, rs9298897 and rs17710829, resulted in a ~2 point increase in MDS-UPDRS score per year, indicative of a faster rate of motor decline in those patients.9
To say that all PD clinical trials do not undergo some extent of pre-trial genetic adjustment would be incorrect, as there are clinical trials underway specifically for PD patients who carry a GBA or LRRK2 mutation.10,11 However, even within these specific subgroups of PD mutations, large variation between patients still exists. GBA is a prime example, as different mutations within the GBA gene lead to differential effects on PD phenotypes.12,13 Carriers of severe GBA mutations have an age of onset (AAO) roughly 5 years earlier and around a 3–4 fold increase in disease risk, compared to mild GBA mutation carriers.14 Another example of this is seen among LRRK2 mutations, with different variant possessing different molecular mechanisms and cellular effects. LRRK2 G2019S, for example, is involved with kinase activation and lysosomal positioning alteration, where LRRK2 R1441C is linked to GTP hydrolysis disruption and has no known effects on lysosomal positioning.15 GRS for PD have also been connected to disparity in disease etiology, with an increase in risk score corresponding to a decrease in age at onset (AAO).16 Other studies suggest that a single standard deviation increase in GRS may speed onset to almost 1 year earlier.17 The relationship between AAO and PD symptoms are well described in many studies, finding that variance in AAO leads to variance in mortality as well as variations in presentation of motor and non-motor phenotypes.18,19 With a considerable amount of variance in PD disease etiology resulting from variance in genetic architecture, we hypothesize that classical randomization in clinical trials is creating genetic imbalance that may be affecting trial outcomes.
METHODS
Genetic risk score and variant nomination from GWAS
A GRS for each patient was calculated from the cumulative effect of each of the 47 variants nominated by GWAS.20 The regression coefficients, which represent the effect size of each allele of these variants, were used to calculate the GRS for each individual in the study. The formula as used and explained in Chang et al, 201720, is below:
In the above formula, k represents the total number of variants, βi is the regression coefficient associated with the effect allele from the GWAS, and SNPi is the variant. This formula is applied to all PD patients and controls in the dataframe, which results in a GRS for each person, which are then scaled to Z-scores (standard deviations of risk) weighted by the controls. Imputation of genetic data was done via the Michigan Imputation Server with the HRC reference panel, allowing no more than 5% genotype missingness per sample.
Single Variant and Genetic Risk Score Analysis
To simulate randomization in a clinical trial, data from 5851 PD patients were sampled for different trial sizes of 200, 400, 600, 1000, 2000, 3000, 4000, and 5000 participants. For each trial size, 1000 iterations were performed, and patients were randomly assigned to treatment and placebo arms of the trial. Genetic data was acquired from the IPDGC NeuroX dataset which consists of unrelated PD cases and controls of European ancestry. The NeuroX array is comprised of the standard Illumina exome content with an additional 24,000 custom variants relating to neurological diseases costing roughly $50-$60 per sample to genotype. This cohort can be obtained from dbGaP21 with study accession phs000918.v1.p1 and is described in detail in previous studies.22,23 Please see the supplementary material for additional information such as individual study/collection sites and demographics for this cohort. (Supplementary Table 1).
We then aimed to determine whether any of the 47 variants were not equally distributed between the arms of the trial, in each of the iterations in each cohort size, as such unequal distribution can potentially affect trial outcomes. Statistical significance for each variant was determined by its ability to classify a patient to the correct class of treatment or placebo group, achieved through the use of logistic regression. If a variant was determined to be significant, then imbalance between arms for that variant was large enough to be useful to the logistic regression model. Cohorts were not stratified into early and late onset groups for these analyses, as while GRS has been found to be significantly associated with AAO, it has not been found to be significant within AAO-stratified cohorts.16 This is likely due to a lack of power when sample size is decreased, so for the purposes of this manuscript we focused on quantifying variance using a typical clinical trial design.
In addition to analysis of cumulative allele frequencies at specific SNPs of interest, we also investigated the difference in mean GRS between trial arms. All 1000 Iterations were then filtered by the statistical significance of their Z-score, either falling above or below the 95% significance cut-off values of ±1.96. Percent difference was calculated to quantify the difference in GRS between arms. A basic visualization of the workflow for GRS and single variant analyses is provided for further clarity. (Figure 1).
Figure 1. Analysis Workflow.
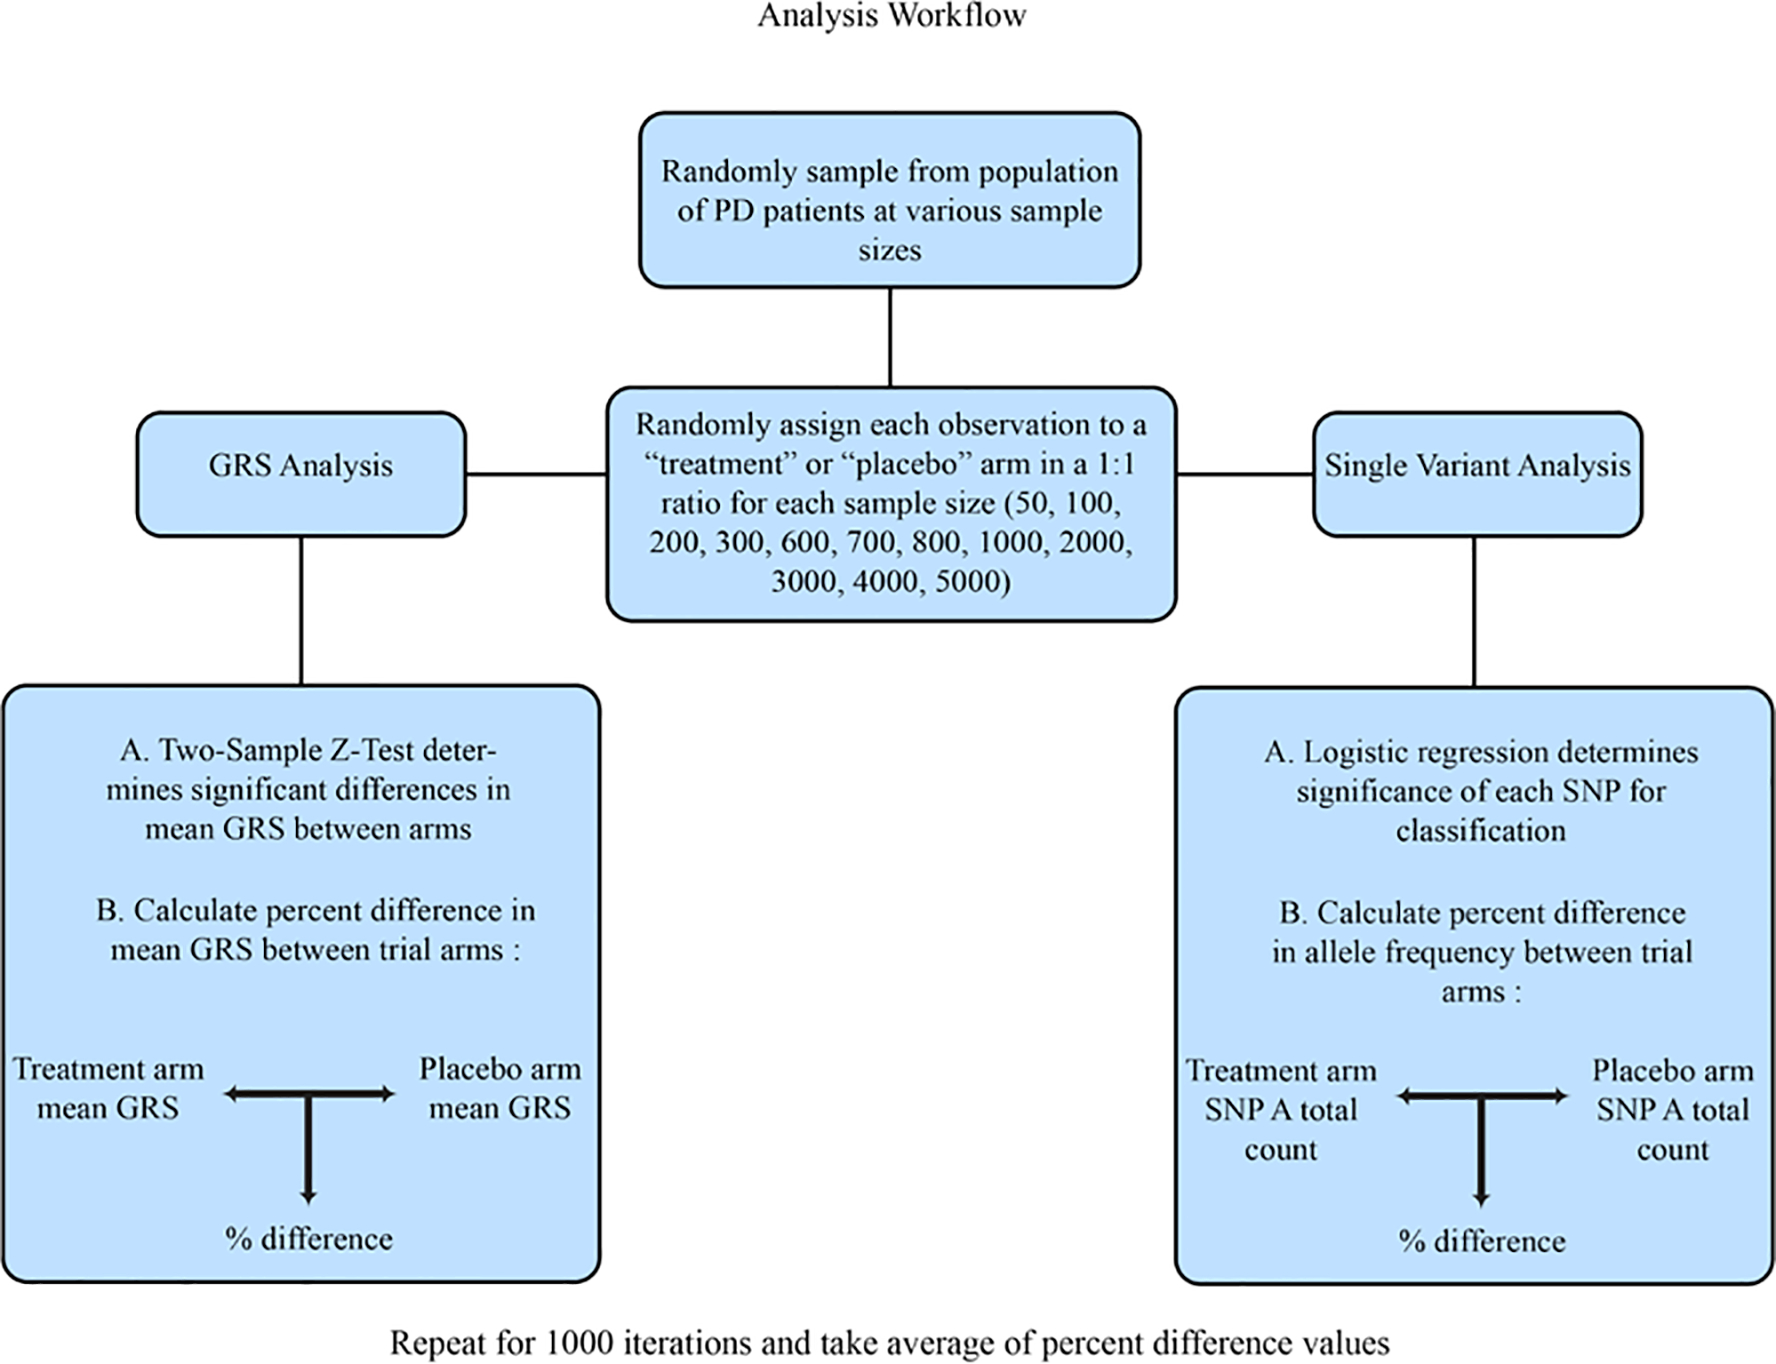
A visualization of the analysis process. This workflow was followed for every chosen sample size and repeated for 1000 iterations.
Difference in variance in GRS between arms was also investigated, as genetic variance between the two arms of randomly assigned patients will not always be equal. Trial arms were compared by performing a Levene’s Test for Equality of Variances at each iteration. Additional description of methods for this section of analysis focusing on within group variance estimates can be found in the supplementary material.
After initial variance analysis of the randomized cohorts, an algorithm was used to balance patients between trial arms by genotype using the 47 variants nominated by GWAS. Additional description of the above methods can be found in the supplementary material.
Virtual Cohort Simulation: rs9298897 and rs17710829
Next, we set to examine whether a combination of two variants (rs9298897 and rs17710829), can potentially affect trial outcomes, if the distribution of these variants is not similar in both trial arms. These variants were previously shown to affect PD progression by a 1–2 point increase in MDS-UPDRS (parts II and III) per year in carriers of both variants.9 Since the data from our NeuroX cohort of real patients did not have enough instances of this interaction due to low frequency of rs17710829, a virtual cohort was created with the statistical software R for this analysis. To create a virtual cohort of carriers, these variants were assigned to a simulated population of 5000 individuals according to Hardy-Weinberg equilibrium and European allele frequency estimates as reported by the ExAC Release 1 database.23,24 The estimates from this database are slightly lower than what would be seen in PD cases, and are therefore more conservative. Each virtual patient was represented by a generated ID and their assigned genotypes for each of these two variants as determined by their known frequencies. Virtual patients are represented in the manner same in our databases as the real patients, except variants are assigned due to frequency estimates rather than taken from genotyping information. A small example of what the virtual patient cohort looks like is included in the supplementary material (Supplementary Table 2).
Change in combined part II and III MDS-UPDRS scores from baseline were used to determine differences between arms. The MDS-UPDRS was revised from the original UPDRS to improve certain metrics that were not being satisfactorily captured.25 As change in MDS-UPDRS was the chosen metric, the initial score for each patient would not affect simulation results, however a range of baseline scores were chosen in order to mimic conditions in real trials. Virtual patients were randomly assigned a baseline MDS-UPDRS score on a range from 15 to 25, such that scores within that range followed a uniform distribution. For each of the two simulated years, all virtual patients were assigned a random progression in MDS-UPDRS score of either 1 or 2 points per year, a more conservative progression rate based upon the average increase in MDS-UPDRS scores found in the Holden et al study26, for simulation purposes. We chose the more conservative 1–2 point increase per year to focus on illuminating the potential effects of a genetic imbalance, without other sources of variance confounding results, such as a large range in typical progression. We chose to limit other sources of variance to focus on the effect the genetic variants would have. As large variance can detrimentally affect test significance, we wanted to create a hypothetical situation where variance in typical progression was controlled. This was to highlight that even in a perfect scenario with no additional confounding effects that significantly affect progression rate, a genetic imbalance between arms is enough to cause false negative and false positive trials. Carriers of both the rs9298897 and rs17710829 variant received an additional increase in MDS-UPDRS score in accordance with the model effect size reported in Latourelle et al (β = 2.374, SE = 0.436). This cohort was sampled at sizes of 50, 100, 200, 300, 600, 700, and 800 observations and patients were randomly assigned to simulated treatment or placebo arm. Both false positive (i.e. simulated drug is not effective, yet trial results are positive due to imbalanced distribution of the two SNPs) and false negative (simulated drug is effective, yet trial results are negative due to imbalanced distribution of the two SNPs) rates were investigated in this stage by performing 2 sample Z-tests for each iteration. Percentage of false positives caused by the addition of the SNP interaction effect were calculated by comparing the results of tests with and without the effect. For false negative rates, a simulated “drug” effect that decreased MDS-UPDRS score by 0.5 points per year was added to the patients in the treatment arm.
Virtual Cohort Simulation: GBA
Similarly to the interaction cohort above, a virtual cohort for GBA mutation carriers was generated for simulation use. Many of the variants associated with this gene have low allele frequencies, resulting in only a small amount of real data. As with the interaction cohort, a virtual cohort was created to counteract this limitation. Three of the 47 variants used in this study are GBA variants, and these same variants were used to create a virtual cohort of patients, representing one of the many ongoing or upcoming GBA focused interventional trials. Using effect estimates from this study, individual genetic risk contribution was assigned to each variant. The variants were p.N370S (rs76763715) (β = 0.747, 95% CI [0.60, 0.90]), p.E326K (rs2230288) (β = 0.636, 95% CI [0.55, 0.72]), and p.T369M (rs75548401) (β = 0.362, 95% CI [0.23, 0.50]), all three of which have been associated with risk for PD.27,28,29,30 Each variant was then assigned to a population of ~60,000 simulated individuals according to Hardy-Weinberg equilibrium and European allele frequency estimates as reported by the ExAC Release 1 database.24 GRS for each virtual patient was calculated using the same formula as before, but using only the 3 chosen GBA variants. Each virtual patient was represented by an arbitrary ID, assigned genotypes for the 3 GBA variants, and individual GRS. Patients were filtered for those who possessed at least one of the chosen mutations and then sampled at sizes of 50, 100, 200, 300, 600, 700, 800, 1000, and 2000 observations to simulate GBA targeted trials. Raw GRS scores were used for analysis of this cohort rather than control-weighted Z-scores as with the larger cohort. Average percent difference in GRS between trial arms was calculated for each sample size.
This study was IRB approved and all patients gave written informed consent, protocol number 2003–077.
All statistical and modeling analyses were conducted with R.31 Code is available to the public through the National Institute on Aging Laboratory of Neurogenetics Github at https://github.com/neurogenetics/Clinical-Trial-Outcomes. Additional info is in the supplementary material.
RESULTS
High Genetic Heterogeneity with Randomization of Different Simulated Trial Sizes
To examine how randomization of patients at different sample sizes affects variability in overall GRS difference between arms, we performed 1000 iterations of sampling and randomization of trial arms for different sample sizes. Evaluation of GRS differences across trial arms revealed that overall average percent difference between trial arms was high at small sample sizes, and the magnitude of difference decreased as sample size increased. (Figure 2.A.). Results from analysis of differences in variance in GRS between trial arms were similar to differences in mean GRS, with a high percent difference between arms that decreased as sample size increased. Additional results and tables from this analysis can be found in the supplementary material. (Supplementary Table 3). Statistically significant iterations in either variance or mean GRS difference between the simulated trial arms accounted for roughly 10% of iterations at all sample sizes. At smaller sample sizes, percent difference in GRS score can be over 100% when comparing trial arms, but this difference decreased to roughly half that amount as the sample size reached 1000 patients (Table 1). Classic randomization will create large differences in GRS between trial arms, therefore, a more conscious method of trial randomization that accounts for patient genotype imbalance needs to be incorporated into trial design.
Figure 2.
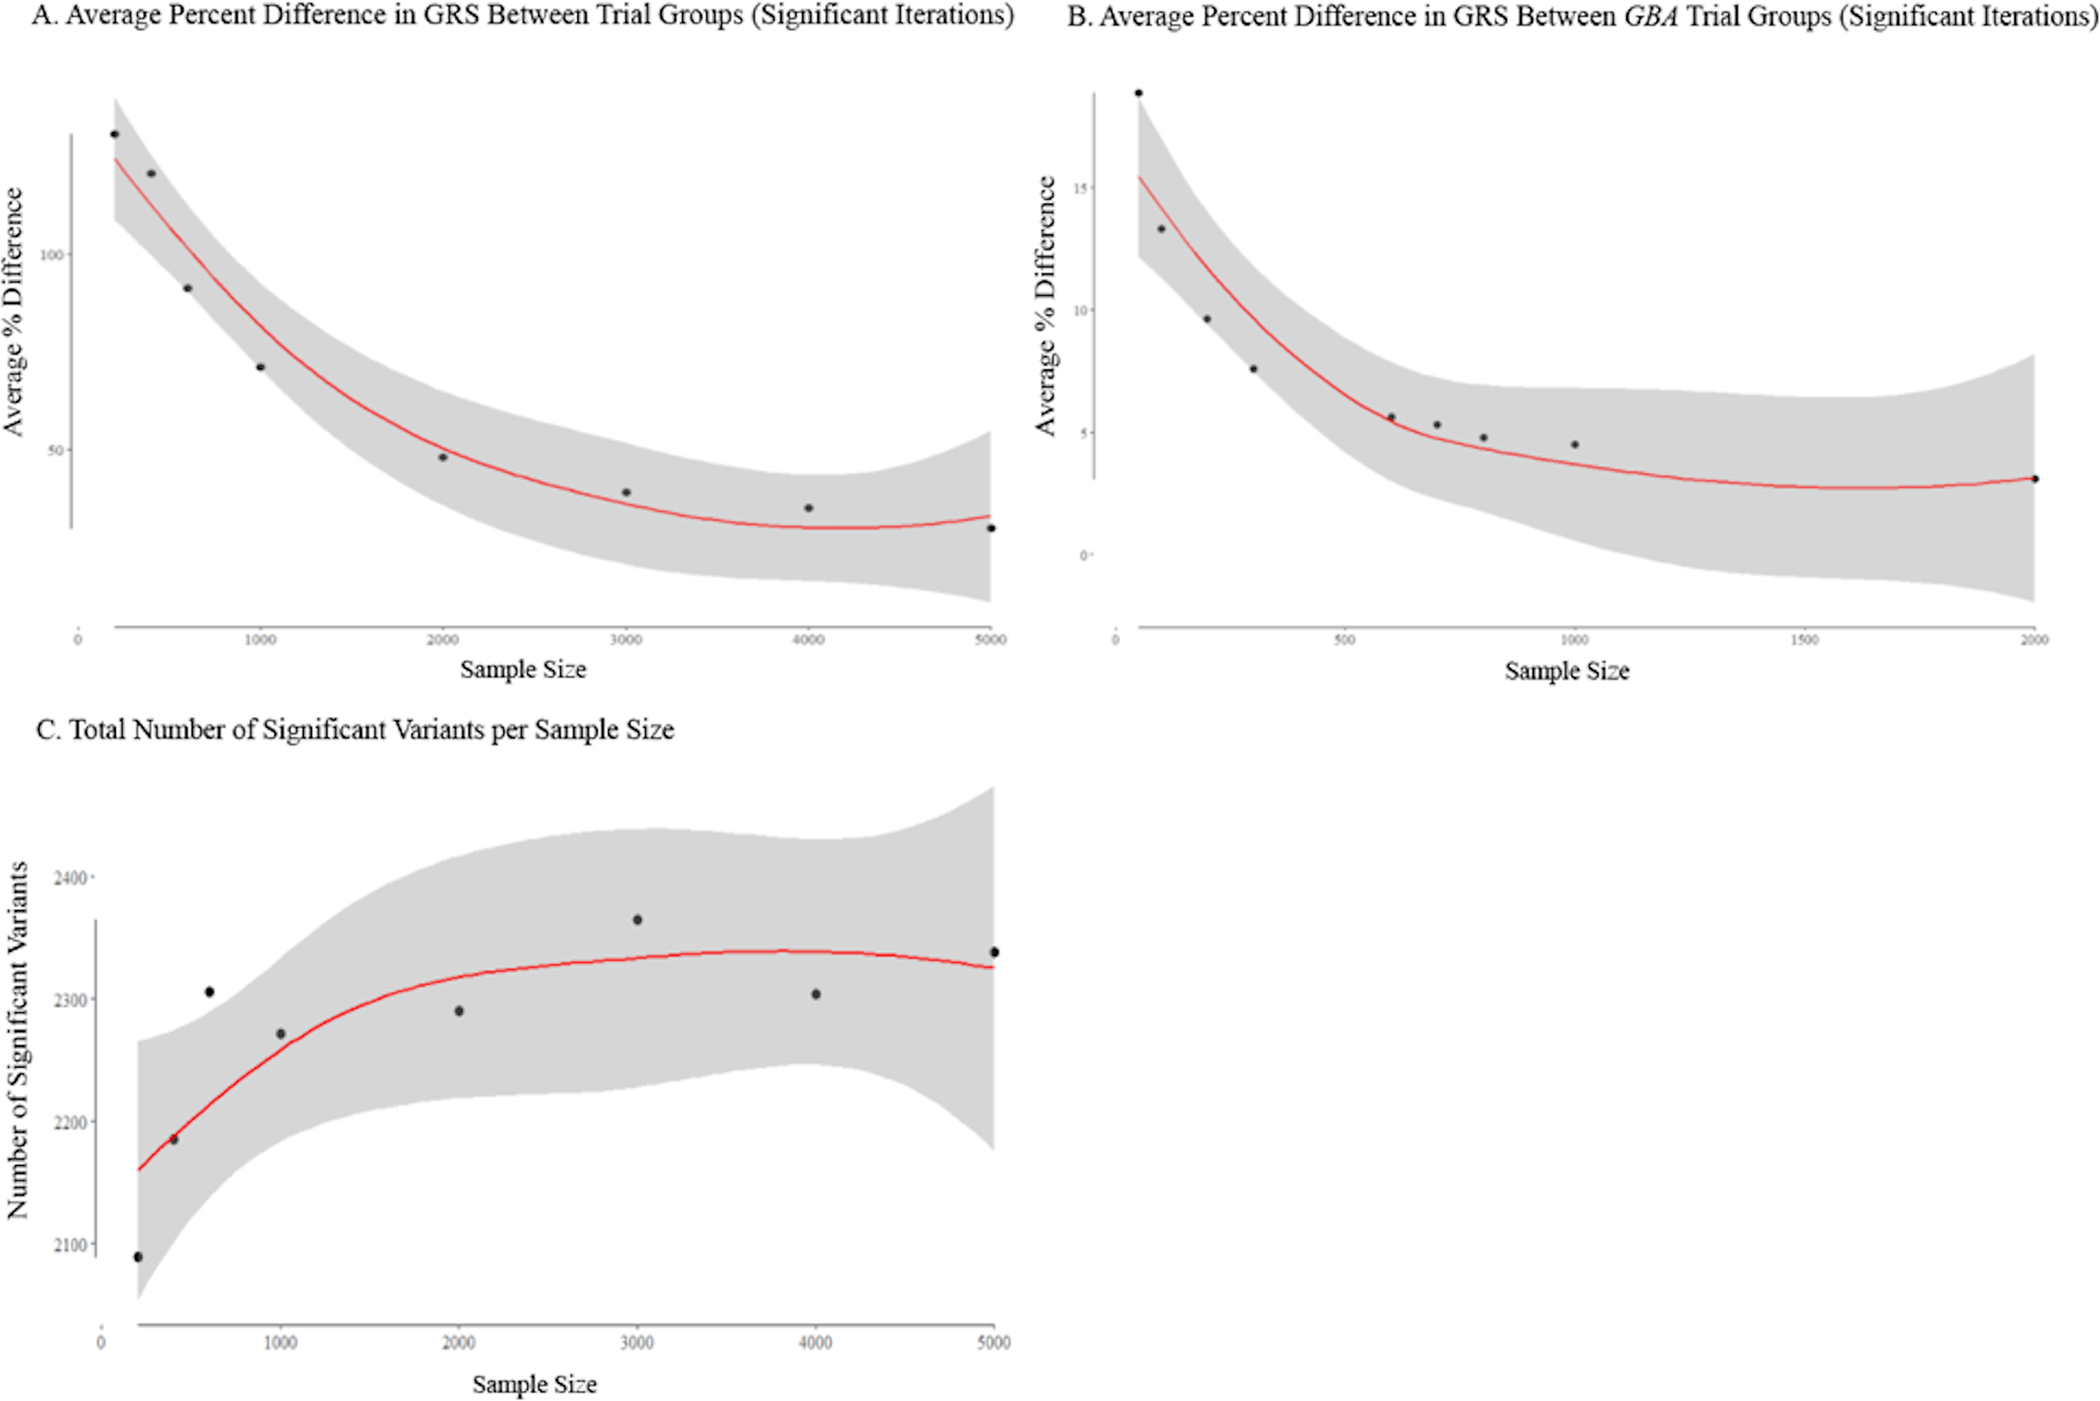
(A) Average per cent difference in GRS between trial groups (significant iterations). (B) Average per cent difference between GBA trial groups (significant iterations). (C) Total number of significant variants per sample size/lines are fit to relationships using locally weighted polynomial regression models (LOESS) and CIs are shown in grey. Residual SE and span values were obtained from the LOESS models and significance and R2 values were obtained from polynomial regression models. (A) The relationship between per cent difference in between-group variance and sample size is shown. Significant iterations were determined by Z-score cut-off values of ±1.96 (p<0.05). Span=1.4; residual SE=7.946; adjusted R2=0.928; p=0.0006. (B) The relationship between per cent difference in between-group variance and sample size is shown for the GBA cohort. Significant iterations were determined by Z-score cut-off values of ±1.96 (p<0.05). Span=1.17; residual SE=2.379; adjusted R2=0.794; p=0.0032. (C) The relationship between the total number of times a variant was a significant predictor and sample size is shown. Significance for prediction was determined by a binomial generalised linear model with a legit link function (p<0.05). Span=1.4; residual SE=57.52; adjusted R2=0.585; p=0.097. GRS, genetic risk score.
Table 1.
Average % Difference in Mean GRS
| Sample Size | Average % Difference in GRS (CI 95%) Significant Iterations | Average % Difference in GRS (CI 95%) All Iterations | % Difference Range (Min – Max) |
|---|---|---|---|
| 200 | 130.87 (120.89 – 140.85) | 51.55 (49.01 – 54.10) | 0.079 – 198.76 |
| 400 | 108.47 (99.10 – 117.85) | 36.60 (34.77 – 38.42) | 0.045 – 179.82 |
| 600 | 91.31 (85.58 – 97.05) | 29.14 (27.67 – 30.61) | 0.024 – 146.82 |
| 1000 | 71.15 (66.91 – 75.39) | 22.64 (21.52 – 23.77) | 0.006 – 103.84 |
| 2000 | 48.03 (45.66 – 50.40) | 16.67 (15.86 – 17.48) | 0.006 – 86.71 |
| 3000 | 39.00 (37.45 – 40.56) | 13.91 (13.25 – 14.56) | 0.001 – 56.55 |
| 4000 | 35.02 (33.20 – 36.84) | 11.22 (10.69 – 11.75) | 0.016 – 53.26 |
| 5000 | 29.87 (28.43 – 31.31) | 10.58 (10.09 – 11.07) | 0.014 – 47.12 |
The average percent difference between trial arms and related confidence intervals are shown for each sample size for both significant iterations and total iterations. Significant iterations were determined by Z-score cut-off scores of ± 1.96 (p < 0.05). Minimum and maximum percent differences found between arms for all 1000 iterations are also shown.
Variation in Single Variant Distribution Between Randomized Arms
To investigate imbalance between variants we determined where frequency of each of the 47 variants were significantly different between randomized arms. This revealed that approximately 90% of the trials, regardless of trial size, resulted in a significant difference in allele frequency of the risk SNPs between treatment and placebo arms. We found that number of significant variants (unadjusted P < 0.05) fluctuated with sample size. This suggests that it is unlikely that simply increasing sample size will result in a reduction in the number of significantly differently distributed variants between arms. This is a function of allele frequency and statistical power as sample size increases. In addition, there was a non-significant correlation between sample size and number of significant variants (r = 0.686, p = 0.061), that suggests that increasing sample size may result in an overall increase in the number of significantly different variant distributions (Figure 2.C.). However, while number of significant variants may increase, the percent difference in allele frequency of the SNPs of interest between arms decreases. For significant iterations, average percent difference in cumulative risk allele dosage decreases from 41.60% to 27.60%, a drop in difference of 14% (p = 5.76e-66, 95% CI [12.42, 15.57]) as sample size increases from 200 to 1000. (Table 2.) True percent difference between arms is likely higher than stated here, as situations where either one of the trial arms possessed zero counts of a rare variant could not be included in percent difference calculations. As such a high number of simulated trial iterations resulted in significantly different variant frequencies, genotype needs to be taken into account when designing trials, to prevent an imbalance in one of these variants affecting disease progression or readout and altering the outcome of a trial.
Table 2.
Average % Difference in Variant Dosage
| Sample Size | Average % Difference in GRS (CI 95%) Significant Iterations | Average % Difference in GRS (CI 95%) All Iterations | % Difference Range (Min – Max) |
|---|---|---|---|
| 200 | 41.60 (40.57 – 42.62) | 51.55 (49.01 – 54.10) | 0.079 – 198.76 |
| 400 | 33.80 (32.68 – 34.93) | 36.60 (34.77 – 38.42) | 0.045 – 179.82 |
| 600 | 91.31 (85.58 – 97.05) | 29.14 (27.67 – 30.61) | 0.024 – 146.82 |
| 1000 | 71.15 (66.91 – 75.39) | 22.64 (21.52 – 23.77) | 0.006 – 103.84 |
| 2000 | 48.03 (45.66 – 50.40) | 16.67 (15.86 – 17.48) | 0.006 – 86.71 |
| 3000 | 39.00 (37.45 – 40.56) | 13.91 (13.25 – 14.56) | 0.001 – 56.55 |
| 4000 | 35.02 (33.20 – 36.84) | 11.22 (10.69 – 11.75) | 0.016 – 53.26 |
| 5000 | 29.87 (28.43 – 31.31) | 10.58 (10.09 – 11.07) | 0.014 – 47.12 |
The average percent difference in allele dosage for each of the 47 variants used in this study between trial arms and related confidence intervals are shown for each sample size for both significant and total iteration. Significant iterations were determined by Z-score cut-off scores of ± 1.96 (p < 0.05). Minimum and maximum percent differences found between arms are also shown.
False Negative and False Positive Rates
An interaction effect between two variants associated with an increase in MDS-UPDRS was used to demonstrate the effects of imbalanced trials on overall outcome. We found that at small sample sizes, 33.9% of trials resulted in a false negative with the simulated drug effect of a 0.5 point reduction in MDS-UPDRS score per year at n = 50. False negative rate decreased as sample size increased, reaching nearly 1.0% as sample size approached 200. With the addition of the second year of the trial, percentage of false negatives decreased across sample sizes, however, 21.2% of iterations still resulted in a false negative at n = 50. Number of iterations that resulted in false positives and false negatives were compared both with and without the interaction effect. This allowed us to determine how many false positives and negatives were truly attributable to in imbalance of these SNPs between arms. Percentage of false negatives caused by the SNP interaction effect alone increased with sample size, with 100% of the observed false negatives being caused by the interaction as sample size increased to 200 for trial year 1. Nearly 100% of false negatives in trial year 2 were caused by the SNP interaction effect alone. (Table 3). False positives and the percentage of false positives caused by the SNP interaction effect were fairly similar across sample sizes. (Table 4). Failing to balance trial arms using genetic information can result in an imbalance of variants that can affect disease progression and outcome, ultimately resulting in changing the result of a clinical trial.
Table 3.
False Negative Rates for Unbalanced Trials Over a Simulation of 2 Years
| Year 1 | Year 2 | |||
|---|---|---|---|---|
| Sample Size | Total N(%) of FN | N(%) of FN by SNP Effect | Total N(%) of FN | N(%) of FN by SNP Effect |
| 50 | 339 (33.9%) | 284 (83.8%) | 212 (21.2%) | 212 (99.5%) |
| 100 | 112 (11.2%) | 111 (99.1%) | 32 (3.2%) | 32 (100.0%) |
| 200 | 9 (0.9%) | 9 (100.0%) | 1 (0.1%) | 1 (100.0%) |
| 300 | 0 (0.0%) | 0 (0.0%) | 0 (0.0%) | 0 (0.0%) |
| 600 | 0 (0.0%) | 0 (0.0%) | 0 (0.0%) | 0 (0.0%) |
| 700 | 0 (0.0%) | 0 (0.0%) | 0 (0.0%) | 0 (0.0%) |
| 800 | 0 (0.0%) | 0 (0.0%) | 0 (0.0%) | 0 (0.0%) |
FN = false negative. False negative rates were investigated by determining the number of significant and non-significant trials when comparing change in UPDRS over a simulation of two years after adding a “drug” effect that reduced UPDRS by 0.5 points per year. Total % of false negatives is the percentage of total iterations that resulted in a false negative. % of false negatives by SNP effect is the percentage of false negatives that were caused by the interaction effect on UPDRS progression by the rs9298897 and rs17710829 SNPs alone. Significance was determined by Z score cut-off values of ± 1.96 (p < 0.05).
Table 4.
False Positive Rates for Unbalanced Trials Over a Simulation of 2 Years
| Year 1 | Year 2 | |||
|---|---|---|---|---|
| Sample Size | Total N(%) of FP | N(%) of FP by SNP Effect | Total N(%) of FP | N(%) of FP by SNP Effect |
| 50 | 61 (6.1%) | 30 (49.2%) | 56 (5.6%) | 40 (71.4%) |
| 100 | 58 (5.8%) | 48 (82.8%) | 52 (5.2%) | 44 (84.6%) |
| 200 | 59 (5.9%) | 43 (72.9%) | 57 (5.7%) | 49 (86.0%) |
| 300 | 45 (4.5%) | 32 (71.1%) | 57 (5.7%) | 47 (86.0%) |
| 600 | 45 (4.5%) | 32 (71.1%) | 57 (5.7%) | 43 (75.4%) |
| 700 | 60 (6.0%) | 47 (78.3%) | 48 (4.8%) | 44 (91.7%) |
| 800 | 57 (5.7%) | 43 (75.4%) | 43 (4.3%) | 32 (74.4%) |
FP = false positive. False positive rates were investigated by determining the number of significant and non-significant trials when comparing change in UPDRS over a simulation of two years. Total % of false positives is the percentage of total iterations that resulted in a false positive. % of false positives by SNP effect is the percentage of false positives that were caused by the interaction effect on UPDRS progression by the rs9298897 and rs17710829 SNPs alone. Significance was determined by Z score cut-off values of ± 1.96 (p < 0.05).
The Effects of Balancing on Variance per Simulated Trial Sample Size
Balancing trial arms according to allele count significantly reduced genetic variance between arms, results for this can be found in the supplementary material. (Supplementary Table 4, Supplementary Figure 3).
Genetic Heterogeneity in Randomized Virtual GBA Cohort
To investigate GRS variance within a stratified genetic subpopulation, we created a virtual cohort of GBA variant carriers using effect estimates and European population frequencies. This virtual model considers 3 known GBA variants with estimates of effect size. Variance analysis of the virtual GBA cohort revealed patterns similar to the larger cohort, despite GRS being comprised of only 3 GBA variants. Analysis of differences in mean GRS between arms showed the same higher quantities of variance at small sample sizes. Real GBA cohorts that possess a wider range of variants both within and outside the gene are likely to display greater differences between trial arms (Table 5, Figure 2.B.). Results for difference in variance in GBA GRS and the balanced GBA cohort and are located in the supplementary material (Supplementary Table 2, Supplementary Table 5). Genetic variance should be considered during the design of a trial even for studies created for specific mutation carriers.
Table 5.
Average % Difference in Mean GBA GRS
| Sample Size | Average % Difference in GRS (CI 95%) Significant Iterations | Average % Difference in GRS (CI 95%) All Iterations | % Difference Range (Min – Max) |
|---|---|---|---|
| 50 | 18.86 (18.01 – 19.71) | 6.76 (6.43 – 7.08) | 0.000 – 28.78 |
| 100 | 13.31 (12.74 – 13.89) | 4.83 (4.61 – 5.05) | 0.000 – 20.78 |
| 200 | 9.63 (9.18 – 10.08) | 3.24 (3.09 – 3.39) | 0.000 – 14.41 |
| 300 | 7.59 (7.38 – 7.80) | 2.70 (2.57 – 2.83) | 0.013 – 9.50 |
| 600 | 5.62 (5.40 – 5.83) | 1.90 (1.81 – 1.99) | 0.001 – 8.12 |
| 700 | 5.31 (5.04 – 5.58) | 1.76 (1.67 – 1.84) | 0.001 – 7.67 |
| 800 | 4.77 (4.59 – 4.95) | 1.65 (1.58 – 1.73) | 0.006 – 6.43 |
| 1000 | 4.49 (4.27 – 4.70) | 1.48 (1.41 – 1.51) | 0.003 – 7.77 |
| 2000 | 3.09 (2.96 – 3.23) | 1.06 (1.01 – 1.11) | 0.001 – 4.42 |
The average percent difference between GBA trial arms and related confidence intervals are shown for each sample size for both significant iterations and total iterations. Significant iterations were determined by Z-score cut-off scores of ± 1.96 (p < 0.05). Minimum and maximum percent differences found between arms for all 1000 iterations are also shown.
DISCUSSION
Our simulation demonstrates that randomization without efforts to improve genetic imbalance, will result in significant variance between treatment and placebo arms in the vast majority of trials, of either a single SNP, multiple SNPs, or GRS. As differences in GRS and allele carrier status can lead to differences in phenotypic readout, controlling this source of variance would lead to better balanced trial arms that could improve clinical trial results, depending on the genetic contribution to phenotype presentation. Virtual cohort analysis revealed that even when performing gene-specific stratification, different variants within a single gene can create large sources of variance between arms. Genetic balancing should be performed even in trials using small subgroups of variant carriers, such as GBA variant carriers, to mitigate the varying effects that different variants within and outside the targeted gene can have on disease presentation, and thus, trial outcome. As mentioned above, GRS has been found to be significantly associated with progression time to Hoehn and Yahr stage 3, with one standard deviation increase in total polygenic modeling GRS resulting in a 1.29 increase in hazard ratio.5 This finding, along with the results from Latourelle et al9, suggest that it is likely there are many more unknown associations between variants/GRS and progression in PD phenotypes. Given 47 variants with the possibility to affect phenotypic readout, there is only roughly a 10% chance that any given trial will have no differences in variant distributions between placebo and treatment arms. While one or two patients with rare variants will not affect trial outcomes, an imbalanced group of large-effect rare variant carriers could skew results, particularly as misdiagnosis rate for neurodegenerative diseases is high.
Simulation analysis of a variant interaction effect on MDS-UPDRS showed how clinical trial outcomes could be affected by unbalanced genetic variants with influence on phenotype progression. For small sample sizes, these effects are especially noticeable. As an example, considering the aforementioned 413 failed Alzheimer’s trials that took place between 2002 to 2012 and the simulated 2 year failure rate of 21.2% from the SNP interaction effect at n=50, if the smaller trials had contained disparities in measurable disease outcome similar to the effects of rs9298897 and rs17710829 in PD, roughly 87 of those trials may have failed due to genetic disease disparity. In addition, the interaction of the variants used in this simulation is quite rare, thus a similar effect size for more common SNPs and interactions will likely lead to higher rates of both false positive and false negative iterations. As this analysis was only based on the interaction between two SNPs, these results will vary in real clinical trials that hold more variability in terms of disease progression and genetic influences on phenotype, since variants in genes such as GBA, MAPT, SNCA and others may also affect PD progression.6,7 Further, reducing heterogeneity allows for a reduction in sample size, cutting trial costs. This has been shown to be true in studies such as Stone et al.32, where they found that genotyping for APOE in AD trials resulted in an increase of power if sample sizes remained the same, or allowed for the number of study sites to be reduced without decreasing power.
While we have mainly discussed the effects of genetic variance in terms of clinical trial failure, differences in GRS between arms can also create a positive or negative bias for a drug. An important goal in a clinical trial is to determine if any witnessed benefits are a true drug effect, but variance in underlying genetics may cause false conclusions to be made. A genetic effect on progression could be construed as the effect of the drug, when in fact, this is an example of “collider bias” or “selection bias”.33 This effect can occur in the opposite direction as well, such as in the case of an imbalance in carriers of the LRRK2 G2019S, a mutation which has recently been connected to a slower rate of decline in motor function than in those without the mutation.34 Slower progression rates in the treatment arm could lead to false positives when the drug is ineffective. Balancing trials by GRS and allele distribution would control possible genetic bias that could lead to a false effect being classified as the effect of the tested drug.
Another source of variance that was not addressed in the current analysis, is genetic factors that may affect the metabolism of the drug itself. These will add to the overall genetic variance and are harder to take into account when testing a new drug. In case of such variance, post-trial analysis of the treatment group can identify such variants, and a statistical correction could be applied based on the effects of such variants. A major limitation of such an approach will be that a relatively large studies, or meta-analysis of studies, will be required.
Therefore, pre-trial genotyping of the patients using standard SNP genotyping arrays that contain the known PD-related SNPs, followed by a controlled randomization process that will balance the trial arms as we done here, can be highly cost-effective. Genotyping the NeuroX cohort used in the first part of this analysis cost roughly $50-$60 per sample. For smaller sample sizes where genetic imbalance can make the most difference, this would mean an added cost of only $10,000 to $20,000. Considering the total cost of clinical trials, this is a small price to pay to reduce any possible negative effects genetic imbalance may contribute to trial outcome. With patient genotypes available, we suggest that at the minimum, balancing of known disease risk variants should be performed. Upon enrollment, patients can be assigned to the trial arm that best balances overall variation, using a simple algorithm. We provide an example of this in the supplementary material, where we use an algorithm (freely available upon request) designed to balance trial arms by genotype. We cannot afford to wait until we understand the exact effect of all human genetic variation on disease etiology and drug response, and thus with the current knowledge that genetic variation creates disease variation and possible imbalance between trial arms, should design clinical trials to the best of our ability.
While we have demonstrated the importance of genetic balancing across trial arms, an important caveat to consider is that we can only control variance to the extent of what is known by current heritability estimates. In addition to this study demonstrating the importance of genetic balance in clinical trials, it is also a call for larger scale genetic studies on progression that will allow us to account for and balance currently unknown sources of variance. Valuable future work would be to further investigate the effects of variants on phenotypic outcomes that are measured by clinical trials, such as change in UPDRS, to gain greater understanding of sources of variance in trial outcomes that can be controlled.
Supplementary Material
ACKNOWLEDGMENTS
See supplementary materials for IPDGC member acknowledgements and disclosures.
References
- 1.Cummings JL, Morstorf T & Zhong K Alzheimer’s disease drug-development pipeline: few candidates, frequent failures. Alzheimers. Res. Ther 6, 37 (2014). [DOI] [PMC free article] [PubMed] [Google Scholar]
- 2.Sertkaya A, Wong H-H, Jessup A & Beleche T Key cost drivers of pharmaceutical clinical trials in the United States. Clin. Trials 13, 117–126 (2016). [DOI] [PubMed] [Google Scholar]
- 3.Stocchi F, Rascol O, Hauser RA, Huyck S, Tzontcheva A, Capece R, Ho TW, Sklar P, Lines C, Michelson D, Hewitt DJ & Preladenant Early Parkinson Disease Study Group. Randomized trial of preladenant, given as monotherapy, in patients with early Parkinson disease. Neurology 88, 2198–2206 (2017). [DOI] [PubMed] [Google Scholar]
- 4.Nalls MA, Blauwendraat C, Vallerga CL, Heilbron K, Bandres-Ciga S, Chang D, Tan M, Kia DA, Noyce AJ, Xue A, Bras J, Young E, von Coelln R, Simon-Sanchez J, Schulte C, Sharma M, Krohn L, Pihlstrom L, Siitonen A, Iwaki H, Leonard H, Faghri F, Raphael Gibbs J, Hernandez DG, Scholz SW, Botia JA, Martinez M, Corvol J-C, Lesage S, Jankovic J, Shulman LM, The 23andMe Research Team, System Genomics of Parkinson’s Disease (SGPD) Consortium, Sutherland M, Tienari P, Majamaa K, Toft M, Brice A, Yang J, Gan-Orr Z, Gasser TM, Heutink PM, Shulman JM, Wood NA, Hinds DA, Hardy JR, Morris HR, Gratten JM, Visscher PM, Graham RR, Singleton AB & International Parkinson’s Disease Genomics Consortium. Expanding Parkinson’s disease genetics: novel risk loci, genomic context, causal insights and heritable risk. bioRxiv 388165 (2019). doi: 10.1101/388165 [DOI] [Google Scholar]
- 5.Pihlstrøm L, Morset KR, Grimstad E, Vitelli V & Toft M A cumulative genetic risk score predicts progression in Parkinson’s disease. Mov. Disord 31, 487–490 (2016). [DOI] [PubMed] [Google Scholar]
- 6.Davis MY, Johnson CO, Leverenz JB, Weintraub D, Trojanowski JQ, Chen-Plotkin A, Van Deerlin VM, Quinn JF, Chung KA, Peterson-Hiller AL, Rosenthal LS, Dawson TM, Albert MS, Goldman JG, Stebbins GT, Bernard B, Wszolek ZK, Ross OA, Dickson DW, Eidelberg D, Mattis PJ, Niethammer M, Yearout D, Hu S-C, Cholerton BA, Smith M, Mata IF, Montine TJ, Edwards KL & Zabetian CP Association of GBA Mutations and the E326K Polymorphism With Motor and Cognitive Progression in Parkinson Disease. JAMA Neurol. 73, 1217–1224 (2016). [DOI] [PMC free article] [PubMed] [Google Scholar]
- 7.Wang G, Huang Y, Chen W, Chen S, Wang Y, Xiao Q, Liu J, Fung VSC, Halliday G & Chen S Variants in the SNCA gene associate with motor progression while variants in the MAPT gene associate with the severity of Parkinson’s disease. Parkinsonism Relat. Disord 24, 89–94 (2016). [DOI] [PubMed] [Google Scholar]
- 8.Duran R, Mencacci NE, Angeli AV, Shoai M, Deas E, Houlden H, Mehta A, Hughes D, Cox TM, Deegan P, Schapira AH, Lees AJ, Limousin P, Jarman PR, Bhatia KP, Wood NW, Hardy J & Foltynie T The glucocerobrosidase E326K variant predisposes to Parkinson’s disease, but does not cause Gaucher’s disease. Mov. Disord 28, 232–236 (2013). [DOI] [PMC free article] [PubMed] [Google Scholar]
- 9.Latourelle JC, Beste MT, Hadzi TC, Miller RE, Oppenheim JN, Valko MP, Wuest DM, Church BW, Khalil IG, Hayete B & Venuto CS Large-scale identification of clinical and genetic predictors of motor progression in patients with newly diagnosed Parkinson’s disease: a longitudinal cohort study and validation. Lancet Neurol. 16, 908–916 (2017). [DOI] [PMC free article] [PubMed] [Google Scholar]
- 10.A Global Study to Assess the Drug Dynamics, Efficacy, and Safety of GZ/SAR402671 in Parkinson’s Disease Patients Carrying a Glucocerebrosidase (GBA) Gene Mutation - Full Text View - ClinicalTrials.gov. at <https://clinicaltrials.gov/ct2/show/NCT02906020>
- 11.LRRK2 Drug Trial Shares Promising Results, Company to Begin Second Study. The Michael J. Fox Foundation for Parkinson’s Research | Parkinson’s Disease at <https://www.michaeljfox.org/foundation/news-detail.php?first-lrrk2-drug-in-clinical-trials-company-files-public-offering>
- 12.Cilia R, Tunesi S, Marotta G, Cereda E, Siri C, Tesei S, Zecchinelli AL, Canesi M, Mariani CB, Meucci N, Sacilotto G, Zini M, Barichella M, Magnani C, Duga S, Asselta R, Soldà G, Seresini A, Seia M, Pezzoli G & Goldwurm S Survival and dementia in GBA-associated Parkinson’s disease: The mutation matters. Ann. Neurol 80, 662–673 (2016). [DOI] [PubMed] [Google Scholar]
- 13.Liu G, Boot B, Locascio JJ, Jansen IE, Winder-Rhodes S, Eberly S, Elbaz A, Brice A, Ravina B, van Hilten JJ, Cormier-Dequaire F, Corvol J-C, Barker RA, Heutink P, Marinus J, Williams-Gray CH, Scherzer CR & International Genetics of Parkinson Disease Progression (IGPP) Consortium. Specifically neuropathic Gaucher’s mutations accelerate cognitive decline in Parkinson’s. Ann. Neurol 80, 674–685 (2016). [DOI] [PMC free article] [PubMed] [Google Scholar]
- 14.Gan-Or Z, Amshalom I, Kilarski LL, Bar-Shira A, Gana-Weisz M, Mirelman A, Marder K, Bressman S, Giladi N & Orr-Urtreger A Differential effects of severe vs mild GBA mutations on Parkinson disease. Neurology 84, 880–887 (2015). [DOI] [PMC free article] [PubMed] [Google Scholar]
- 15.Rudenko IN & Cookson MR Heterogeneity of leucine-rich repeat kinase 2 mutations: genetics, mechanisms and therapeutic implications. Neurotherapeutics 11, 738–750 (2014). [DOI] [PMC free article] [PubMed] [Google Scholar]
- 16.Nalls MA, Escott-Price V, Williams NM, Lubbe S, Keller MF, Morris HR, Singleton AB & International Parkinson’s Disease Genomics Consortium (IPDGC). Genetic risk and age in Parkinson’s disease: Continuum not stratum. Mov. Disord 30, 850–854 (2015). [DOI] [PMC free article] [PubMed] [Google Scholar]
- 17.Pihlstrøm L & Toft M Cumulative genetic risk and age at onset in Parkinson’s disease. Mov. Disord 30, 1712–1713 (2015). [DOI] [PubMed] [Google Scholar]
- 18.Pagano G, Ferrara N, Brooks DJ & Pavese N Age at onset and Parkinson disease phenotype. Neurology 86, 1400–1407 (2016). [DOI] [PMC free article] [PubMed] [Google Scholar]
- 19.Diamond SG, Markham CH, Hoehn MM, McDowell FH & Muenter MD Effect of age at onset on progression and mortality in Parkinson’s disease. Neurology 39, 1187–1190 (1989). [DOI] [PubMed] [Google Scholar]
- 20.Chang D, Nalls MA, Hallgrímsdóttir IB, Hunkapiller J, van der Brug M, Cai F, International Parkinson’s Disease Genomics Consortium, 23andMe Research Team, Kerchner GA, Ayalon G, Bingol B, Sheng M, Hinds D, Behrens TW, Singleton AB, Bhangale TR & Graham RR A meta-analysis of genome-wide association studies identifies 17 new Parkinson’s disease risk loci. Nat. Genet 49, 1511–1516 (2017). [DOI] [PMC free article] [PubMed] [Google Scholar]
- 21.Mailman MD, Feolo M, Jin Y, Kimura M, Tryka K, Bagoutdinov R, Hao L, Kiang A, Paschall J, Phan L, Popova N, Pretel S, Ziyabari L, Lee M, Shao Y, Wang ZY, Sirotkin K, Ward M, Kholodov M, Zbicz K, Beck J, Kimelman M, Shevelev S, Preuss D, Yaschenko E, Graeff A, Ostell J & Sherry ST The NCBI dbGaP database of genotypes and phenotypes. Nat. Genet 39, 1181–1186 (2007). [DOI] [PMC free article] [PubMed] [Google Scholar]
- 22.Nalls MA, Bras J, Hernandez DG, Keller MF, Majounie E, Renton AE, Saad M, Jansen I, Guerreiro R, Lubbe S, Plagnol V, Gibbs JR, Schulte C, Pankratz N, Sutherland M, Bertram L, Lill CM, DeStefano AL, Faroud T, Eriksson N, Tung JY, Edsall C, Nichols N, Brooks J, Arepalli S, Pliner H, Letson C, Heutink P, Martinez M, Gasser T, Traynor BJ, Wood N, Hardy J, Singleton AB, International Parkinson’s Disease Genomics Consortium (IPDGC) & Parkinson’s Disease meta-analysis consortium. NeuroX, a fast and efficient genotyping platform for investigation of neurodegenerative diseases. Neurobiol. Aging 36, 1605.e7–12 (2015). [DOI] [PMC free article] [PubMed] [Google Scholar]
- 23.Nalls MA, Pankratz N, Lill CM, Do CB, Hernandez DG, Saad M, DeStefano AL, Kara E, Bras J, Sharma M, Schulte C, Keller MF, Arepalli S, Letson C, Edsall C, Stefansson H, Liu X, Pliner H, Lee JH, Cheng R, International Parkinson’s Disease Genomics Consortium (IPDGC), Parkinson’s Study Group (PSG) Parkinson’s Research: The Organized GENetics Initiative (PROGENI), 23andMe, GenePD, NeuroGenetics Research Consortium (NGRC), Hussman Institute of Human Genomics (HIHG), Ashkenazi Jewish Dataset Investigator, Cohorts for Health and Aging Research in Genetic Epidemiology (CHARGE), North American Brain Expression Consortium (NABEC), United Kingdom Brain Expression Consortium (UKBEC), Greek Parkinson’s Disease Consortium, Alzheimer Genetic Analysis Group, Ikram MA, Ioannidis JPA, Hadjigeorgiou GM, Bis JC, Martinez M, Perlmutter JS, Goate A, Marder K, Fiske B, Sutherland M, Xiromerisiou G, Myers RH, Clark LN, Stefansson K, Hardy JA, Heutink P, Chen H, Wood NW, Houlden H, Payami H, Brice A, Scott WK, Gasser T, Bertram L, Eriksson N, Foroud T & Singleton AB Large-scale meta-analysis of genome-wide association data identifies six new risk loci for Parkinson’s disease. Nat. Genet 46, 989–993 (2014). [DOI] [PMC free article] [PubMed] [Google Scholar]
- 24.Lek M, Karczewski KJ, Minikel EV, Samocha KE, Banks E, Fennell T, O’Donnell-Luria AH, Ware JS, Hill AJ, Cummings BB, Tukiainen T, Birnbaum DP, Kosmicki JA, Duncan LE, Estrada K, Zhao F, Zou J, Pierce-Hoffman E, Berghout J, Cooper DN, Deflaux N, DePristo M, Do R, Flannick J, Fromer M, Gauthier L, Goldstein J, Gupta N, Howrigan D, Kiezun A, Kurki MI, Moonshine AL, Natarajan P, Orozco L, Peloso GM, Poplin R, Rivas MA, Ruano-Rubio V, Rose SA, Ruderfer DM, Shakir K, Stenson PD, Stevens C, Thomas BP, Tiao G, Tusie-Luna MT, Weisburd B, Won H-H, Yu D, Altshuler DM, Ardissino D, Boehnke M, Danesh J, Donnelly S, Elosua R, Florez JC, Gabriel SB, Getz G, Glatt SJ, Hultman CM, Kathiresan S, Laakso M, McCarroll S, McCarthy MI, McGovern D, McPherson R, Neale BM, Palotie A, Purcell SM, Saleheen D, Scharf JM, Sklar P, Sullivan PF, Tuomilehto J, Tsuang MT, Watkins HC, Wilson JG, Daly MJ, MacArthur DG & Exome Aggregation Consortium. Analysis of protein-coding genetic variation in 60,706 humans. Nature 536, 285–291 (2016). [DOI] [PMC free article] [PubMed] [Google Scholar]
- 25.Goetz CG, Stebbins GT & Tilley BC Calibration of unified Parkinson’s disease rating scale scores to Movement Disorder Society-unified Parkinson’s disease rating scale scores. Mov. Disord 27, 1239–1242 (2012). [DOI] [PubMed] [Google Scholar]
- 26.Holden SK, Finseth T, Sillau SH & Berman BD Progression of MDS-UPDRS Scores Over Five Years in De Novo Parkinson Disease from the Parkinson’s Progression Markers Initiative Cohort. Mov Disord Clin Pract 5, 47–53 (2018). [DOI] [PMC free article] [PubMed] [Google Scholar]
- 27.Sidransky E & Lopez G The link between the GBA gene and parkinsonism. Lancet Neurol. 11, 986–998 (2012). [DOI] [PMC free article] [PubMed] [Google Scholar]
- 28.Berge-Seidl V, Pihlstrøm L, Maple-Grødem J, Forsgren L, Linder J, Larsen JP, Tysnes O-B & Toft M The GBA variant E326K is associated with Parkinson’s disease and explains a genome-wide association signal. Neurosci. Lett 658, 48–52 (2017). [DOI] [PubMed] [Google Scholar]
- 29.Barkhuizen M, Anderson DG, van der Westhuizen FH & Grobler AF A molecular analysis of the GBA gene in Caucasian South Africans with Parkinson’s disease. Mol Genet Genomic Med 5, 147–156 (2017). [DOI] [PMC free article] [PubMed] [Google Scholar]
- 30.Mallett V, Ross JP, Alcalay RN, Ambalavanan A, Sidransky E, Dion PA, Rouleau GA & Gan-Or Z GBA p.T369M substitution in Parkinson disease: Polymorphism or association? A meta-analysis. Neurol Genet 2, e104 (2016). [DOI] [PMC free article] [PubMed] [Google Scholar]
- 31.R Core Team. R: A Language and Environment for Statistical Computing. (2013). at <http://www.R-project.org/>
- 32.Stone DJ, Molony C, Suver C, Schadt EE & Potter WZ ApoE genotyping as a progression-rate biomarker in phase II disease-modification trials for Alzheimer’s disease. Pharmacogenomics J. 10, 161–164 (2010). [DOI] [PubMed] [Google Scholar]
- 33.Cole SR, Platt RW, Schisterman EF, Chu H, Westreich D, Richardson D & Poole C Illustrating bias due to conditioning on a collider. Int. J. Epidemiol 39, 417–420 (2010). [DOI] [PMC free article] [PubMed] [Google Scholar]
- 34.Saunders-Pullman R, Mirelman A, Alcalay RN, Wang C, Ortega RA, Raymond D, Mejia-Santana H, Orbe-Reilly M, Johannes BA, Thaler A, Ozelius L, Orr-Urtreger A, Marder KS, Giladi N, Bressman SB & LRRK2 Ashkenazi Jewish Consortium. Progression in the LRRK2-Asssociated Parkinson Disease Population. JAMA Neurol. 75, 312–319 (2018). [DOI] [PMC free article] [PubMed] [Google Scholar]
Associated Data
This section collects any data citations, data availability statements, or supplementary materials included in this article.