

Abstract
Background
Data are limited on the association of mildly reduced estimated glomerular filtration rate (eGFR 60–89 mL/min per 1.73 m2) with cardiovascular disease (CVD) in the community.
Methods and Results
We evaluated 3066 Framingham Offspring Study participants (55% women, mean age 58 years), without clinical CVD. Using multivariable regression, we related categories of mildly reduced eGFR (80–89, 70–79, or 60–69 versus ≥90 mL/min per 1.73 m2 [referent]) to prevalent coronary artery calcium, carotid intima media thickness, and left ventricular hypertrophy, and to circulating concentrations of cardiac stress biomarkers. We related eGFR categories to CVD incidence and to progression to ≥Stage 3 chronic kidney disease (eGFR <60 mL/min per 1.73 m2) using Cox regression. Individuals with eGFR 60–69 mL/min per 1.73 m2 (n=320) had higher coronary artery calcium score (odds ratio 1.69; 95% CI 1.02–2.80) compared with the referent group. Individuals with eGFR 60–69 and 70–79 mL/min per 1.73 m2 had higher blood growth differentiating factor‐15 concentrations (β=0.131 and 0.058 per unit‐increase in log‐biomarker, respectively). Participants with eGFR 60–69 and 80–89 mL/min per 1.73 m2 had higher blood B‐type natriuretic peptide concentrations (β=0.119 and 0.116, respectively). On follow‐up (median 16 years; 691 incident CVD and 252 chronic kidney disease events), individuals with eGFR 60–69 and 70–79 mL/min per 1.73 m2 experienced higher CVD incidence (hazard ratio [HR], 1.40; 95% CI, 1.02–1.93 and 1.45, 95% CI, 1.05–2.00, respectively, versus referent). Participants with eGFR 60–69 mL/min per 1.73 m2 experienced higher chronic kidney disease incidence (HR, 2.94; 95% CI, 1.80–4.78 versus referent).
Conclusions
Individuals with mildly reduced eGFR 60–69 mL/min per 1.73 m2 have a higher burden of subclinical atherosclerosis cross‐sectionally, and a greater risk of CVD and chronic kidney disease progression prospectively. Additional studies are warranted to confirm our findings.
Keywords: biomarkers, cardiovascular disease, glomerular filtration rate, mild kidney disease, subclinical disease
Subject Categories: Cardiovascular Disease, Epidemiology, Risk Factors
Nonstandard Abbreviations and Acronyms
- CIMT
carotid intima media thickness
- FHS
Framingham Heart Study
- GDF−15
growth differentiating factor‐15
Clinical Perspective
What Is New?
Individuals with mildly reduced estimated glomerular filtration rate 60–69 mL/min per 1.73 m2 have a higher burden of subclinical atherosclerosis cross‐sectionally, and a greater risk of cardiovascular disease and chronic kidney disease progression prospectively.
The pathophysiology of the observed associations between estimated glomerular filtration rate and cardiovascular disease is perhaps mediated via early cardiac remodeling and coronary artery calcification.
What Are the Clinical Implications?
Our findings should alert clinicians to closely monitor people with mildly reduced estimated glomerular filtration rate with an emphasis on renal‐ and cardiovascular disease–protective measures.
It is well established that advanced chronic kidney disease (CKD) is an important risk factor for cardiovascular disease (CVD) and mortality.1 It has also been shown that estimated glomerular filtration rate (eGFR) of <60 mL/min per 1.73 m2 is a risk factor for CVD even in the absence of albuminuria.2 However, the clinical relevance of mildly reduced eGFR (ie, eGFR in the range 60 to 89 mL/min per 1.73 m2), and its associations with the risk of CVD have not been well defined. Prior studies that have explored the relations between mildly reduced eGFR and the risk of clinical and subclinical CVD have not yielded consistent results.3, 4, 5, 6, 7, 8 Furthermore, some older studies have been limited because of the use of serum creatinine concentration rather than eGFR as a measure of kidney function.6, 7
The prevalence of mildly reduced eGFR in the general population ranges from 43% to 51%.9, 10 Investigators have also reported higher prevalence of CVD risk factors, including hypertension, diabetes mellitus, obesity, and dyslipidemia, among individuals with a mildly reduced eGFR.7, 11 Few studies have reported on the associations between lower eGFR and markers of subclinical CVD. These prior studies focused on highly selected patient populations who had a higher baseline CVD risk, or were conducted in those with pre‐existing CVD.12, 13 For instance, lower eGFR values were associated with a higher odds of left ventricular hypertrophy (LVH) among people with hypertension7 and diabetes mellitus.14 Mildly reduced eGFR was also associated with higher odds of aortic stiffness in patients who underwent cardiac catheterization for the evaluation of coronary artery disease.12 These associations were largely explained by the presence of traditional CVD risk factors in the study populations.7, 13, 15
To help address some of the existing gaps in current knowledge, we examined the associations between mildly reduced eGFR and markers of subclinical CVD and incidence of clinical CVD among community‐based participants of the FHS (Framingham Heart Study).16, 17
We hypothesized that mildly reduced eGFR (defined as 60–89 mL/min per 1.73 m2) is associated with higher odds of subclinical CVD, higher circulating concentrations of cardiac stress biomarkers, and with higher risk of clinical CVD compared with the group with normal eGFR (defined as ≥90 mL/min per 1.73 m2).
Methods
The data that support the findings of this study are available from the corresponding author upon reasonable request.
Study Sample
We included participants from the FHS Offspring cohort. Details of the design and selection criteria of this FHS cohort have been described elsewhere.16 All FHS participants provided written informed consent, and the Boston University Medical Center Institutional Review Board approved this investigation.16
Study Sample for Describing the Prevalence of Mildly Reduced eGFR and Its Natural Progression to CKD
Offspring Study participants who had a first eGFR measurement at examination cycles 2, 5, 6, 7, or 8 were eligible for the present investigation (n=4480). We excluded participants with advanced kidney disease defined as an eGFR <60 mL/min per 1.73 m2 at their first measurement (n=641), those with prevalent CVD (n=164) or unavailable data on eGFR at a subsequent examination to assess progression (n=419), resulting in a sample of 3256 participants, of whom 2135 had mildly reduced eGFR at the first measurement (Sample 1) (Figure 1).
Figure 1. Flow chart of study sample for different aims of the analyses.

CAC indicates coronary artery calcium score; CIMT, carotid intima‐media thickness; CKD, chronic kidney disease; CVD, cardiovascular disease; eGFR, estimated glomerular filtration rate in mL/min per 1.73 m2; and LVH, left ventricular hypertrophy.
Study Sample for Evaluating the Association Between Mildly Reduced eGFR and Incident CVD and CKD
Analyses of incident CVD included participants from the FHS Offspring cohort who attended examination cycle 6 (n=3532), which served as the baseline for these analyses. We excluded participants who had a missing serum creatinine measurement at baseline (n=80) or had prevalent CVD (n=386), resulting in a sample size of 3066 (Sample 2). Analyses of incident CKD included participants with prevalent CVD but excluded participants with prevalent CKD at baseline (n=986) and those without an eGFR measurement at follow‐up at examination cycles 7, 8, or 9 (n=154), resulting in a sample size of n=2312 (Sample 3) for these analyses (Figure 1).
Study Sample for Cross‐Sectional Associations Between Mildly Reduced eGFR and Indices of Subclinical CVD
For the analysis of association between mildly reduced eGFR and subclinical disease components, we further excluded participants from Sample 1 who did not have any of the following at examination cycle 8: a coronary artery calcium (CAC) score (n=1872), carotid intima‐media thickness (CIMT) (n=93), or measurement of left ventricular hypertrophy (LVH) (n=722). These exclusions resulted in final sample sizes of 1194 (Sample 4, CAC), 2973 (Sample 5, CIMT), and 2344 (Sample 6, LVH) for analyses relating eGFR category to subclinical disease measures (Figure 1).
Exposures and Covariates
Kidney function was assessed using the creatinine‐based CKD‐EPI equation for eGFR. Serum creatinine was measured using the modified Jaffe method (interassay coefficient of variation=2.8%, intra‐assay coefficient of variation=4%). Categories of mildly reduced kidney function, defined as eGFR 60–69, 70–79, and 80–89 mL/min per 1.73 m2, and normal kidney function defined as an eGFR ≥90 mL/min per 1.73 m2, were the primary exposures for this investigation. We used the following covariates for this investigation: age, sex, body mass index, systolic blood pressure, antihypertensive medication use, diabetes mellitus, current smoking, and total cholesterol/HDL (high‐density lipoprotein) cholesterol ratio. Brachial blood pressure was measured using a standard mercury column sphygmomanometer and a cuff of appropriate size. The average of the 2 physician‐obtained measurements on the right arm of the seated participants was used as the examination blood pressure. Hypertension was defined as systolic blood pressure ≥140 mm Hg, or a diastolic blood pressure ≥90 mm Hg, or use of self‐reported antihypertensive medication use.18, 19
Circulating total cholesterol and HDL‐cholesterol concentrations were assayed using fasting blood samples. Diabetes mellitus was defined as having a fasting blood glucose of ≥126 mg/dL (7 mmol/L) or being treated with insulin and/or any oral hypoglycemic medications. Current smoking status was defined as smoking at least 1 cigarette a day for the year preceding the FHS examination. Body mass index was calculated as weight in kilograms divided by height in meters squared (kg/m2).20
Measurement of Blood Biomarkers
Blood samples were drawn from the antecubital vein of participants usually between 8 and 9 am after overnight fasting, and samples were aliquoted and stored at −80°C until the time of assay. We used the following biomarkers for this investigation: B‐type natriuretic peptide (BNP) and growth differentiation factor‐15 (GDF‐15) (representing myocardial stress), high‐sensitivity cardiac troponin I (representing injury), and soluble suppressor of tumorigenicity 2 (ST2) (representing fibrosis and inflammation).21
Outcomes of Interest
We evaluated the following components of subclinical disease (in relation to eGFR categories): LVH, coronary artery calcium (CAC), and carotid intima‐media thickness (CIMT).
Left ventricular mass was assessed using transthoracic echocardiography. LVH was defined based on the American Society of Echocardiography criteria, as LV mass indexed to body surface area exceeding the sex‐specific reference limits (binary; >95 g/m2 for women and >115 g/m2 for men).22, 23 CAC was measured using electron beam computerized tomography and presence of CAC was defined as having an Agatston score >0 (binary). CIMT was measured using carotid ultrasound, and increased CIMT was defined as CIMT >1 mm or the presence of carotid stenosis >25% (binary).22, 24
Our prospective outcomes of interest were the incidence of CVD and CKD. CVD was assessed according to previously defined protocols and included the presence of any of the following: myocardial infarction, angina pectoris, coronary insufficiency, transient ischemic attack, ischemic or hemorrhagic cerebrovascular accident, intermittent claudication, and congestive heart failure, or CVD‐related death.21, 25 Medical history, physical examination, and medical record data were reviewed for adjudication of all CVD events by a review committee that included at least 2 FHS physicians.21, 25 Incident CKD was defined as an eGFR <60 mL/min per 1.73 m2 on follow‐up.16
Statistical Analysis
To assess the prevalence of mildly reduced eGFR and progression to CKD, we categorized the first eGFR measurement into normal (eGFR ≥90 mL/min per 1.73 m2) or mildly reduced (eGFR 60–89 mL/min per 1.73 m2), and examined subsequent eGFR measurements to determine whether the participant’s eGFR was reduced to <60 mL/min per 1.73 m2. Among those whose first eGFR was mildly reduced, we compared clinical characteristics between those who did and did not progress to CKD on follow‐up.
We used multivariable logistic regression to assess the cross‐sectional associations of mildly reduced eGFR (independent variable) with the prevalence of CAC, increased CIMT, and LVH (binary dependent variables, separate models for each). We used multivariable linear regression to assess the cross‐sectional associations of mildly reduced eGFR (independent variable) with log‐transformed blood GDF‐15, BNP, suppressor of tumorigenicity 2, and troponin I concentrations (continuous dependent variables; separate models for each). We first estimated age (<50 years versus ≥50 years) and sex‐adjusted models, and then a multivariable‐adjusted model that additionally adjusted for body mass index, systolic blood pressure, antihypertensive medication use, diabetes mellitus, current smoking, and total cholesterol/HDL cholesterol ratio.
We used Cox proportional hazards regression stratifying the baseline hazards by age (<50 years versus ≥50 years) to relate mildly reduced eGFR at baseline (independent variables) to incident CVD. We also used Cox proportional hazards stratifying the baseline hazards by prevalent CVD status to relate mildly reduced eGFR to the risk of CKD on follow‐up at examination cycles 7, 8, and 9 using discrete time intervals. We first performed a minimally adjusted model including age (<50 years versus ≥50 years) and sex. The multivariable‐adjusted model additionally included body mass index, systolic blood pressure, antihypertensive medication use, diabetes mellitus, current smoking, and total cholesterol/HDL cholesterol ratio. The proportional hazards assumption was met for all prospective analyses. In each model, we used categories of eGFR 80–89, 70–79, and 60–69 mL/min per 1.73 m2 as the primary multicategory exposures and compared them with eGFR ≥90 mL/min per 1.73 m2 (reference group).
We performed sensitivity analyses for models assessing risk of CVD, restricting the sample to participants with available data on urine albumin and creatinine (n=2638). We defined microalbuminuria as having a urine albumin to creatinine ratio ≥25 mg/g for men and ≥35 mg/g for women mg/g.26, 27 We compared our main results with results of these sensitivity analyses that excluded 263 individuals with prevalent microalbuminuria at baseline.
Results
Baseline characteristics of the samples used for cross‐sectional and prospective analyses are shown in Table 1. At baseline examination cycle 6, 62% of participants had a mildly reduced eGFR (60–89 mL/min per 1.73 m2), 11% had eGFR ≥90 mL/min per 1.73 m2, and 26% had eGFR <60 mL/min per 1.73 m2.
Table 1.
Baseline Characteristics of Study Sample by eGFR Category
| Characteristic | eGFR Category, mL/min per 1.73 m2 | P Value | ||||
|---|---|---|---|---|---|---|
| ≥90 | 80–89 | 70–79 | 60–69 | <60 | ||
| N=344 | N=440 | N=683 | N=793 | N=806 | ||
| Age, y | 51.1±7.4 | 53.02±7.9 | 54.7±7.9 | 58.7±8.5 | 65.3±8.5 | <0.001 |
| Women, n (%) | 156 (45) | 194 (44) | 344 (50) | 449 (57) | 546 (68) | <0.001 |
| Body mass index, kg/m2 | 28.4±5.4 | 28.2±5.6 | 27.7±5.0 | 27.6±5.0 | 27.7±5.0 | 0.056 |
| Systolic blood pressure, mm Hg | 124±18 | 125±17 | 126±18 | 128±18 | 133±20 | <0.001 |
| Diastolic blood pressure, mm Hg | 76±10 | 76±10 | 76±9 | 76±9 | 75±10 | 0.066 |
| Antihypertensive medication, n (%) | 53 (15) | 73 (17) | 130 (19) | 186 (24) | 303 (38) | <0.001 |
| Hypertension, n (%) | 99 (29) | 127 (29) | 223 (33) | 299 (38) | 419 (52) | <0.001 |
| Total cholesterol/HDL cholesterol ratio | 4.9±1.9 | 4.4±1.7 | 4.3±1.5 | 4.2±1.3 | 4.2±1.4 | <0.001 |
| Current smoking, n (%) | 85 (25) | 100 (23) | 103 (15) | 88 (11) | 80 (10) | <0.001 |
| Diabetes mellitus, n (%) | 36 (1) | 32 (7) | 45 (7) | 54 (7) | 76 (9) | 0.066 |
| Subclinical disease components | ||||||
| Coronary artery calcium, Agatston score | 25 (0, 133) | 7 (0, 113) | 17 (0, 167) | 47 (0, 236) | 71 (0, 386) | <0.001 |
| Coronary artery calcium >0, n (%) | 44 (29) | 53 (26) | 90 (31) | 125 (39) | 108 (47) | <0.001 |
| Carotid IMT, mm | 0.63±0.36 | 0.63±0.30 | 0.6±0.31 | 0.62±0.30 | 0.72±0.41 | <0.001 |
| Left ventricular hypertrophy, n (%) | 25 (9) | 38 (11) | 63 (12) | 91 (15) | 122 (21) | <0.001 |
| Left ventricular mass indexed to body surface area | 83 (73, 95) | 84 (74, 94) | 83 (73, 96) | 82 (71, 96) | 84 (74, 98) | 0.194 |
| Biomarkers | ||||||
| B‐type natriuretic peptide, pg/mL | 5.1 (4.0, 9.7) | 6.2 (4.0, 14.5) | 6.1 (4.0, 14.0) | 7.7 (4.0, 16.5) | 12 (5.1, 24.2) | <0.001 |
| Growth differentiation factor‐15, ng/L | 849 (698, 1075) | 903 (715, 1113) | 910 (749, 1139) | 1009 (833, 1264) | 1286 (996, 1647) | <0.001 |
| High‐sensitivity cardiac troponin I, pg/mL | 1.2 (0.8, 2.0) | 1.2 (0.8, 1.8) | 1.2 (0.8, 2.0) | 1.3 (0.9, 2.1) | 1.5 (0.9, 2.4) | <0.001 |
| Soluble ST2, ng/mL | 21.3 (17.0, 26.3) | 20.9 (16.3, 26.0) | 19.9 (16.1, 24.8) | 20.4 (16.2, 25.9) | 20.9 (16.9, 25.8) | 0.074 |
| eGFR, mL/min per 1.73 m2 | 100±10 | 85±3 | 75±3 | 65±3 | 51±7 | <0.001 |
Data are presented as mean±SD or median (Q1, Q3), unless otherwise noted. Carotid IMT indicates carotid intima‐media thickness; eGFR, estimated glomerular filtration rate; HDL, high‐density lipoprotein; and ST2, suppressor of tumorigenicity 2.
Characteristics of Mildly Reduced eGFR and Progression to CKD
Baseline characteristics of participants who progress to CKD are shown in Table 2. About 27% of participants with mildly reduced eGFR progressed to CKD (eGFR <60 mL/min per 1.73 m2) over a mean follow‐up period of 15.2 years. Participants who progressed to CKD were older, more likely to be women, had a higher baseline systolic blood pressure and lower baseline eGFR, and were more likely to use antihypertensive and lipid‐lowering medications. These who progressed to CKD were also less likely to be current smokers.
Table 2.
Baseline Characteristics of Mildly Reduced eGFR Group by Subsequent CKD Status (n=2135)
| Characteristic | Progressed to CKD (eGFR<60 mL/min per 1.73 m2) | ||
|---|---|---|---|
| No | Yes | P Value | |
| N=1563 | N=572 | ||
| Age, y | 64±10 | 74±8 | <0.001 |
| Women, n (%) | 758 (48) | 356 (62) | <0.001 |
| Body mass index, kg/m2 | 28.1±5.2 | 28.1±5.1 | 0.804 |
| Systolic blood pressure, mm Hg | 128±18 | 132±19 | <0.001 |
| Diastolic blood pressure, mm Hg | 75±10 | 71±11 | 0.012 |
| Total cholesterol/HDL cholesterol ratio | 3.8±1.5 | 3.6±1.3 | 0.005 |
| Current smoking, n (%) | 234 (15) | 35 (8) | <0.001 |
| Diabetes mellitus, n (%) | 194 (12) | 86 (15) | 0.119 |
| Antihypertensive medication, n (%) | 630 (40) | 329 (58) | <0.001 |
| Lipid‐lowering medication, n (%) | 490 (31) | 223 (39) | 0.001 |
| First eGFR measurement, mL/min per 1.73 m2 | 75.1±8.2 | 72.2±8.2 | <0.001 |
CKD indicates chronic kidney disease; eGFR, estimated glomerular filtration rate; and HDL, high‐density lipoprotein.
Relations of Mildly Reduced eGFR With Components of Subclinical CVD
Individuals with eGFR 60 to 69 mL/min per 1.73 m2 had higher odds of having CAC >0 compared with individuals with eGFR ≥90 mL/min per 1.73 m2. We did not observe statistically significant associations of mildly reduced eGFR categories with the odds of high CIMT or prevalent LVH (Table 3). As a sensitivity analysis, we further included duration of follow‐up as an adjustment variable in addition to baseline age, and results were similar to the original findings (data not shown).
Table 3.
Association of Mildly Reduced eGFR With Subclinical Cardiovascular Disease
| Subclinical Disease Trait | eGFR Category (mL/min per 1.73 m2) | ||||||||
|---|---|---|---|---|---|---|---|---|---|
| ≥90 | 80–89 | 70–79 | 60–69 | <60 | |||||
|
Odds Ratio (95% CI) |
P Value |
Odds Ratio (95% CI) |
P Value |
Odds Ratio (95% CI) |
P Value |
Odds Ratio (95% CI) |
P Value | ||
| Coronary artery calcium (binary) | Referent | 0.88 (0.51–1.52) | 0.65 | 1.23 (0.74–2.03) | 0.43 | 1.69 (1.02–2.80) | 0.040 | 2.47 (1.45–4.23) | 0.001 |
| Carotid intima media thickness (binary) | Referent | 1.09 (0.64–1.85) | 0.74 | 0.92 (0.55–1.53) | 0.74 | 1.13 (0.69–1.85) | 0.62 | 2.03 (1.26–3.28) | 0.004 |
| Left ventricular hypertrophy (binary) | Referent | 1.18 (0.68–2.04) | 0.56 | 1.16 (0.69–1.92) | 0.58 | 1.41 (0.86–2.32) | 0.17 | 1.53 (0.93–2.51) | 0.09 |
Models were adjusted for: age (<50 vs ≥50 years), sex, body mass index, systolic blood pressure, hypertension treatment, current smoking, diabetes mellitus status, and total cholesterol/high‐density lipoprotein ratio. eGFR indicates estimated glomerular filtration rate.
Relations of Mildly Reduced eGFR and Circulating Biomarkers of Cardiac Stress
We observed higher blood GDF‐15 concentrations among individuals with eGFR 60 to 69 and 70–79 mL/min per 1.73 m2 compared with those with eGFR ≥90 mL/min per 1.73 m2. We also observed higher levels of BNP for individuals with eGFR 60 to 69, and 80 to 89 mL/min per 1.73 m2 compared with those with eGFR ≥90 mL/min per 1.73 m2. We did not observe any statistically significant associations between mildly reduced eGFR and blood suppressor of tumorigenicity 2 or troponin concentrations (Table 4).
Table 4.
Association of Mildly Reduced eGFR With Biomarkers of Cardiovascular Disease
| Biomarker (log‐transformed) | eGFR Category (mL/min per 1.73 m2) | ||||||||
|---|---|---|---|---|---|---|---|---|---|
| ≥90 | 80–89 | 70–79 | 60–69 | <60 | |||||
| Beta (SE) | P Value | Beta (SE) | P Value | Beta (SE) | P Value | Beta (SE) | P Value | ||
| BNP | Referent | 0.116 (0.058) | 0.043 | 0.060 (0.053) | 0.27 | 0.119 (0.053) | 0.026 | 0.344 (0.055) | <0.001 |
| GDF‐15 | Referent | 0.040 (0.022) | 0.09 | 0.058 (0.022) | 0.01 | 0.131 (0.022) | <0.001 | 0.325 (0.023) | <0.001 |
| ST2 | Referent | −0.013 (0.024) | 0.60 | −0.040 (0.022) | 0.07 | −0.015 (0.022) | 0.51 | 0.018 (0.023) | 0.42 |
| Troponin I | Referent | −0.085 (0.053) | 0.11 | −0.060 (0.049) | 0.22 | 0.045 (0.049) | 0.36 | 0.103 (0.051) | 0.041 |
Models were adjusted for age (<50 vs ≥50 years), sex, body mass index, systolic blood pressure, hypertension treatment, current smoking, diabetes mellitus status, and total cholesterol/high‐density lipoprotein ratio.
Betas represent the change in log‐transformed biomarker compared with the reference group of eGFR ≥90. BNP indicates B‐type natriuretic peptide; eGFR, estimated glomerular filtration rate; GDF‐15, growth differentiating factor‐15; and ST2, suppressor of tumorigenicity 2.
Association Between Mildly Reduced eGFR and Incident CVD
During a mean follow‐up of 15.5 years (median=17.9 years; range, 0.001–22.5 years), we observed 691 new‐onset CVD events. Participants with mildly reduced eGFR in the range of 60 to 69 and 70 to 79 mL/min per 1.73 m2 had a higher risk of CVD compared with those with eGFR ≥90 mL/min per 1.73 m2 (Figure 2A). In our sensitivity analysis restricting to participants with available data on urine albumin and creatinine, the association between mildly reduced eGFR and risk of CVD was slightly attenuated among individuals with eGFR 60 to 69 mL/min per 1.73 m2 compared with the full sample. After excluding those with prevalent microalbuminuria at baseline, participants with mildly reduced eGFR 70 to 79 mL/min per 1.73 m2 had higher risk of CVD compared with those with eGFR ≥90 mL/min per 1.73 m2, but the associations were not statistically significant for people in the eGFR 60 to 69 mL/min per 1.73 m2 category (Table S1).
Figure 2. Association of mildly reduced eGFR categories with (A) CVD and (B) CKD.
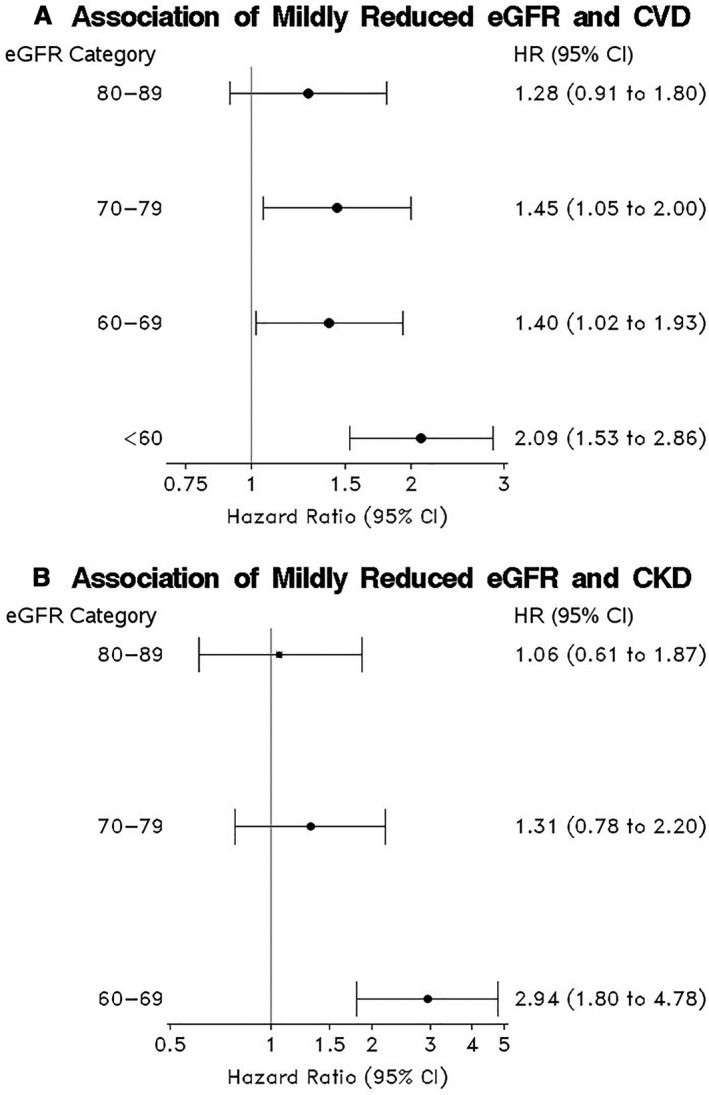
A, The model used different baseline hazards by age (<50 vs. ≥50 years) and adjusted for sex, body mass index, systolic blood pressure, antihypertensive treatment, current smoking, diabetes mellitus status, and total cholesterol/HDL ratio. B, The model used different baseline hazards based on prevalent CVD and adjusted for age (<50 vs. ≥50 years), sex, body mass index, systolic blood pressure, antihypertensive treatment, current smoking, diabetes mellitus status, and total cholesterol/HDL ratio. CKD indicates chronic kidney disease; CVD, cardiovascular disease; eGFR, estimated glomerular filtration rate in mL/min per 1.73 m2; HDL, high‐density lipoprotein; and HR, hazard ratio.
Association Between Mildly Reduced eGFR and Incident CKD (eGFR <60 mL/min/1.73 m2)
During a mean follow‐up of 12.8 years (median=14.7 years; range=1.2–18.6 years), 252 people progressed to CKD. Participants with eGFR in the range of 60 to 69 mL/min per 1.73 m2 were at a higher risk of CKD compared with those with eGFR ≥90 mL/min per 1.73 m2 (Figure 2B).
We also performed sensitivity analyses additionally adjusting for microalbuminuria and observed similar results (data not shown).
We further adjusted models for lipid‐lowering medications, CRP (C‐reactive protein), and proteinuria (microalbuminuria) and we observed similar results for most models compared with findings in original models (Tables S2, S3, and S4).
Finally, we performed sensitivity analyses additionally adjusting only for microalbuminuria in models evaluating associations of eGFR categories with subclinical disease indices and biomarkers and observed similar results in most models, with the exception that the association of eGFR 60 to 69 mL/min per 1.73 m2 with CAC and BNP is no longer statistically significant (Tables S5 and S6).
Discussion
Principal Findings
In our community‐based investigation involving >3000 FHS participants, we observed a high prevalence (≈62%) of mildly reduced eGFR (60–89 mL/min per 1.73 m2). Participants with eGFR 60 to 69 mL/min per 1.73 m2 had higher odds of prevalent CAC compared with those with an eGFR >90 mL/min per 1.73 m2, but we did not observe an association of CAC with those with eGFR 70 to 89 mL/min per 1.73 m2. We also observed a positive association between eGFR 60 to 79 mL/min per 1.73 m2 and concentrations of serum GDF‐15, but we did not observe such an association for the group with eGFR 80 to 89 mL/min per 1.73 m2. Only eGFR categories 60 to 69 and 80 to 89 mL/min per 1.73 m2 had a statistically significant association with higher concentration of BNP compared with those with eGFR >90 mL/min per 1.73 m2. On the other hand, we did not observe any association of mildly reduced eGFR with CIMT or LVH, or with blood concentrations of 2 other biomarkers of myocardial stress or injury (ie, suppressor of tumorigenicity 2 and troponin).
We observed an association between mildly reduced eGFR in the range of 60 to 79 mL/min per 1.73 m2 and the risk of CVD on follow‐up. Additionally, we observed that mildly reduced eGFR 60 to 69 mL/min per 1.73 m2 was associated with a 3 times higher risk of progression to stage 3 or more advanced CKD. The association between eGFR 70 to 89 mL/min per 1.73 m2 and CKD stage 3 was not statistically significant.
Comparison With the Literature
We observed a higher prevalence of mildly reduced eGFR (62%) compared with other investigations including population‐based samples.9, 10 The SardiNIA study cohort, which was a representative sample of the regional population in Ogliastra, had a mildly reduced eGFR prevalence of 43%. The National Health and Nutrition Examination Surveys (NHANES), a nationally representative sample of noninstitutionalized adults aged 20 years between 1999 and 2004, showed that the prevalence of mildly reduced eGFR was 52.1%.10 The observed higher prevalence of mildly reduced eGFR in our investigation is likely because our sample included older participants with an average age of 58 years compared with 43 years in the SardiNIA study cohort, and 46.2 years in the National Health and Nutrition Examination Surveys study.9, 10
A number of epidemiological studies on the association of mildly reduced eGFR with incident CVD have reported conflicting findings.1, 3, 4, 5, 6, 7, 8 While some of these investigations were based on high‐risk populations, such as individuals with hypertension or diabetes mellitus, there were some that evaluated community‐based samples. For example, Rahman et al, using data on 40 154 participants with hypertension, observed that a decrease in eGFR of 10 mL/min per 1.73 m2 (in the eGFR range of 60 to 70 mL/min per 1.73 m2) was associated with a 6% higher risk of CVD.7 Similarly, the ARIC (Atherosclerosis Risk in Communities) study reported that mildly reduced eGFR in the range 60 to 89 mL/min per 1.73 m2 was associated with significantly higher CVD risk.4, 5 However, a large‐scale prospective study based in Reykjavik did not observe an association between eGFR in the range of 60 to 90 mL/min per 1.73 m2 and risk of coronary heart disease.3 Moreover, the investigators using data from the National Health and Nutrition Examination Survey I did not observe an association between mildly reduced eGFR and risk of CVD.8 Using FHS data, Culleton et al reported no association between mild renal insufficiency (defined as serum creatinine 1.5–3.0 mg/dL in men and 1.4–3.0 mg/dL in women) and incident CVD; however, the sample size was small (≈500 individuals with mild renal insufficiency) and they used a different definition of mild CKD based on serum creatinine only.6
We addressed some of the limitations of prior reports in our current investigation such as the following: (1) lack of accounting for confounders, for instance in the report by Rahman et al7; and (2) less standardized estimates of kidney function, such as in the report by Culleton et al.6
In our investigation, we used accepted metrics of kidney function, and evaluated multiple subclinical and clinical CVD outcomes. We observed an association between mildly reduced eGFR and incident CVD adjusting for standard CVD risk factors. Previous similar research studies suggested that the increased CVD risk that is observed among individuals in mildly reduced renal function is because of the co‐occurrence of CKD and CVD risk factors.6, 8, 28, 29 The persistent association after adjustment for major CVD risk factors may reflect an incremental impact of renal function on CVD risk.
In our investigation, we also observed that participants with mildly reduced eGFR were more likely to develop CKD during follow‐up. With normal aging, there is a slow decline in eGFR.30 However, even after we adjusted for age and other known confounders, the relations between mildly reduced eGFR and CKD incidence persisted. Our finding may indicate that individuals with mildly reduced eGFR are vulnerable to a faster decline in eGFR and the development of CKD, emphasizing the need for early renal protective measures.
Previous Reports on Association of Mildly Reduced eGFR With Subclinical CVD or Biomarkers of Myocardial Strain, Fibrosis, and Injury
Our investigation extended the previous reports on mildly reduced eGFR and CVD risk by including combined CVD outcomes, markers of subclinical CVD, and biomarkers of myocardial strain, fibrosis, and injury. The observed positive association between mildly reduced eGFR and the odds of CAC may complement and explain the findings of previous investigations showing that increased coronary calcification correlates with CVD events in patients with CKD.31 In the current investigation we observed that coronary calcification increases even in the mildly reduced eGFR range.
Our finding of no association between mildly reduced eGFR and CIMT is consistent with a previous report, suggesting that the impact of low eGFR on CVD is mediated via coronary atherosclerosis rather than through carotid atherosclerosis.32 In addition, there have been criticisms of the use of CIMT to detect atherosclerosis in the carotid artery, because atherosclerosis is an intimal process, while CIMT measures the medial thickness, and the latter is more likely to be affected by hypertension.32
Studies on mildly reduced eGFR and LVH have reported mixed results. A previous FHS investigation by Culleton et al has shown an increase in incidence of ECG‐LVH in patients with mild CKD.6 Our finding differed from the previous FHS report in that we evaluated mildly reduced eGFR as opposed to more advanced CKD that was assessed in the previous report. A report by Rahman et al also showed that modest reductions in eGFR (less than ≈70 mL/min per 1.73 m2) are associated with a significant increase in the risk of LVH.7 However, the study by Rahman et al assessed participants with hypertension, not representative of the general population.7 Since LVH is strongly influenced by hypertension, adjusting for hypertension treatment in our investigation may have attenuated potential associations.
We also observed that participants with mildly reduced eGFR 60 to 79 and 60 to 69 mL/min per 1.73 m2 had higher concentrations of certain markers of myocardial strain or injury as seen by higher serum GDF‐15 and BNP levels, respectively. However, we did not find statistically significant associations of mildly reduced eGFR with blood concentrations of suppressor of tumorigenicity 2 and troponin. We are not aware of other investigations that have evaluated the relations between mildly reduced eGFR and circulating biomarkers in community‐dwelling individuals. Based on previous studies, circulating GDF‐15, BNP, and troponin concentrations are associated with CVD risk.33 Prior studies have also shown that GDF‐15 is related to higher arterial stiffness in central and medium‐sized arteries and higher CAC scores.34, 35 Additionally, blood GDF‐15 concentrations were associated with higher CAC scores in the Dallas Heart Study.35
Strengths and Limitations
The strengths of our investigation include the large population‐based sample, the use of eGFR as a measure of renal function, assessment of subclinical CVD as well as an array of biomarkers of myocardial strain, fibrosis, and calcification injury. We also assessed the impact of microalbuminuria on the association of mildly reduced eGFR with CVD risk. Furthermore, we adjusted for use of antihypertensive medications, diabetes mellitus, age, and other factors that are known to be associated with microalbuminuria.36 We performed a sensitivity analysis of the association between eGFR and CVD among individuals without microalbuminuria, and observed that the associations were not statistically significant for all categories of mildly reduced eGFR, possibly because of reduced statistical power resulting from the smaller sample size. We have extended prior findings by investigating the relation of mildly reduced eGFR with subclinical CVD as well as with biomarkers of myocardial strain, injury, and fibrosis; to our knowledge, the latter associations have not been evaluated before in the community.
Some limitations merit consideration. First, we studied mostly White participants, and, therefore, our findings may not be generalizable to other racial groups. Given that previous studies have reported that Black race may be an effect modifier of the association between mildly reduced eGFR and CVD5, it is possible that our investigation may have underestimated the magnitude of the associations evaluated. Second, because of the observational nature of our investigation, we cannot exclude residual confounding from unmeasured or unknown confounders, and we cannot make causal inferences. Third, a single eGFR measurement at examination cycle 6 was used to classify participants into the different eGFR categories and to allow for adequate follow‐up time for development of CKD at subsequent examination cycles 7, 8, and 9. We recognize this could introduce misclassification error.
Implications
The moderate association between mildly reduced eGFR and a greater incidence of CVD and CKD should alert clinicians to manage people with lower than normal eGFR with an emphasis on renal‐ and CVD‐protective measures including treatment and control of hypertension and diabetes mellitus, management of blood lipid levels, and avoidance of renal‐toxic medications/procedures where possible. Our finding on the relations between mildly reduced eGFR and subclinical CVD is also suggestive that the pathophysiology of the observed association between eGFR and CVD is perhaps mediated via early cardiac remodeling and coronary artery calcification. Future studies should focus on investigating the association of mildly reduced eGFR and a more expansive array of markers of clinical and subclinical CVD in larger and more diverse multi‐ethnic samples.
Conclusion
In our large community‐based sample, mildly reduced eGFR (60–69 mL/min per 1.73 m2) was associated with increased risk of CAC and higher blood GDF‐15 and BNP levels cross‐sectionally, and with CVD and CKD incidence prospectively. These findings emphasize the need to detect individuals with lower than normal eGFR and implement earlier CVD preventative strategies. Future investigations involving more diverse ethnic groups are warranted to confirm our findings.
Sources of Funding
This work was supported by the National Heart, Lung, and Blood Institute Contracts NO1‐HC‐25195, HHSN268201500001I, and 75N92019D00031 and grants 1R38HL143584 and 5T32HL125232. Dr Vasan is supported in part by the Evans Medical Foundation and the Jay and Louis Coffman Endowment from the Department of Medicine, Boston University School of Medicine. The content is solely the responsibility of the authors and does not necessarily represent the official views of the National Institutes of Health.
Disclosures
None.
Supporting information
Tables S1–S6
Acknowledgments
We thank and acknowledge the participants of the Framingham Heart Study, without whom this research would not be possible.
Supplementary Material for this article is available at https://www.ahajournals.org/doi/suppl/10.1161/JAHA.120.020301
For Sources of Funding and Disclosures, see page 10.
References
- 1.Levey AS. Clinical practice. Nondiabetic kidney disease. N Engl J Med. 2002;347:1505–1511. DOI: 10.1056/NEJMcp013462. [DOI] [PubMed] [Google Scholar]
- 2.Chronic Kidney Disease Prognosis Consortium , Matsushita K, van der Velde M , Astor BC, Woodward M, Levey AS, de Jong PE , Coresh J, Gansevoort RT. Association of estimated glomerular filtration rate and albuminuria with all‐cause and cardiovascular mortality in general population cohorts: a collaborative meta‐analysis. Lancet. 2010;375:2073–2081. DOI: 10.1016/S0140-6736(10)60674-5. [DOI] [PMC free article] [PubMed] [Google Scholar]
- 3.Di Angelantonio E, Danesh J, Eiriksdottir G, Gudnason V. Renal function and risk of coronary heart disease in general populations: new prospective study and systematic review. PLoS Med. 2007;4:e270. DOI: 10.1371/journal.pmed.0040270. [DOI] [PMC free article] [PubMed] [Google Scholar]
- 4.Eisen A, Hoshen M, Balicer RD, Reges O, Rabi Y, Leibowitz M, Iakobishvili Z, Hasdai D. Estimated glomerular filtration rate within the normal or mildly impaired range and incident cardiovascular disease. Am J Med. 2015;128:1015–1022.e2. DOI: 10.1016/j.amjmed.2015.03.024. [DOI] [PubMed] [Google Scholar]
- 5.Manjunath G, Tighiouart H, Ibrahim H, MacLeod B, Salem DN, Griffith JL, Coresh J, Levey AS, Sarnak MJ. Level of kidney function as a risk factor for atherosclerotic cardiovascular outcomes in the community. J Am Coll Cardiol. 2003;41:47–55. DOI: 10.1016/S0735-1097(02)02663-3. [DOI] [PubMed] [Google Scholar]
- 6.Culleton BF, Larson MG, Wilson PW, Evans JC, Parfrey PS, Levy D. Cardiovascular disease and mortality in a community‐based cohort with mild renal insufficiency. Kidney Int. 1999;56:2214–2219. DOI: 10.1046/j.1523-1755.1999.00773.x. [DOI] [PubMed] [Google Scholar]
- 7.Rahman M, Brown CD, Coresh J, Davis BR, Eckfeldt JH, Kopyt N, Levey AS, Nwachuku C, Pressel S, Reisin E, et al. The prevalence of reduced glomerular filtration rate in older hypertensive patients and its association with cardiovascular disease: a report from the Antihypertensive and Lipid‐Lowering Treatment to Prevent Heart Attack Trial. Arch Intern Med. 2004;164:969–976. DOI: 10.1001/archinte.164.9.969. [DOI] [PubMed] [Google Scholar]
- 8.Garg AX, Clark WF, Haynes RB, House AA. Moderate renal insufficiency and the risk of cardiovascular mortality: results from the NHANES I. Kidney Int. 2002;61:1486–1494. DOI: 10.1046/j.1523-1755.2002.00270.x. [DOI] [PubMed] [Google Scholar]
- 9.Pani A, Bragg‐Gresham J, Masala M, Piras D, Atzeni A, Pilia MG, Ferreli L, Balaci L, Curreli N, Delitala A, et al. Prevalence of CKD and its relationship to eGFR‐related genetic loci and clinical risk factors in the SardiNIA study cohort. J Am Soc Nephrol. 2014;25:1533–1544. DOI: 10.1681/ASN.2013060591. [DOI] [PMC free article] [PubMed] [Google Scholar]
- 10.Coresh J, Selvin E, Stevens LA, Manzi J, Kusek JW, Eggers P, Van Lente F, Levey AS. Prevalence of chronic kidney disease in the United States. JAMA. 2007;298:2038–2047. DOI: 10.1001/jama.298.17.2038. [DOI] [PubMed] [Google Scholar]
- 11.Yu S, Yang H, Guo X, Zheng L, Sun Y. Association between obese phenotype and mildly reduced eGFR among the general population from rural northeast China. Int J Environ Res Public Health. 2016;13:540. DOI: 10.3390/ijerph13060540. [DOI] [PMC free article] [PubMed] [Google Scholar]
- 12.Mohandas R, Segal M, Srinivas TR, Johnson BD, Wen X, Handberg EM, Petersen JW, Sopko G, Merz CN, Pepine CJ. Mild renal dysfunction and long‐term adverse outcomes in women with chest pain: results from the National Heart, Lung, and Blood Institute‐sponsored Women's Ischemia Syndrome Evaluation (WISE). Am Heart J. 2015;169:412–418. DOI: 10.1016/j.ahj.2014.12.010. [DOI] [PMC free article] [PubMed] [Google Scholar]
- 13.Fukuta H, Ohte N, Mukai S, Asada K, Wakami K, Goto T, Kimura G. Relationship between renal function, aortic stiffness and left ventricular function in patients with coronary artery disease. Circ J. 2009;73:1740–1745. DOI: 10.1253/circj.CJ-09-0185. [DOI] [PubMed] [Google Scholar]
- 14.Natali A, Boldrini B, Baldi S, Rossi M, Landi P, Severi S, Solini A, Ferrannini E. Impact of mild to moderate reductions of glomerular filtration rate on coronary artery disease severity. Nutr Metab Cardiovasc Dis. 2014;24:681–688. DOI: 10.1016/j.numecd.2013.12.005. [DOI] [PubMed] [Google Scholar]
- 15.Yahalom G, Kivity S, Segev S, Sidi Y, Kurnik D. Estimated glomerular filtration rate in a population with normal to mildly reduced renal function as predictor of cardiovascular disease. Eur J Prev Cardiol. 2014;21:941–948. DOI: 10.1177/2047487313476963. [DOI] [PubMed] [Google Scholar]
- 16.Tsao CW, Vasan RS. Cohort profile: the Framingham Heart Study (FHS): overview of milestones in cardiovascular epidemiology. Int J Epidemiol. 2015;44:1800–1813. DOI: 10.1093/ije/dyv337. [DOI] [PMC free article] [PubMed] [Google Scholar]
- 17.Framingham Heart Study . Framingham Cohort. 2019. Available at: https://framinghamheartstudy.org/ Accessed: September 5, 2020.
- 18.Kannel WB, D'Agostino RB, Silbershatz H, Belanger AJ, Wilson PW, Levy D. Profile for estimating risk of heart failure. Arch Intern Med. 1999;159:1197–1204. DOI: 10.1001/archinte.159.11.1197. [DOI] [PubMed] [Google Scholar]
- 19.Foster MC, Hwang SJ, Porter SA, Massaro JM, Hoffmann U, Fox CS. Fatty kidney, hypertension, and chronic kidney disease: the Framingham Heart Study. Hypertension. 2011;58:784–790. DOI: 10.1161/HYPERTENSIONAHA.111.175315. [DOI] [PMC free article] [PubMed] [Google Scholar]
- 20.Wilson PW, D'Agostino RB, Levy D, Belanger AM, Silbershatz H, Kannel WB. Prediction of coronary heart disease using risk factor categories. Circulation. 1998;97:1837–1847. DOI: 10.1161/01.CIR.97.18.1837. [DOI] [PubMed] [Google Scholar]
- 21.Framingham Heart Study . Framingham Heart Study. 2020. Available at: https://www.framinghamheartstudy.org/fhs‐for‐researchers/noninvasive‐and‐biomarker‐protocols/ Accessed September 5, 2020.
- 22.Xanthakis V, Sung JH, Samdarshi TE, Hill AN, Musani SK, Sims M, Gharaibeh KA, Liebson PR, Taylor HA, Vasan RS, et al. Relations between subclinical disease markers and type 2 diabetes, metabolic syndrome, and incident cardiovascular disease: the Jackson Heart Study. Diabetes Care. 2015;38:1082–1088. DOI: 10.2337/dc14-2460. [DOI] [PMC free article] [PubMed] [Google Scholar]
- 23.de Simone G , Devereux RB, Daniels SR, Koren MJ, Meyer RA, Laragh JH. Effect of growth on variability of left ventricular mass: assessment of allometric signals in adults and children and their capacity to predict cardiovascular risk. J Am Coll Cardiol. 1995;25:1056–1062. DOI: 10.1016/0735-1097(94)00540-7. [DOI] [PubMed] [Google Scholar]
- 24.Hoffmann U, Brady TJ, Muller J. Cardiology patient page. Use of new imaging techniques to screen for coronary artery disease. Circulation. 2003;108:e50–e53. DOI: 10.1161/01.CIR.0000085363.88377.F2. [DOI] [PubMed] [Google Scholar]
- 25.Haring R, Enserro D, Xanthakis V, Mitchell GF, Benjamin EJ, Hamburg NM, Sullivan L, Nauck M, Wallaschofski H, Vasan RS. Plasma fibroblast growth factor 23: clinical correlates and association with cardiovascular disease and mortality in the Framingham Heart Study. J Am Heart Assoc. 2016;5:e003486. DOI: 10.1161/JAHA.116.003486. [DOI] [PMC free article] [PubMed] [Google Scholar]
- 26.Nayor M, Larson MG, Wang NA, Santhanakrishnan R, Lee DS, Tsao CW, Cheng S, Benjamin EJ, Vasan RS, Levy D, et al. The association of chronic kidney disease and microalbuminuria with heart failure with preserved vs. reduced ejection fraction. Eur J Heart Fail. 2017;19:615–623. DOI: 10.1002/ejhf.778. [DOI] [PMC free article] [PubMed] [Google Scholar]
- 27.McMahon GM, Hwang SJ, Tanner RM, Jacques PF, Selhub J, Muntner P, Fox CS. The association between vitamin B12, albuminuria and reduced kidney function: an observational cohort study. BMC Nephrol. 2015;16:7. DOI: 10.1186/1471-2369-16-7. [DOI] [PMC free article] [PubMed] [Google Scholar]
- 28.The Renal Association . CKD Classification. 2020. Available at: https://renal.org/health‐professionals/information‐resources/uk‐eckd‐guide/ckd‐stages Accessed September 5, 2020.
- 29.National Kidney Foundation . K/DOQI clinical practice guidelines for chronic kidney disease: evaluation, classification, and stratification. Am J Kidney Dis. 2002;39:S1–S266. [PubMed] [Google Scholar]
- 30.Vistisen D, Andersen GS, Hulman A, Persson F, Rossing P, Jorgensen ME. Progressive decline in estimated glomerular filtration rate in patients with diabetes after moderate loss in kidney function‐even without albuminuria. Diabetes Care. 2019;42:1886–1894. DOI: 10.2337/dc19-0349. [DOI] [PubMed] [Google Scholar]
- 31.Garland JS, Holden RM, Groome PA, Lam M, Nolan RL, Morton AR, Pickett W. Prevalence and associations of coronary artery calcification in patients with stages 3 to 5 CKD without cardiovascular disease. Am J Kidney Dis. 2008;52:849–858. DOI: 10.1053/j.ajkd.2008.04.012. [DOI] [PubMed] [Google Scholar]
- 32.Inaba Y, Chen JA, Bergmann SR. Carotid plaque, compared with carotid intima‐media thickness, more accurately predicts coronary artery disease events: a meta‐analysis. Atherosclerosis. 2012;220:128–133. DOI: 10.1016/j.atherosclerosis.2011.06.044. [DOI] [PubMed] [Google Scholar]
- 33.Resl M, Clodi M, Vila G, Luger A, Neuhold S, Wurm R, Adlbrecht C, Strunk G, Fritzer‐Szekeres M, Prager R, et al. Targeted multiple biomarker approach in predicting cardiovascular events in patients with diabetes. Heart. 2016;102:1963–1968. DOI: 10.1136/heartjnl-2015-308949. [DOI] [PubMed] [Google Scholar]
- 34.Andersson C, Enserro D, Sullivan L, Wang TJ, Januzzi JL, Benjamin EJ, Vita JA, Hamburg NM, Larson MG, Mitchell GF, et al. Relations of circulating GDF‐15, soluble ST2, and troponin‐I concentrations with vascular function in the community: the Framingham Heart Study. Atherosclerosis. 2016;248:245–251. DOI: 10.1016/j.atherosclerosis.2016.02.013. [DOI] [PMC free article] [PubMed] [Google Scholar]
- 35.Rohatgi A, Patel P, Das SR, Ayers CR, Khera A, Martinez‐Rumayor A, Berry JD, McGuire DK, de Lemos JA . Association of growth differentiation factor‐15 with coronary atherosclerosis and mortality in a young, multiethnic population: observations from the Dallas Heart Study. Clin Chem. 2012;58:172–182. DOI: 10.1373/clinchem.2011.171926. [DOI] [PMC free article] [PubMed] [Google Scholar]
- 36.O'Seaghdha CM, Hwang SJ, Upadhyay A, Meigs JB, Fox CS. Predictors of incident albuminuria in the Framingham Offspring cohort. Am J Kidney Dis. 2010;56:852–860. DOI: 10.1053/j.ajkd.2010.04.013. [DOI] [PMC free article] [PubMed] [Google Scholar]
Associated Data
This section collects any data citations, data availability statements, or supplementary materials included in this article.
Supplementary Materials
Tables S1–S6