Abstract
Background
Ciguatera fish poisoning (CFP) poses a serious threat to both public health and the use of aquatic resources from the various warm‐water regions of the world. Hence, a process for the efficient determination of the relevant toxins is required.
Objective
We sought to develop and validate the first LC-MS/MS method to quantify the major toxins prevalent in fish from the Pacific Ocean.
Method
Toxins were extracted from fish flesh (2 g) using a methanol–water mixture (9:1, v/v). The extract was heated at 80°C, and low-polarity lipids were eliminated using hexane, initially from the basic solution and later from the acidic solution. The cleanup was performed using solid-phase extraction, Florisil, silica, reversed-phase C18, and primary secondary amine columns. A validation study was conducted by spiking fish flesh with two representative toxins having different skeletal structures and polarities and was calibrated by NMR (qNMR) spectroscopy.
Results
The validation parameters for the ciguatera toxins CTX1B and CTX3C at spiked levels of 0.1 µg/kg were as follows: repeatabilities of 2.3–3.5% and 3.2–5.3%; intermediate precisions of 6.3–9.8% and 6.0–7.4%; recoveries of 80–107% and 95–120%, respectively. The lowest detection levels were 0.004 µg/kg for CTX1B, 0.005 µg/kg for 51-hydroxyCTX3C, and 0.009 µg/kg for CTX3C.
Conclusions
The described method practically clears the international action level of 0.01 µg/kg CTX1B equivalents set by the U.S. Food and Drug Administration and the European Food Safety Authority and satisfies the global standards set by Codex and AOAC INTERNATIONAL.
Highlights
A validation study for an LC-MS/MS method for ciguatoxin detection was completed for the first time using calibrated toxin standards.
Ciguatera fish poisoning (CFP), an illness caused by the ingestion of toxic fish, poses a serious threat to public health in the tropical and subtropical regions of the Pacific Ocean, the Indian Ocean, and the Caribbean Sea (1). The geographical occurrence and frequency of CFP are increasing, probably due to eutrophication and global warming, as exemplified by outbreaks in the Eastern Atlantic Canary Islands (2, 3) and coastal waters of mainland Japan (4). The causative toxins for CFP, viz. ciguatoxins (CTXs), differ in structure among the above-mentioned three regions. The present study deals only with the toxins found in the Pacific Ocean. In the Pacific Ocean, CTXs are produced by the benthic dinoflagellate, Gambierdiscus toxicus and related species (1, 5). CTX contamination of various fish species occurs along the food chain, and CTXs undergo various structural changes to produce approximately twenty different congeners (6–10). Furthermore, the diversity of the toxin structures and fish matrixes add to the difficulty of their analyses. Among these diverse congeners, CTX1B and CTX3C are known to play the principal roles as they represent the high- and low-polarity toxins, respectively, and are present in important carnivorous and/or herbivorous fish (1, 5, 11–13). Additionally, 51-hydroxyCTX3C, the most toxic CTX3C congener, and 52-epi-54-deoxyCTX1B, known to occur frequently in the Pacific Ocean (5, 11), were also included in this study. On the other hand, we omitted CTX4A and CTX4, because their presence is limited to G. toxicus (14), the parrotfish collected in the Gambier Islands at the time when CFP flared up there (15), and the spotted knife jaw, Oplegnathus punctatus, a game fish for anglers in Japan (12). CTXs are known to activate voltage-dependent Na+ channels at pico-molar levels (16), exhibiting a potency almost 100 times stronger than that of the well-known fish toxin, tetrodotoxin (17). Because of this extraordinary toxicity, both the U.S. Food and Drug Administration (FDA) and the European Food Safety Authority (EFSA) have proposed a provisional control threshold at an extremely low level of 0.01 µg/kg for CTX1B equivalents in fish tissues (18, 19). In light of the urgent need to develop appropriate analytical methods for CTX analyses, multiple international programs are currently focused on establishing a system for this purpose (5, 20). Indeed, because of the large errors reported in quantitative and qualitative data, as well as the ethical concerns associated with animal testing, the traditional mouse bioassay-based toxicity testing method (21) must be replaced (22). In this context, Yogi et al. (23) first demonstrated the strong potential of liquid chromatography-tandem mass spectrometry (LC-MS/MS)-based methods for toxin analysis. Using this approach, the toxin profiles in various species of fish collected from different parts of the Pacific Ocean were successfully analyzed with a high sensitivity, selectivity, and accuracy (12, 23). However, validation studies to enable the wider application of this method for practical use did not materialize owing to a lack of analytical standards for identification and quantification, poor availability of appropriate fish for conducting spiking/recovery tests, presence of highly variable matrixes among different fish species, presence of large fluctuations in the quality of commercial solid-phase extraction (SPE) columns among production lots (24), and extremely low limits set for regulation. However, after years of enormous efforts, calibrated standards for the major CTXs were prepared at the Japan Food Research Laboratories (JFRL, 25), thereby renewing the efforts toward developing effective methods for CTX analysis. The toxicological data necessary to convert the respective congeners to CTX1B-equivalents were also acquired (23).
We herein report our in-depth evaluation of the causes and types of challenges previously encountered during sample cleanup for LC-MS/MS analysis, address the various process limitations, and validate the method according to the international standards. In addition, we optimized the accuracy and robustness of this ultra-trace analysis method without compromising on its simplicity and rapidity. The data obtained from this analysis will be expected to help ensure food safety, support medical diagnosis and epidemiological studies, and improve the efficiency of CTX testing. For this study, classification of the CTXs, abbreviations, and synonyms employed, and the toxicity data follow those described in the latest expert review on CFP and CTXs (5).
METHOD
Experimental
Chemicals.
—Methanol (MeOH), acetone, ethyl acetate (EtOAc), hexane (Hex), acetonitrile (MeCN), sodium acetate, sodium carbonate (Na2CO3), anhydrous citric acid, acetic acid, ammonium acetate, formic acid, ammonium formate of analytical grade, and MeOH of HPLC grade were purchased from Fujifilm Wako Chemical Industry, Ltd (Osaka, Japan). The deionized water was prepared using the MilliQ Water Purification system (Merck Millipore, Billerica, MA). The SPE-Florisil columns [InertSep FL-PR 500 mg/3 mL (five different lots), GL Sciences Inc., Tokyo, Japan], SPE-C18 and SPE-silica columns (Sep-Pak Plus short C18 360 mg and Sep-Pak Plus Long Silica 690 mg, Waters Corp., Milford, MA), and SPE-primary and secondary amine columns (PSA, anion exchange, Inert Sep PSA 50 mg/g, GL Sciences Inc.,) were used to prepare the sample solutions.
Fish Specimens
An amberjack (Seriola quinqueradiata) and a seabream (Pagrus major) were purchased from a Tokyo market to test the effectiveness of the various solvents for initial toxin extraction. Both species are important commercial fish with no history of CFP implications in Japan. Amberjack is a fatty fish, whereas seabream is not. A total of seven red snappers (Lutjanus bohar) and five groupers (Variola louti), which were free of CXTs or contained only trace amounts of CTXs, were sourced from Okinawa, Japan, and were used for the spiking and recovery tests. The absence of toxins was confirmed by mouse bioassays (26) and/or LC-MS/MS analysis using the method described by Yogi et al. (23). The naturally contaminated ciguateric fish caught in Okinawa included a red snapper (L. bohar), a grouper (V. louti), and a white-edged grouper (Variola albimarginata). These samples were used to compare the method established in the present study with the previously published method (23). The fish flesh was minced while frozen, and stored at around –30°C prior to sample preparation.
Reference CTX Toxins
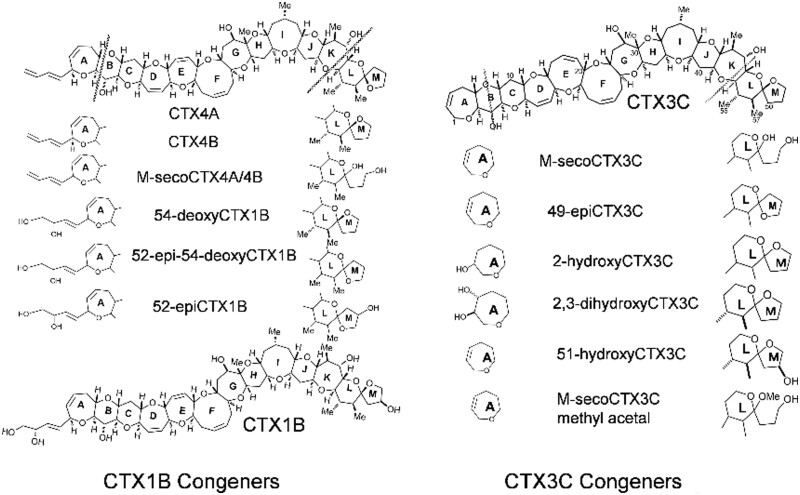
Based on the skeletal structures, the CTXs present in fish found in the Pacific Ocean can be classified into two groups, the CTX1B group and CTX3C group (Figure 1). Both groups consist of 12 ether rings but differ in the size and alignment of the rings. The CTX1B-group contains a butenyl sidechain that is absent in the CTX3C group. In addition, the numbers and positions of the hydroxyl groups vary among the individual toxins. Such structural diversity produces complex behaviors during the cleanup and chromatographic analyses of the toxins. Owing to the limited stock of pure toxins, we selected CTX1B and CTX3C to spike the fish flesh samples for recovery tests. As mentioned previously, the majority of congeners found in commercially important species showed polarity ranges between the two toxins. We also conducted recovery tests using 51-hydroxyCTX3C and 52-epi-54-deoxyCTX1B; the former is the only congener to exceed CTX1B in toxicity, and the latter is particularly abundant in the Pacific Ocean (5, 11). However, owing to the limited availability of these toxins, the experiments were conducted on a limited scale. The purities and quantities of the toxins were confirmed by comparison with standard toxins, which were quantified by quantitative NMR (qNMR) spectroscopy (25). Because of the poor availability of CTX3C, its epimer, 49-epiCTX3C, was used instead of CTX3C in some spiking tests, whereby the same ionization rate was assumed for both. In addition, six other congeners were used to identify the following toxins in the fish samples: 52-epi-54-deoxyCTX1B, 54-deoxyCTX1B, 2,3-dihydroxyCTX3C, 51-hydroxyCTX3C, CTX4A, and CTX4B. The calibration curves for CTX1B, CTX3C, 49-epiCTX3C, 51-hydroxyCTX3C, CTX4A, and 52-epi-54-deoxyCTX1B were prepared over a concentration range of 0.02–0.4 ng/mL.
Figure 1.
Structures of the CTX congeners.
Sample Preparation Procedure
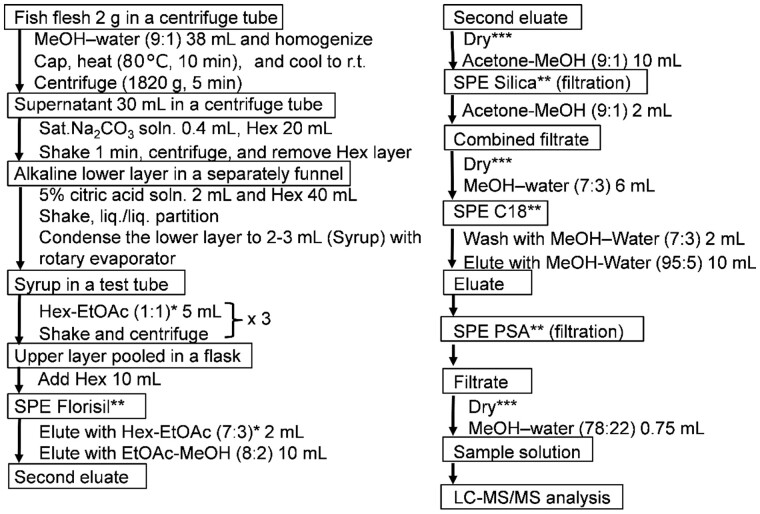
The sample extraction and purification procedures were extensively optimized based on the previously reported methods (23). More specifically, a fish tissue sample (2 g) was homogenized with a MeOH–water solvent mixture (38 mL, 9:1, v/v) for 2 min at 10 000 rpm (NS-51, Physcotron, Microtec Co. Ltd, Chiba, Japan) in a 60 mL polypropylene centrifuge tube (126 × 30 mm; Sarstedt K.K., Tokyo, Japan). Subsequently, the tube was capped, heated in a water bath at 80°C for 10 min, and then cooled to the ambient temperature. After subsequent centrifugation for 5 min at 1821 g (H-80α; Kokusan Co. Ltd., Tokyo, Japan), a portion (30 mL) of the supernatant (equivalent to 1.5 g fish tissue) was transferred to another tube, combined with a saturated Na2CO3 solution (0.4 mL) and Hex (20 mL). The mixture was shaken for 1 min and subjected to centrifugation once again (as above). The lower layer was then combined with a 5% citric acid solution (2 mL) and Hex (40 mL) in a 100 mL separatory funnel, and shaken for 1 min. After allowing to stand for ∼5 min, the lower layer was condensed to a syrup (2–3 mL) at 45°C using a rotary evaporator. This syrup was combined with a water-saturated Hex–EtOAc mixture (5 mL, 1:1, v/v) in a 10 mL glass centrifuge tube, shaken for 1 min, and subjected to centrifugation. The upper layers were then combined in a 50 mL flask and mixed with Hex (10 mL). The lower layer was further subjected to the above liquid–liquid partition procedure (×2), and after centrifugation, each upper layer was combined in the flask. This combined mixture was applied to a normal-phase SPE (Florisil) column pre-conditioned with a water-saturated Hex–EtOAc mixture (3 mL, 7:3, v/v) to remove any polar interferences from the extract. The CTX congeners adsorbed on the column were collectively eluted with an EtOAc–MeOH mixture (10 mL, 8:2, v/v). Subsequently, the eluate was evaporated to dryness with a rotary evaporator and then under a gentle stream of nitrogen at the ambient temperature. This drying procedure was employed throughout the various cleanup steps. The residue was then dissolved in an acetone–MeOH mixture (10 mL, 9:1, v/v) and filtered through a silica cartridge column pre-conditioned with an acetone–MeOH mixture (3 mL, 9:1, v/v). The column was washed with an acetone–MeOH mixture (2 mL, 9:1, v/v), and the combined filtrate was evaporated in a similar manner as above prior to redissolution in a MeOH–water mixture (6 mL, 7:3, v/v). The resulting solution was applied to a reversed-phase SPE-C18 column pre-conditioned sequentially with MeOH (5 mL) and a MeOH–water mixture (5 mL, 7:3, v/v). The C18 cartridge column was then washed with a MeOH–water mixture (2 mL, 7:3, v/v), and the retained toxins were eluted using a MeOH–water mixture (10 mL, 95:5, v/v). Finally, the eluate was directly passed through an anion exchange SPE-PSA column pre-conditioned with MeOH (5 mL). The obtained eluent was dried, dissolved in a MeOH–water mixture (0.75 mL, 78:22, v/v), and used for LC-MS/MS analysis (Figure 2). An 1-mL portion of the sample solution corresponded to 2 g of the fish flesh. The procedures described above were carried out at room temperature.
Figure 2.
Cleanup procedure for sample preparation. Note: *the hexane (Hex)–EtOAc mixture was saturated with water at room temperature prior to use. Solvent ratios are quoted in v/v; **each SPE column was preconditioned as in the text; ***solvent drying was performed first with a rotary evaporator and then under a N2 stream.
LC-MS/MS Analysis
LC-MS/MS analysis was carried out according to a previously reported method (23) with minor modifications. The LC-MS/MS instrument employed was an Infinity 6470 Triple Quadrupole LC-MS instrument (Agilent Technologies, CA) equipped with an Agilent Jet Stream electrospray ionization source, and was based at the JFRL. The CTX congeners were separated on a Zorbax Eclipse Plus C18 column (2.1 × 50 mm, 1.8 µm, Agilent) at a column temperature of 40°C. The LC mobile phases consisted of 5 mM ammonium acetate, 5 µM sodium acetate, and 0.1% acetic acid in water (A) and MeOH (B). The gradient used was as follows: 70% B held for 0.25 min, increased to 80% B over 0.5 min, increased to 90% B over 10 min, 90% B held for 5 min. The flow rate and the injection volume were 0.4 mL/min and 2 µL, respectively. An additional LC-MS/MS instrument was also employed (Infinity 6460 Triple Quadrupole LC-MS) at the National Institute of Health Sciences (NIHS, Japan). Identical LC separation conditions were employed to those described above with the exception that the mobile phases consisted of 5 mM ammonium formate and 0.1% formic acid in water (A) and MeOH (B). The flow rate and the injection volume were 0.4 mL/min and 5 µL, respectively.
The mass spectrometer was operated in multiple reaction monitoring (MRM) mode with a collision energy of 40 V, and the [M+Na]+ ions were monitored for both the precursor and product ions, as previously described (23). The instrumental parameters employed were as follows: drying gas, 10 L/min of N2 at 300°C; sheath gas, 11 L/min of N2 at 350°C; nebulizer gas, N2 at 50 psi; capillary voltage, 5000 V; nozzle voltage: 1000 V; fragmentor voltage, 340 V; and delta electron multiplier value, 200 V. The LC column was washed with MeOH for 5 min between sample injections. The instrumental parameters were as those described in the literature (23), but with a sheath gas temperature of 400°C and a fragmentor voltage of 350 V. The toxins were monitored according to their m/z values [M+Na]+ as follows: CTX1B (m/z 1133.6), 2,3-dihydroxyCTX3C (m/z 1079.6), 51-hydroxyCTX3C (m/z 1061.6), 52-epi-54-deoxyCTX1B and 54-deoxyCTX1B (m/z 1117.6), 49-epiCTX3C/CTX3C (m/z 1045.6), and CTX4A/CTX4B (m/z 1083.6).
Results and Discussion
Extraction and Liquid–Liquid Partition
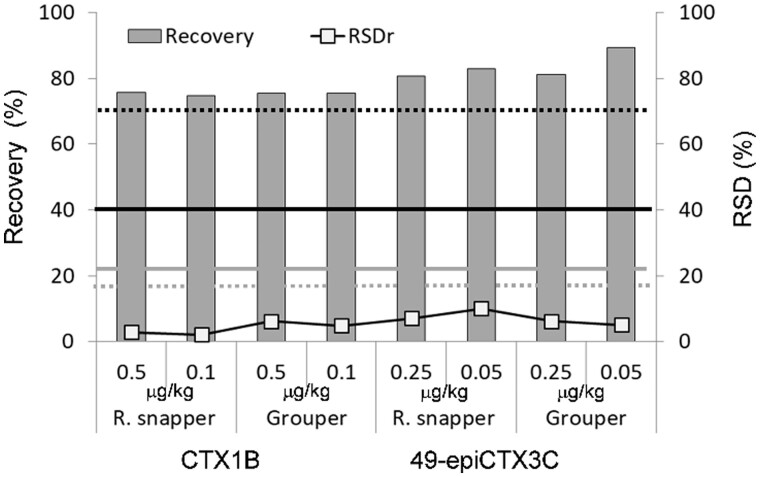
Based on the instrument sensitivity, we considered that 2 g of fish flesh would be sufficient for analysis. The initial extraction was carried out only once using a MeOH–water mixture (38 mL, 9:1, v/v) to minimize the extraction of low-polar lipids such as triglycerides. The efficacy of the present extraction method was verified by measuring the amounts of toxin in the first and the second extracts prepared from the flesh of a naturally contaminated grouper. More than 95% of CTXs (total of 0.53 ng/g) were found to have been recovered in the first extraction, with only 0.02 ng/g of CTXs being recovered in the second extraction. We assumed that 2 g of fish flesh was approximately equal to 2 mL, thereby giving a total extract volume of 40 mL. The 30 mL portion used for analysis, therefore, corresponded to 1.5 g of the sample flesh. The efficiency of MeOH–water mixture (9:1, v/v) as the extractant was examined in experiments performed on the two species of non-ciguateric fish. More specifically, the two toxins, viz. CTX1B and 49-epiCTX3C, were spiked into seabream and amberjack, respectively, at a concentration range of 0.05–0.5 µg/kg and were extracted using the MeOH–water mixture (9:1, v/v). The extracts were subjected to cleanup following the procedure depicted in Figure 2, but without heating the extract, the solvent partitions under acidic or alkaline conditions, or SPE silica filtrate. The results from six repeated experiments are shown in Figure 3. For the three samples, the RSD slightly exceeded the acceptable range set by Codex, and the recoveries and other parameters were within the range set by Codex for analytes below 1 µg/kg (27).
Figure 3.
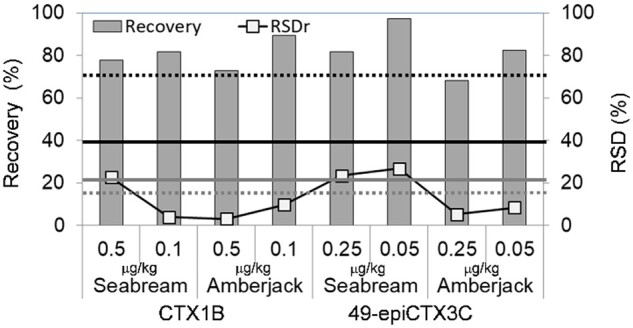
Recoveries and RSDs for MeOH–water mixture (9:1, v/v) extraction tests on the toxin-spiked non-ciguateric fish. The black and grey bold lines indicate the recovery and RSD, respectively, which are defined as per the Codex procedural manual (27): average recovery = 40–120%, and RSDr ∼22% (inferred from RSDR < 44%) for a target analyte below a concentration of 1 µg/kg. Broken lines show the acceptable ranges defined by AOAC (28): average recovery = 70–125%, RSDr = 15% for analytes at concentrations less than 10 µg/kg.
The extracts were heated at 80°C for 10 min to release the toxins from the bound proteins. Subsequently, liquid–liquid partition was performed in two steps. Initially, the hexane washing was performed under alkaline conditions to remove basic compounds in hexane. Subsequently, the lower layer was acidified with a 5% aqueous citric acid solution and the acidic lipids such as fatty acids were removed by washing with hexane. This alternate acid/base treatment effectively reduced the background interferences. An example can be seen in the sample solution of the extract from a red snapper (L. bohar), where the intense peaks corresponding to interfering ions observed in the region corresponding to the CTXs in the total ion chromatogram disappeared after alternating use of sodium carbonate and citric acid solutions (Figure 4).
Figure 4.
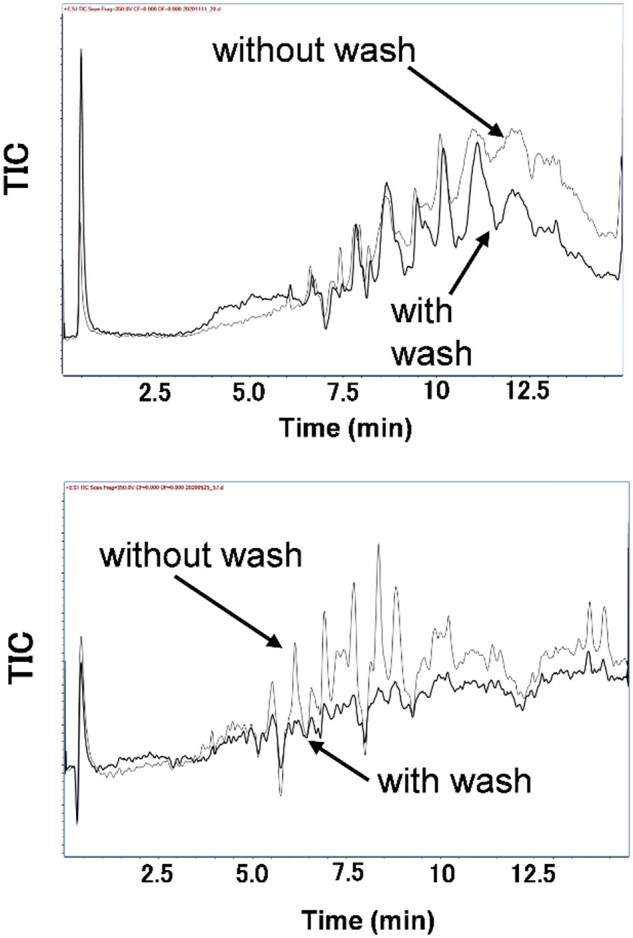
Total ion chromatogram (TIC) (m/z 500–1500) of a red snapper sample solution prepared according to Figure 2 with or without sodium carbonate washing (top) and also with or without citric acid washing (bottom). Each bold line represents the TIC with washing.
SPE Column Cleanups
We initially examined the use of SPE-Florisil columns for the cleanup procedure. Florisil is effective for the removal of fatty acids, phospholipids, and other interfering compounds, but its quality has been known to fluctuate between both manufacturers and columns from the same manufacturer (24). Five different lots purchased from the same source were tested, i.e., lot-A through to lot-E. The column cartridges from lot-A were used without any problems in the early stage of our study, even though SPE-silica treatment and other minor modifications had not yet been incorporated (Figure 5).
Figure 5.
Recovery and repeatability tests on two species of non-toxic ciguateric fish. The figure legends are as those given in Figure 3. SPE-Florisil columns from lot-A were used. Data in respective bar and plot were collected from three independent experiments carried out on three different days.
When the stock of lot-A was exhausted, a new lot was purchased from the same manufacturer (lot-B) and tested. The results from the analysis based on the columns from lot-B were starkly different and afforded <40% recoveries of both CTX1B and 49-epiCTX3C. This prompted us to examine the variations in the quality of SPE-Florisil columns among different production lots.
After testing a range of solvent compositions, a water-saturated Hex–EtOAc mixture (7:3, v/v) was found suitable for the adsorption of CTX1B and CTX3C, while leaving the low-polarity contaminants un-adsorbed.
Tests on the adsorption and elution of the toxins revealed that more than 35% of CTX3C was not adsorbed using the water-saturated Hex–EtOAc mixture (1:1, v/v) (Table 1), and that ∼20% of CTX1B remained uneluted from the column upon washing with the EtOAc–MeOH mixture (85:15, v/v). After testing various solvent compositions, the water-saturated Hex–EtOAc mixture (7:3, v/v) and EtOAc–MeOH mixture (8:2, v/v) were found to be suitable for the adsorption and elution of CTX1B and CTX3C, respectively (Table 2). The low-polarity contaminants were not adsorbed.
Table 1.
Adsorbed ratio (%) on the SPE-Florisil columns in Hex–EtOAc (1:1, v/v)a
| Lot | CTX1B | CTX3C |
|---|---|---|
| B | >99 | 63 |
| C | >99 | 68 |
| D | >99 | 62 |
| — Avg. | >99 | 64 |
0.2 ng each of CTX1B and CTX3C was dissolved in 25 mL water-saturated Hex–EtOAc (1:1), charged to SPE Florisil, and then eluted with 10 mL EtOAc–MeOH (8:2). >99 denotes charged at over 99% yield.
Table 2.
Recoveries (%) from SPE-Florisil columnsa
| Lot | Run | CTX1B |
CTX3C |
||
|---|---|---|---|---|---|
| Charge | Elution | Charge | Elution | ||
| Hex–EtOAc | EtOAc– MeOH | Hex– EtOAc | EtOAc– MeOH | ||
| (7:3)b | (8:2) | (7:3)b | (8:2) | ||
| B | 1 | >99 | 88 | >99 | 93 |
| 2 | >99 | 88 | >99 | 97 | |
| Avg. | >99 | 88 | >99 | 95 | |
| C | 1 | >99 | 90 | >99 | 105 |
| 2 | >99 | 88 | >99 | 105 | |
| Avg. | >99 | 89 | >99 | 105 | |
| D | 1 | >99 | 97 | >99 | 111 |
| 2 | >99 | 94 | >99 | 106 | |
| Avg. | >99 | 95 | >99 | 109 | |
| E | 1 | >99 | 94 | >99 | 109 |
| 2 | >99 | 90 | >99 | 107 | |
| Avg. | >99 | 92 | >99 | 108 | |
a One nanogram each of CTX1B and CTX3C was dissolved in 25 mL Hex–EtOAc (7:3), charged to SPE Florisil, and then eluted with 10 mL EtOAc–MeOH (8:2). >99 denotes charged at over 99% yield. b Saturated with 0.1% citric acid.
It was also found that increasing the MeOH content in the eluent increased the extraction of interfering compounds. Thus, to reduce such interferences, an additional SPE-silica column filtration was incorporated. For this purpose, the extracts were dissolved in an acetone–MeOH mixture (9:1, v/v) and simply percolated through a SPE-silica column. Subsequently, the toxins were dissolved in a MeOH–water mixture (7:3, v/v) and applied to a SPE-C18 column. The retained toxins were eluted with MeOH–water mixture (95:5, v/v) instead of MeOH alone to deter the elution of the low-polarity interferences. A final elution through SPE-PSA columns was used to remove the remaining fatty acids and other acidic interferences whose proportions may increase during storage. The cleanup procedure is depicted in Figure 2.
Variation in the Mobile Phase for LC Separation
We compared two different mobile phase compositions for LC separation, viz. ammonium acetate–acetic acid and the ammonium formate–formic acid buffers, as described previously (23). The relative sensitivities toward CTX1B and 49-epiCTX3C, as well as the baseline response, were markedly improved when the acetate buffer was used (Figure 6).
Figure 6.
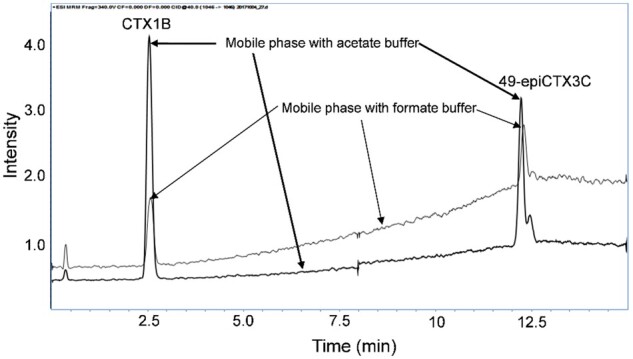
LC separation of the CTX1B and 49-epiCTX3C standards using two mobile phases, viz. the present acetate buffer (bold line) and the previously employed formate buffer (23).
Washing of the LC Column to Eliminate Interferences During LC-MS/MS
Repeated injection of the fish extracts causes the accumulation of interferences, which impairs the maximum sensitivity. Thus, a column washing step was inserted between sample injections. Enhancement of the signal intensities and a reduction in the RSDs were clearly observed after this additional washing (Figure 7).
Figure 7.
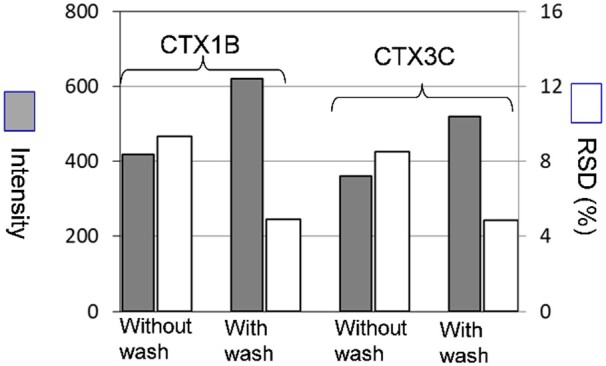
Column washings increased the signal intensities (peak areas) and reduced the RSDs in both CTX1B and CTX3C. The presented results were obtained by six injections of an extract from a red snapper. The LC column was washed with MeOH for 5 min in between injections with intervals of 15 min.
Optimization of the Injection Volume
To prevent the accumulation of interferences from repeated injections of the sample extracts and to improve the peak shapes, the injection volume was reduced from the previously reported level of 5 µL (23) to 2 µL (4 mg equivalent of fish flesh). This led to sharpening of the peak shapes, which in turn enhanced the sensitivity.
Calibration Curves, Chromatographic Separation, and Detection Limits Determined Using the CTX Standards
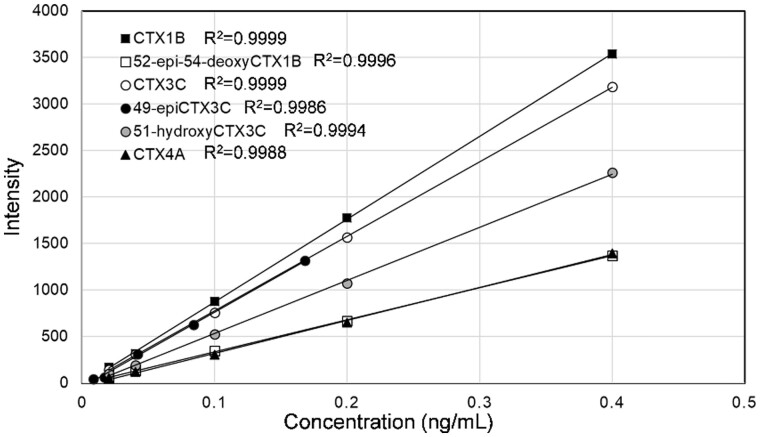
The linearity of the calibration curves and suitable chromatographic resolution of the major CTX congeners can be seen in Figures 8 and 9, respectively. The overlapped calibration curves for CTX3C and 49-epiCTX3C justify the use of the latter in place of the former for the cleanup experiments.
Figure 8.
Calibration curves for the major CTX standards.
Figure 9.
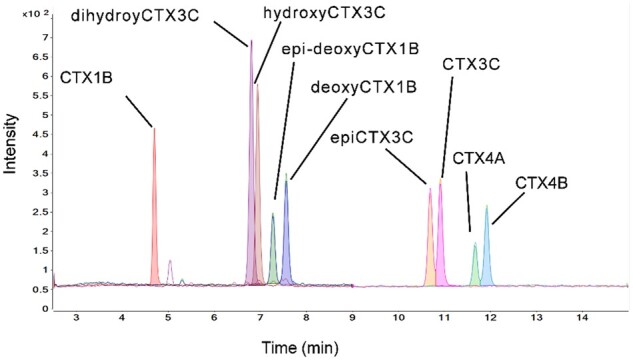
Chromatogram for the CTX standards. The structures and names of these standards are shown in Figure 1. The toxins are labeled as follows: dihydroxyCTX3C (2,3-dihydroxyCTX3C), hydroxyCTX3C (51-hydroxyCTX3C), epi-deoxyCTX1B (52-epi-54-deoxyCTX1B), deoxyCTX1B (54-deoxyCTX1B), and epiCTX3C (49-epiCTX3C).
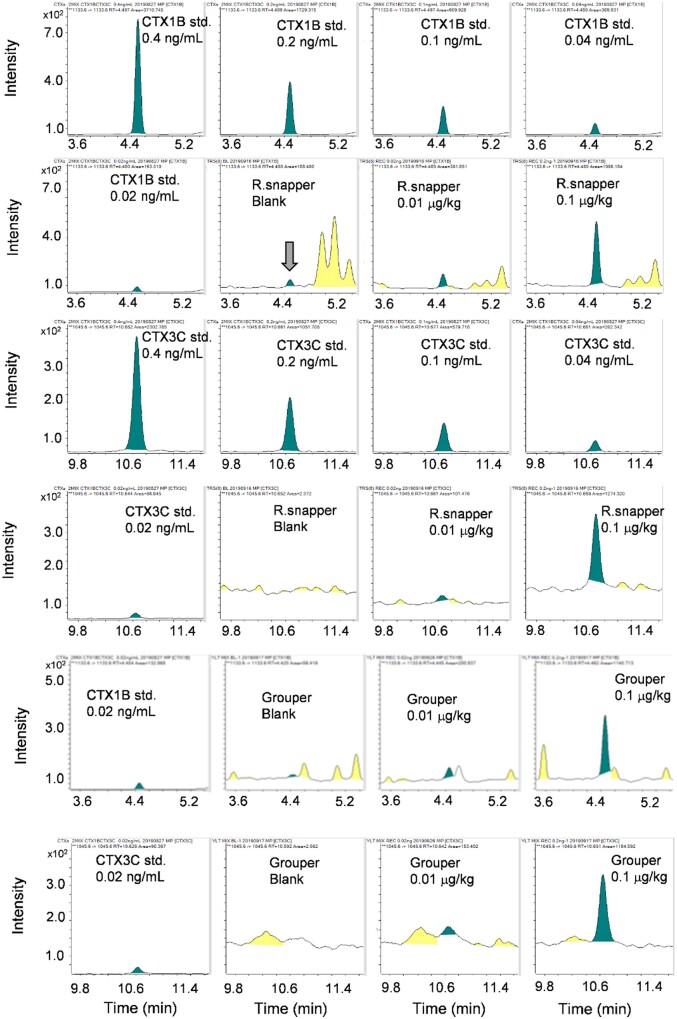
Figure 10 shows the chromatograms for CTX1B, CTX3C, and the sample solutions prepared from a red snapper (R. snapper), and a grouper spiked at 0.01 or 0.1 µg/kg equivalents.
Figure 10.
Chromatograms for CTX1B and CTX3C, either pure or spiked to a red snapper (R. snapper) and a grouper. The spiked levels of CTX1B and CTX3C were 0.01 and 0.1 µg/kg equivalents, respectively. The blank specimen of R. snapper (shown by a grey arrow in the second column, second row) contained a trace level of CTX1B. Sample solutions were prepared according to the present cleanup procedure.
The LODs estimated from the recovery tests using the spiked samples were <0.01 µg/kg for CTX1B and ∼0.02 µg/kg for CTX3C. By contrast, the LODs and the LOQs were calculated from the standard deviations of the data obtained using samples of an R. snapper spiked at 0.03 µg/kg equivalent. Owing to its high toxicity, we also calculated the LOD and LOQ for 51-hydroxyCTX3C by conducting the same recovery test. The calculated LODs were 0.004 µg/kg for CTX1B, 0.005 µg/kg for 51-hydroxyCTX3C, and 0.009 µg/kg for CTX3C. The calculated LOQs were 0.01 µg/kg for CTX1B, 0.02 µg/kg for 51-hydroxyCTX3C, and 0.03 µg/kg for CTX3C (Table 3).
Table 3.
LOD and LOQ calculated for CTX1B, 51-hydroxyCTX3C, and CTX3C (µg/kg)
| Run | CTX1Bb | 51-hydroxyCTX3C | CTX3C |
|---|---|---|---|
| 1 | 0.013 | 0.020 | 0.017 |
| 2 | 0.011 | 0.020 | 0.019 |
| 3 | 0.013 | 0.020 | 0.018 |
| 4 | 0.011 | 0.017 | 0.022 |
| 5 | 0.011 | 0.016 | 0.024 |
| 6 | 0.012 | 0.017 | 0.024 |
| 7 | 0.014 | 0.017 | 0.021 |
| Avg. | 0.012 | 0.018 | 0.021 |
| SD | 0.00122 | 0.00183 | 0.00285 |
| LODa (SD × 3) | 0.00366 | 0.00549 | 0.00855 |
| LOQa (SD × 10) | 0.01219 | 0.01828 | 0.02851 |
LOD and LOQ were estimated by using SD × 3 and SD × 10, respectively.
Data for CTX1B were obtained after subtraction of the blank value. The sample studied was the R. snapper spiked at 0.03 µg/kg.
These results are the first to be derived from real fish samples and demonstrate that the present LC-MS/MS method can practically meet the rigorous level of 0.01 µg/kg CTX1B equivalents set by the U.S. FDA and the EFSA (18, 19).
Validation of the Cleanup Procedure
The cleanup procedure (Figure 2) was subjected to a validation study. The recovery, repeatability, and intermediate precision calculated from 10 data points are shown in Table 4. The data were gathered from two independent experiments carried out on five separate days. The SPE-Florisil columns used were from “lot-B.” The recoveries were between 86 and 107%, and a repeatability of <6% was achieved using two fish specimens spiked with CTX1B and CTX3C at a level of 0.1 µg/kg, respectively. These data fall into the acceptable ranges of the global standards proposed by Codex and AOAC (27, 28).
Table 4.
Recovery, repeatability, and intermediate precision (%) examined with fish flesha
| Fish | Experimental day | CTX1Ba |
CTX3Ca |
||
|---|---|---|---|---|---|
| Run 1 | Run 2 | Run 1 | Run 2 | ||
| R. snapper | Day 1 | 97 | 100 | 113 | 99 |
| Day 2 | 82 | 90 | 107 | 98 | |
| Day 3 | 107 | 102 | 120 | 118 | |
| Day 4 | 104 | 102 | 107 | 101 | |
| Day 5 | 85 | 88 | 101 | 104 | |
| Avg. | 96 | 107 | |||
| Repeatability | 3.5 | 5.3 | |||
| Intermediate precision | 9.8 | 7.4 | |||
| Grouper | Day 1 | 89 | 85 | 103 | 104 |
| Day 2 | 93 | 89 | 111 | 108 | |
| Day 3 | 93 | 93 | 115 | 105 | |
| Day 4 | 83 | 80 | 95 | 96 | |
| Day 5 | 81 | 82 | 105 | 103 | |
| Avg. | 87 | 105 | |||
| Repeatability | 2.3 | 3.2 | |||
| Intermediate precision | 6.3 | 6.0 | |||
Each spiked level of CTX1B and CTX3C is 0.1 µg/kg.
To complement the above validation data, we carried out additional recovery tests by spiking 52-epi-54-deoxyCTX1B and 51-hydroxyCTX3C into the flesh of a R. snapper. As shown in Table 5, acceptable recoveries (trueness) to the global standards were obtained for the two CTXs.
Table 5.
Recoveries (%) for 52-epi-54-deoxyCTX1B and 51-hydroxyCTX3C tests on fish flesh of a grouper
| Toxin | Run | Spiked level |
|
|---|---|---|---|
| 0.1 µg/kg | 0.5 µg/kg | ||
| 52-epi-54-deoxyCTX1B | 1 | 70 | 68 |
| 2 | 70 | 72 | |
| Avg. | 70 | 70 | |
| 51-hydroxyCTX3C | 1 | 89 | 86 |
| 2 | 72 | 88 | |
| Avg. | 78 | 87 | |
Comparison of the Present Method with a Previously Reported Method Using Naturally Contaminated Fish
The present method was then evaluated by conducting separate experiments at two institutions, viz. the JFRL and NIHS, using the same toxic fish samples. At the NIHS, the analysis was carried out according to a previously reported method (23) using SPE-Florisil columns from lot-A. At the JFRL, columns from lot-B were used. The data variation was evaluated by injecting the same test solution in triplicate. At first glance, the data from the two methods appeared comparable, especially when the total amounts were considered alone (Table 6). However, a closer evaluation revealed that the RSDs were significantly smaller in the data based on the present method, thereby indicating its superior reliability compared to the previously reported method (23).
Table 6.
Data comparison between the present method and a reported method with real toxic fish (figures are the toxin concentrations in µg/kg)a
| Fish | Injection | Present method |
Reported method |
||||||
|---|---|---|---|---|---|---|---|---|---|
| CTX1B | Epi-deoxyCTX1B | DeoxyCTX1B | Total | CTX1B | Epi-deoxyCTX1B | DeoxyCTX1B | Total | ||
| Red snapper | 1 | 0.07 | 0.04 | 0.09 | 0.20 | 0.12 | 0.02 | 0.07 | 0.21 |
| 2 | 0.06 | 0.04 | 0.10 | 0.20 | 0.07 | 0.02 | 0.03 | 0.13 | |
| 3 | 0.07 | 0.04 | 0.08 | 0.19 | 0.17 | 0.04 | 0.06 | 0.27 | |
| Avg. | 0.07 | 0.04 | 0.09 | 0.20 | 0.12 | 0.03 | 0.05 | 0.20 | |
| RSD, % | 4.6 | 2.7 | 9.0 | 2.6 | 32.8 | 23.6 | 27.3 | 27.3 | |
| Grouper | 1 | 0.10 | 0.09 | 0.20 | 0.40 | 0.13 | 0.05 | 0.19 | 0.38 |
| 2 | 0.09 | 0.08 | 0.18 | 0.36 | 0.10 | 0.04 | 0.10 | 0.23 | |
| 3 | 0.12 | 0.08 | 0.24 | 0.43 | 0.25 | 0.09 | 0.27 | 0.61 | |
| Avg. | 0.10 | 0.08 | 0.21 | 0.39 | 0.16 | 0.06 | 0.19 | 0.41 | |
| RSD, % | 12.0 | 10.2 | 13.8 | 9.8 | 42.0 | 37.3 | 37.1 | 38.6 | |
| White-edged grouper | 1 | 0.04 | 0.08 | 0.07 | 0.19 | 0.06 | 0.07 | 0.08 | 0.21 |
| 2 | 0.03 | 0.09 | 0.07 | 0.19 | 0.04 | 0.05 | 0.04 | 0.13 | |
| 3 | 0.05 | 0.07 | 0.10 | 0.21 | 0.12 | 0.11 | 0.12 | 0.35 | |
| Avg. | 0.04 | 0.08 | 0.08 | 0.19 | 0.07 | 0.07 | 0.08 | 0.23 | |
| RSD, % | 20.7 | 11.9 | 21.7 | 7.4 | 47.4 | 35.7 | 39.6 | 40.6 | |
a Average and RSD, % were calculated from three data points produced from three injections of the same test solution. The NIHS used the reported method (23), whereas JFRL used the present method. The absence of CTX3C and 49-epiCTX3C in fish from Okinawa agrees with the report in the literature (12, 23). The abbreviations are the same as in Figure 9.
In this study extensive efforts were devoted to overcoming the variations imparted by different SPE cartridges, and in particular, from the Florisil columns. Attention has also been paid to instrument‐derived variations, such as the use of different models, maintenance conditions, and sample storage conditions. In terms of the LC-MS/MS system, attention should be paid to the electron multiplier (EM) horn, which should be changed before the EM value reaches the maximum threshold, and before application of the method.
In addition, the qNMR-calibrated toxins served as excellent tools to evaluate the performance of the analytic methods. Indeed, the limited amounts of standards available indicate the need for continued efforts to produce pure toxins.
Thus, using purified toxins, we successfully developed and validated a quantitative LC-MS/MS method to determine the CTXs present in fish sourced from the Pacific Ocean. To attain maximum sensitivity and accuracy, we rigorously examined all the steps starting from the initial extraction through to the partition conditions, including any variations in charge, elution solvents for the SPE cartridges, injection volumes, LC column washes, and finally, mobile phase buffer. The LODs attained for CTX1B, 51-hydroxyCTX3C, and CTX3C were 0.004, 0.005, and 0.009 µg/kg, respectively. Using mouse toxicity data (5), the CTX1B equivalents (µg/kg) calculated for CTX1B, 51-hydroxyCTX3C, and CTX3C are 0.004, 0.0065, and 0.0018. While the FAO–WHO expert meeting reported (5) “both the FDA and EFSA have proposed a fish CTX concentration of 0.01 µg/kg CTX1B as being unlikely to elicit symptoms of CFP. This concentration is just below the lowest concentrations seen in fish samples associated with CFP cases (0.02 µg/kg CTX1B equivalents).”
These results, therefore, indicate that the present method practically meets the required levels for toxin determination. More specifically, the parameters determined for the method performance meet the acceptable ranges proposed by AOAC and Codex as global standards (27, 28). The contribution of the present method also has potential to extend beyond food safety considerations and provide deeper insights into ciguatera. Moreover, the regional variations in the toxin profiles can depict the differences in the genotypic clones of G. toxicus and enable tracking of the environmental effects on the population based on the toxin strains, in addition to providing basic information for the application of enzyme-linked immunosorbent assays. Ideally, the rapid progress of the modern technological development will enable such ultra-sensitive quantification to be carried out with ease.
The standard toxins produced and quantified by qNMR at the JFRL can be made available, upon request, to the relevant institutions.
Acknowledgments
We thank K. Fujita and T. Yokozeki of the Technological Innovation Team at the JFRL for their technical assistance for the purification and/or LC-MS/MS detection of the CTXs.
Conflict of Interest
We declare that all authors have no conflicts of interest which may raise any questions of bias in this work and in this article's conclusions, implications, or opinions.
References
- 1. Yasumoto T. (2001) Chem. Rec. 1, 228–242 [DOI] [PubMed] [Google Scholar]
- 2. Costa P.R., Estevez P., Castro D., Soliño L., Gouveia N., Santos C., Rodrigues S.M., Leao J.M., Gago-Martínez A. (2018) Toxins 10, 524–533 [DOI] [PMC free article] [PubMed] [Google Scholar]
- 3. Estevez P., Castro D., Leao M., Yasumoto T., Dickey R., Gago-Martinez A. (2019) Food Chem. 280, 8–14 [DOI] [PubMed] [Google Scholar]
- 4. Oshiro N., Tomikawa T., Kuniyoshi K., Kimura K., Kojima T., Yasumoto T., Asakura H. (2021) Shokuhin Eiseigaku Zasshi 62, 8–13 [DOI] [PubMed] [Google Scholar]
- 5.FAO & WHO (2020) Report of the Expert Meeting on Ciguatera Poisoning, Food and Agriculture Organization of the United Nations (FAO), Rome, 19–23 November 2018, http://www.fao.org/3/ca8817en/ca8817en.pdf
- 6. Yasumoto T., Nakajima I., Bagnis R., Adachi R. (1977) Sci. Fish. 43, 1021–1026 [Google Scholar]
- 7. Murata M., Legrand A.M., Ishibashi Y., Yasumoto T. (1989) J. Am. Chem. Soc. 111, 8929–8931 [Google Scholar]
- 8. Murata M., Legrand A.M., Ishibashi Y., Fukui M., Yasumoto T. (1990) J. Am. Chem. Soc. 112, 4380–4386 [Google Scholar]
- 9. Satake M., Murata M., Yasumoto T. (1993) Tetrahedron Lett. 34, 1975–1978 [Google Scholar]
- 10. Yasumoto T., Igarashi T., Legrand A.M., Cruchet P., Chinain M., Fujita T., Naoki H. (2000) J. Am. Chem. Soc. 122, 4988–4989 [Google Scholar]
- 11. Mak Y.L., Wai T.C., Murphy M.B., Chan W.H., Wu J.J., Lam J.C., Chan L.L., Lam P.K. (2013) Environ. Sci. Technol. 47, 14070–14079 [DOI] [PubMed] [Google Scholar]
- 12. Yogi K., Oshiro N., Inafuku Y., Hirama M., Yasumoto T. (2011) Anal. Chem. 83, 8886–8891 [DOI] [PubMed] [Google Scholar]
- 13. Chinain M., Gatti C.M., Ung A., Cruchet P., Revel T., Viallon J., Sibat M., Varney P., Laurent V., Hess P., Darius H.T. (2020) Toxins 12, 759–788 [DOI] [PMC free article] [PubMed] [Google Scholar]
- 14. Satake M., Ishibashi Y., Legrand A.M., Yasumoto T. (1996) Biosci. Biotechnol. Biochem. 60, 2103–2105 [DOI] [PubMed] [Google Scholar]
- 15. Legrand A.M., Fukui, M., Cruchet M.P., Yasumoto T. (1992) Bull. Soc. Path. Ex. 85, 467–469 [PubMed] [Google Scholar]
- 16. Vetter I., Touska F., Hess A., Hinsbey R., Sattler S., Lampert A., Sergejeva M., Sharov A., Collins L.S., Eberhardt M., Engel M., Cabot P.J., Wood J.N., Vlachová V., Reeh P.W., Lewis R.J., Zimmermann K. (2012) Embo J. 31, 3795–3808 [DOI] [PMC free article] [PubMed] [Google Scholar]
- 17. Tsukamoto T., Chiba Y., Wakamori M., Yamada T., Tsunogae S., Cho Y., Sakakibara R., Imazu T., Tokoro S., Satake Y., Adachi M., Nishikawa T., Yotsu-Yamashita M., Konoki K. (2017) Br. J. Pharmacol. 174, 3881–3892 [DOI] [PMC free article] [PubMed] [Google Scholar]
- 18.U.S. Food and Drug Administration (2020) Fish and Fishery Products Hazards and Controls Guidance, Fourth Ed., https://www.fda.gov/media/80637/download
- 19.European Food Safety Authority (EFSA) Panel on Contaminants in the Food Chain (2010) EFSA J. 8, 1627. [DOI] [PMC free article] [PubMed] [Google Scholar]
- 20.EuroCiguaProject (2016-2021), https://www.aesan.gob.es/AECOSAN/web/ciguatera/ampliacion/seminario.htm
- 21. Hoffman P.A., Granade H.R., McMillan J.P. (1983) Toxicon 21, 363–369 [DOI] [PubMed] [Google Scholar]
- 22. Pritt S.L., Hammer R.E. (2017). Comp. Med. 67, 101–105 [PMC free article] [PubMed] [Google Scholar]
- 23. Yogi K., Sakugawa S., Oshiro N., Ikehara T., Sugiyama K., Yasumoto T. (2014) J. AOAC Int. 97, 398–402 [DOI] [PubMed] [Google Scholar]
- 24. Schenck F.J.W., Calderon L., Saudarg D.E. (1996) J. AOAC Int. 79, 1454–1458 [PubMed] [Google Scholar]
- 25. Kato T., Yasumoto T. (2017) Mar. Drugs 15, 309–320 [DOI] [PMC free article] [PubMed] [Google Scholar]
- 26. Oshiro N., Yogi K., Asato S., Sasaki T., Tamanaha K., Hirama M., Yasumoto T., Inafuku Y. (2010) Toxicon 56, 656–661 [DOI] [PubMed] [Google Scholar]
- 27.CODEX ALIMENTARIUS COMMISSION PROCEDURAL MANUAL (2007) Twenty-seventh edition, p. 78-83, Table 1: Guidelines for establishing numeric values for the criteria: less than 1 µg/kg, average recovery 40-120%, Table 2: Precision requirement at different concentrations based on the Horwitz/Thompson equation. RSDr ca. 22% which is inferred from RSDR less than 44%
- 28.GUIDELINES FOR DIETARY SUPPLEMENTS AND BOTANICALS AOAC OFFICIAL METHODS OF ANALYSIS (2012), Appendix K, p. 8, 3.4.1 Accuracy, 3.4.2 Repeatability Precision (sr, RSDr): for less than 10 µg/kg, average recovery 70-125%, RSDr ca. 15%


