Abstract
Background
Despite the use of aggressive multimodality treatment, most anaplastic thyroid carcinoma (ATC) patients die within a year of diagnosis. Although the combination of BRAF and MEK inhibitors has recently been approved for use in BRAF-mutated ATC, they remain effective in a minority of patients who are likely to develop drug resistance. There remains a critical clinical need for effective systemic agents for ATC with a reasonable toxicity profile to allow for rapid translational development.
Material and Methods
Twelve human thyroid cancer cell lines with comprehensive genomic characterization were used in a high-throughput screening (HTS) of 257 compounds to select agents with maximal growth inhibition. Cell proliferation, colony formation, orthotopic thyroid models, and patient-derived xenograft (PDX) models were used to validate the selected agents.
Results
Seventeen compounds were effective, and docetaxel, LBH-589, and pralatrexate were selected for additional in vitro and in vivo analysis as they have been previously approved by the US Food and Drug Administration for other cancers. Significant tumor growth inhibition (TGI) was detected in all tested models treated with LBH-589; pralatrexate demonstrated significant TGI in the orthotopic papillary thyroid carcinoma model and 2 PDX models; and docetaxel demonstrated significant TGI only in the context of mutant TP53.
Conclusions
HTS identified classes of systemic agents that demonstrate preferential effectiveness against aggressive thyroid cancers, particularly those with mutant TP53. Preclinical validation in both orthotopic and PDX models, which are accurate in vivo models mimicking tumor microenvironment, may support initiation of early-phase clinical trials in non-BRAF mutated or refractory to BRAF/MEK inhibition ATC.
Keywords: high-throughput screening, patient-derived xenograft, (PDX) model, LBH-589, anaplastic thyroid carcinoma
Thyroid cancer is the most common endocrine malignancy and its incidence continues to rise in both men and women (1). Estimated new thyroid cancer cases in women and men are 32 130 and 12 150, respectively, in 2021, compared to 9100 and 3400 in 1992, respectively (2,3). The age adjusted incidence of thyroid cancer increased more than 3.8-fold to near 14 per 100 000 between 1973 and 2015 (4). Papillary thyroid carcinoma (PTC) and follicular thyroid carcinoma are well-differentiated tumors and represent the most common thyroid cancer subtypes with good overall prognosis and response to treatment (5). However, a subset of these well-differentiated tumors progress to more aggressive poorly differentiated (PDTC) and anaplastic thyroid carcinoma (ATC). PDTC and ATC represent a major clinical challenge due to the poor therapeutic outcomes with a median survival of less than 12 months in the majority of patients, despite the use of aggressive multimodality treatment (ie, surgery, radiation, chemotherapy, and/or targeted therapy) (6,7).
The identification and development of novel systemic agents is rarely driven by focusing on ATC alone; rather ATC is routinely incorporated into basket trials based on genomic and epigenetic events (8). This is precisely how the BRAF-MEK combination gained clinical traction in the context of ATC (9). However, despite substantial initial antitumor activity, most patients develop resistance to treatment over time, consistent with findings in other solid tumors such as melanoma (10). This presents a significant problem because translational efforts in basket trials cannot proceed with sufficient focus to identify novel and effective ATC targets.
Multiple studies published over the last decade have now provided a comprehensive picture of the genomic, epigenetic, and transcriptional program that accompanies ATC development (11,12). Unfortunately, to date, ATC tumors have not demonstrated targetable mutations sufficiently distinct from other tumors (13,14). Thus, we must reassess and reorient translational efforts for ATC. One approach is to evaluate the broad array of currently available agents with antisolid tumor activity, which may demonstrate substantial efficacy in PDTC and ATC with already- established safety profiles (ie, drug repurposing).
Most previous drug identification and preclinical testing efforts in the context of ATC have been restricted by several deficiencies including (1) limited availability of validated human cell lines with a known genomic and epigenetic background, (2) limited utilization of orthotopic models, and (3) limited availability of relevant patient-derived xenograft (PDX) models (15). All 3 of these factors can severely impact the ability to identify promising systemic agents, both due to false-positive and false-negative results. For example, when targeted therapies such as inhibitors of BRAF, EGFR, or ALK are tested in cancer cells lacking BRAF, EGFR, or ALK alterations, respectively, they are ineffective. However, these inhibitors are markedly effective in cancer cell lines, animal models, and human patient tumors bearing the corresponding genomic alteration. This is demonstrated by the distinct efficacy of BRAF inhibitors in tumors that harbor BRAF mutations. Evaluating such inhibitors in a limited panel of wild-type BRAF expressing cell lines would have easily generated a false negative result.
The increasing availability of both well-characterized PDTC and ATC human cell lines as well as increasing stocks of PDX models, allows us to effectively identify drugs for the deadly diseases. In this study, we utilized high-throughput drug screening (HTS) as an initial filter for subsequent preclinical testing and drug validation in PTC, PDTC, and ATC (16). Our group has generated and authenticated a large panel of PTC, PDTC, and ATC cell lines along with 2 ATC PDX models (17-19). They were used to perform a hierarchical preclinical drug screen and validation, leveraging the complexity built into these preclinical models.
Materials and Methods
Cell Lines
Twelve human thyroid cancer cell lines were included in this study (ATC n = 7, PDTC n = 1, and PTC n = 4). MDA-T85 (ATCC Cat# CRL-3354, RRID: CVCL_QW84) (https://web.expasy.org/cellosaurus/CVCL_QW84) (17), MDA-T178, MDA-T187 (RRID: CVCL_A1CS) (https://web.expasy.org/cellosaurus/CVCL_A1CS), and MDA-T192 were generated from tumors obtained from patients who underwent surgical treatment at The University of Texas MD Anderson Cancer Center (MDACC). MDA-T178 and MDA-T187 were derived from 78- and 74-year-old women, respectively, with a histopathologic diagnosis of ATC. MDA-T192 was derived from a metastatic paratracheal lymph node in a 65-year-old woman with PDTC. The surgical specimens were tested histopathologically to confirm the diagnosis, and single-cell suspension was generated as previously described (17). Genomic DNA was extracted from frozen tissue and cell lines using the Gentra Puregene kit (Qiagen # 158667). Short tandem repeat (STR) analysis for each cell line and its matching tissue was performed at the Characterized Cell Line Core Facility at MDACC. These STR profiles were then compared with those in the ATCC, the DSMZ, the JCRB, the RIKEN (RRID:SCR_001065), and the MDA databases for possible matches. The TPC-1 cell line (RRID:CVCL_6298) was kindly provided by Dr. Jerome Hershman (VA Greater Los Angeles Healthcare System, Los Angeles, CA, USA). The K2 cell line was provided by Dr. D. Wynford-Thomas (Cardiff University, Cardiff, UK). Hth7 (RRID:CVCL_6289), Hth104 (RRID:CVCL_A427), SW1736 (CLS Cat# 300453/p463_SW-1736, RRID:CVCL_3883), and U-Hth83 (RRID:CVCL_0046) were kindly provided by Dr. Jeffrey Myers (MDACC). The BCPAP cell line (DSMZ Cat# ACC-273, RRID:CVCL_0153) was purchased from DSMZ (Braunschweig, Germany). The 8505C cell line (TKG Cat# TKG 0439, RRID:CVCL_1054) was purchased from European Collection of Authenticated Cell Cultures. Cells from TPC-1, MDA-T85, MDA-T178, MDA-T187, MDA-T192, U-Hth83, and Hth104 were maintained in RPMI1640 medium (Sigma-Aldrich R8758) containing 10% fetal bovine serum (Sigma-Aldrich F0926), nonessential amino acid mixture (Cambrex BioScience MT25025CI), 1 mM sodium pyruvate (Fisher Scientific MT25000CI), and 2 mM L-glutamine in a 37°C incubator supplied with 95% air and 5% CO2. K2 cells were maintained in Dulbecco's modified eagle medium/nutrient mixture F-12 medium (Sigma-Aldrich D8062) containing 10% fetal bovine serum and 2 mM L-glutamine. BCPAP cells were maintained in RPMI1640 medium containing 10% fetal bovine serum and 2 mM L-glutamine. Hth7 and SW1736 cells were maintained in minimum essential medium (Cambrex BioScience MT10010CV) containing 10% fetal bovine serum, nonessential amino acid mixture, 1 mM sodium pyruvate, and 2 mM L-glutamine. 8505C cells were maintained in minimum essential medium containing 10% fetal bovine serum, nonessential amino acid mixture, and 2 mM L-glutamine.
Screening Library
HTS of 257 agents was performed at the Gulf Coast Consortium’s Combinatorial Drug Discovery Program at the Institute of Biosciences and Technology, Texas A&M University Health Science Center. The library includes 112 agents from the National Cancer Institute Approved Oncology Set V (NCI_AOD5) collection; the remaining 145 agents were acquired from commercial suppliers and assembled by Institute of Biosciences and Technology scientists to cover a wide range of potential targets. These agents were predominantly US Food and Drug (FDA)-approved agents and investigational compounds. All agents were prepared in 100% dimethylsulfoxide (DMSO; Sigma-Aldrich D2650) at a stock concentration of 10 mM.
High-throughput Screening Assay
As performed previously (20), a total of 500 to 1000 cells of each cell line were suspended in 50 µL of medium per well and seeded into Greiner Black 384-well µClear plates using a Multidrop Combi liquid dispenser (ThermoFisher Scientific). The plates were kept at room temperature after seeding for 40 to 60 min prior to placing them into a cell culture incubator to form a monolayer overnight at 37°C in a humidified chamber with 95% air and 5% CO2. After recovery, 50 nL of the agent was transferred into the wells using an Echo 550 acoustic dispensing platform (Labcyte). Cells from an untreated plate were fixed with 0.4% paraformaldehyde (Fisher Scientific #31901) and cell nuclei were stained with 4’,6-diamidino-2-phenylindole (Sigma-Aldrich MBD0015) at the time of agent addition (Day 0) to provide the number of cells present per well at the time of treatment. In the primary screen, 3 concentrations were tested (0.01, 0.1, and 1 µM) with a fixed volume of DMSO (0.1% v/v) in replicates. Each assay plate contained a fixed concentration of the agents in addition to a negative control (0.1% DMSO), 2 positive controls [10 µM of cisplatin (Pharmachemie B.V #2962769) and carboplatin (Selleckchem S1215)], and an 8-point dose-response curve of the positive controls. After a 72-h incubation with the agents, cells were fixed and nuclei were stained with 4’,6-diamidino-2-phenylindole using an integrated Hydrospeed plate washer (Tecan Life Sciences) and Multidrop Combi dispenser. Plates were imaged on an IN Cell Analyzer 6000 laser-based confocal imaging platform (General Electric Healthcare Bio-Sciences), and nuclei were counted using the algorithms developed using the IN Cell Developer Toolbox software (version 1.6).
Statistical Analyses
Statistical analysis of assay performance was performed in accordance with the National Center for Advancing Translational Sciences Assay Guidance Manual (21). Briefly, a running statistical evaluation was performed on each plate throughout the course of the screening campaign to evaluate the consistency of results. Metrics evaluated included the rate of growth of the negative controls, the coefficient of variance of the positive and negative controls, and assay robustness determined from the Z’ statistic. Assay reproducibility and experimental drift were determined using the minimum significance ratio calculated from the standard deviation of IC50 values of the on-plate positive control dose-response curves. Pharmacologic data was normalized using the growth adjustment formula proposed by the Hafner et al (22):
where x(c) was defined as the observed cell count at the end of the assay, x0 is the median cell count at the time of treatment (Day 0), and xneg is the median cell count of the negative control at the end of the assay. This method of normalization effectively removed alterations in the rate of growth, allowing for more effective comparisons between cell lines and differentiated cytotoxic from cytostatic effects.
To identify the most effective agents in each individual cell line, we selected those agents with maximal growth inhibition at each dose level (top 25th percentile) and subsequently used the nonparametric Mann-Whitney U test to compare the normalized index with other agents and controls. P-values less than 0.05 were considered statistically significant. Furthermore, pharmacologic dose-response data was summarized as an area under the curve value calculated by numerically integrating growth-adjusted values described in the concentration-response curves. The data were fitted against a cascade of nonlinear regression models, each with different initialization criteria, to identify the best fit using a combination of R (Pipeline Pilot, RRID:SCR_014917 (https://scicrunch.org/resources/Any/search?q=SCR_014917&l=SCR_014917), Dassault Systemes/Biovia, Vélizy-Villacoublay, France) software platforms. Mechanistic clustering was performed by merging pharmacologic data with an in-house database of mechanistic annotations. The core maintains a MySQL database of all compounds used. All our collections are from commercial sources. When a collection is purchased, the vendor supplies a file that contains the identification and location of every compound purchased; that is how we know which compounds match to which result, making it a 1:1 relationship. Most commercial vendors supply additional information such as known targets for each of the compounds when known. When this information is available, we include it within our internal database. We have, for certain projects, manually curated the metadata for the compounds screened through a literature review using PubMed and other online data sources such as the PubChem, PubChem Identifier Exchange Service, Drug Bank, ChEMBL, ChemSpider, FDA, and DTP. We have attempted to record literature- or vendor-supported Target Class, Target(s), Process, and Pathway information to help us cluster compounds into particular drug classes or signaling pathways. These data were then used to generate a factorized adjacency matrix that was subsequently rendered as a minimum spanning tree using the cluster, visNetwork, and Intergraph packages in R package implementing methods. Subsequent to the identification of agents with maximal growth inhibition in each cell line, we performed a confirmatory test for these agents using 8-point dose-response curves.
IC50 and Colony Formation Analysis
To determine the IC50 of each agent, cells (0.3 − 1 × 10⁴) were plated in 48-well plates (Fisher Scientific #12-565-322) with 1 mL of medium in a 37°C incubator supplied with 95% air and 5% CO2. Docetaxel (Accord Healthcare #00955-1020-01), LBH-589 (Selleckchem S1030), and pralatrexate (Selleckchem S1497) were added to cells 24 h later and incubated for 72 h at varying concentrations (6 replicates). We selected these 3 drugs because of successful growth inhibition in the tested cell lines used in the initial high throughput screening assay as well as the potential for future clinical implementation. MTT (Thiazoyl Blue Tetrazolium Bromide; VWR # 97062-380) dissolved in 0.8% NaCl solution (Sigma-Aldrich D8537) at 2 mg/mL was added to each well (0.1 mL) and incubated at 37°C for 4 h. The liquid was then aspirated from the wells and discarded. Stained cells were dissolved in 0.5 mL of DMSO and their absorption at 570 nm was measured using a SPECTROstar or CLARIOstar plate reader. IC50 was determined using Prism 8.0 software.
For colony formation analysis, 100 or 200 cells were plated in 6-well plates (Fisher Scientific #087721B) in triplicate. The test agents were added to wells after 24 h and was then further incubated for 72 h. Fresh media were then added to cells and incubated for an additional 5 to 7 days in an incubator supplied with 95% air and 5% CO2 at 37°C. Colonies were stained with 0.05% crystal violet (Sigma-Aldrich C6158) in 10% buffered formalin (Fisher Scientific SF1004) and counted. Figures were generated using Prism 8.0 software.
In Vivo Testing of Selected Agents
All animal experiments were performed in accordance with protocols approved by the institutional review board and the Institutional Animal Care and Use Committee. Immunodeficient athymic nu/nu mice (Envigo #069) were used for the orthotopic (23) and PDX models. PDX models were generated from patients’ surgical specimens implanted directly in the flank of the mice (G0). Once the tumor reached 1000 mm3, it was subsequently expanded to additional mice for a total of 3 times (G1 to G3) to be deemed successfully established. MDA-ATC1 (19) was developed from the same ATC patient specimen used to generate the MDA-T187 cell line. MDA-ATC5 was developed from a 59-year-old man with ATC. Tumors were STR analyzed to confirm match to DNA from patient’s tissues. Once tumors were established, mice were randomized into groups. Five treatments with 5 mg/kg docetaxel diluted in 0.8% NaCl and 20 mg/kg pralatrexate dissolved in 2% DMSO and 48% polyethylene glycol (PEG) 300 (Sigma-Aldrich #202371) were given once every 3 days by intraperitoneal injection. LBH-589 (dissolved in 2% DMSO + 48% PEG 300) was given daily for 5 days at 20 mg/kg (first cycle), followed by a rest period of 2 days, and then daily for 5 days at 10 mg/kg (second cycle), by intraperitoneal injection (24). Control mice for docetaxel were treated with 0.8% NaCl, while the LBH-589 and pralatrexate control mice were treated with 2% DMSO + 48% PEG 300. Tumor growth was monitored by Xenogen (IVIS 200 imaging system, Caliper Life Sciences, Hopkinton, MA, USA) in the presence of D-luciferin (Fisher Scientific L2912) using Living Image 3.0 software for orthotopic models. Tumor volume was measured by caliper for PDX models and calculated using the formula (V = length × width × depth).
Mitotic Count and Immunohistochemistry
The tumor specimens from orthotopic and PDX models were collected and fixed in 10% neutral buffered formalin. Fixed tissues were processed into 5 μm thick sections, stained with hematoxylin and eosin, and examined microscopically by a head and neck pathologist using a BX41 Olympus microscope (Olympus, Tokyo, Japan) and an Aperio (Leica Biosystems, Wetzlar, Germany) digital image scanner. Mitotic count was determined as described previously (25). Briefly, 10 high-power fields were examined under microscope from hematoxylin- and eosin-stained slides, and mitotic tumor cells were counted. Immunohistochemistry (IHC) analyses were performed against human-specific Ki-67 (DAKO #M7240 or Cell Signaling Technology #9027) and cleaved caspase 3 (Cell Signaling Technology #9579). Diaminobenzidine was used as a chromogen for antigen localization. Ki-67 and cleaved caspase 3 positive tumor cells were counted manually from 6 and 4 high-power fields, respectively. The percentage of positive cells was calculated using the following formula: Total numbers of positive tumor cells/(Total numbers of positive tumor cells + Total numbers of negative tumor cells) × 100. Graphs were generated using Prism 8.0.
Results
Relative Drug Effectiveness as a Function of Dose and Tumor Mutational Status
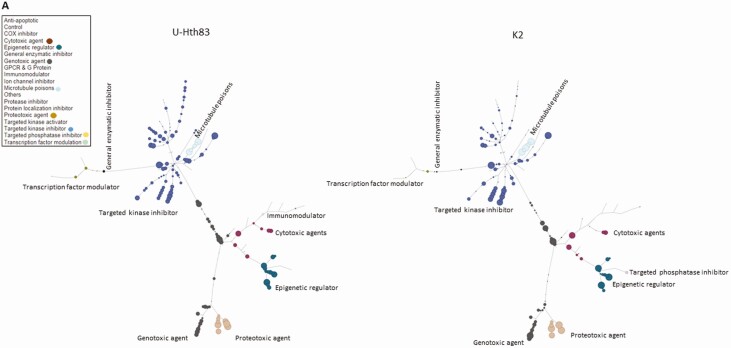
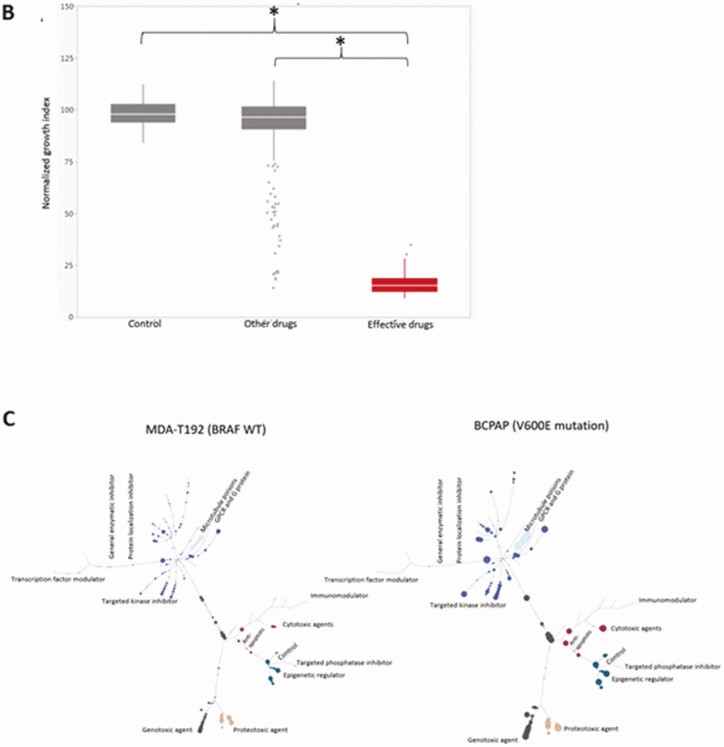
Twelve human thyroid cancer cell lines were used in this study including 7 ATC, 1 PDTC, and 4 PTC lines (BRAFV600E and TP53 mutational status summarized in Table 1). After HTS of 257 agents, we were able to identify the most effective compounds (based on their inhibition categories) for each cell line by a tree-structure analysis (Fig. 1A). Using this analysis, we identified relationships between thyroid cancer type, individual agent dose, and BRAFV600E and TP53 mutational status. For example, at 0.1 μM, the most effective classes of agents against ATC cell lines were antimetabolites, inducers of reactive of oxygen species (ROS), proteasome inhibitors, microtubule inhibitors, heat shock protein (HSP90) inhibitors, and polo-like kinase 1 inhibitors (Fig. 1B). At the lower 0.01 μM dose, only antimetabolites, proteasome inhibitors, and microtubule inhibitors remained effective. Similar to ATC, all tested PTC cell lines demonstrated sensitivity to proteasome inhibitors, microtubule inhibitors, ROS inducers, HSP90 inhibitors, targeted kinase inhibitors, and histone deacetylase inhibitors at 0.1 μM. However, only proteasome inhibitors and microtubule inhibitors remained effective at 0.01 μM. Several classes of agents including targeted kinase inhibitors, proteasome inhibitors, and microtubule inhibitors demonstrated activity regardless of BRAFV600E and TP53 mutational status. In addition, several classes including antimetabolites, HSP90 inhibitors, and ROS inducers exhibited activity regardless of the BRAF mutational status, while anthracenediones and HDAC inhibitors had preferential activity in wild-type (non-mutated) BRAF (Fig. 1C). HDAC inhibitors were effective in cell lines that exhibited wild-type TP53 status while antimetabolites and vinca alkaloids were most effective in the context of TP53 mutations.
Table 1.
Summary of cell lines and PDX models with their BRAF and TP53 mutational status
| Cancer type | Cell line/PDX | Name | BRAF | TP53 |
|---|---|---|---|---|
| PTC | Cell line | TPC-1 | WT | WT |
| Cell line | K2 | V600E | WT | |
| Cell line | BCPAP | V600E | D259Y | |
| Cell line | MDA-T85 | V600E | WT | |
| PDTC | Cell line | MDA-T192 | WT | WT |
| ATC | Cell line | MDA-T178 | WT | WT |
| Cell line | U-Hth83 | WT | Y236C and P153fs | |
| Cell line | Hth7 | WT | G245S | |
| Cell line | MDA-T187 | V600E | K132N | |
| Cell line | SW1736 | V600E | No expression, Q192a | |
| Cell line | Hth104 | V600E | No expression | |
| Cell line | 8505C | V600E | R248G | |
| PDX | MDA-ATC1 | V600E | K132N | |
| PDX | MDA-ATC5 | WT | WT |
The mutation status of BRAF and TP53 was determined by whole exome sequencing, Sequenom, or Sanger sequencing. The expression of TP53 in Hth104 cells was determined by Western blot analysis after failed Sanger sequencing. MDA-ATC1 was generated from the same patient who gave rise to MDA-T187 cell line and carrying the same BRAF and TP53 mutations as determined by whole-exome sequencing.
Abbreviations: ATC, anaplastic thyroid carcinoma; PDTC, poorly differentiated thyroid carcinoma, PDX, patient-derived xenograft; PTC, papillary thyroid carcinoma; WT, wild-type.
a Nonsense mutation.
Figure 1.
Analysis of HTS. (A) Tree analysis for U-Hth83 (left) and K2 (right) cells after HTS where the size of the colored data point dots represents relative effectiveness of each individual agent. A larger the dot indicates an increased effect. Each class with major effects were color coded for easier identification. (B) Boxplots of effective drugs in the initial screen at 0.1 μM concentration compared with DMSO (Control), other ineffective drugs, and the effective drugs. *P < 0.0001 for both. (C) A comparison of the activities of different classes of agents using tree analysis in a BRAFWT (MDA-T192) vs BRAFV600E mutated BRAF cell line (BCPAP).
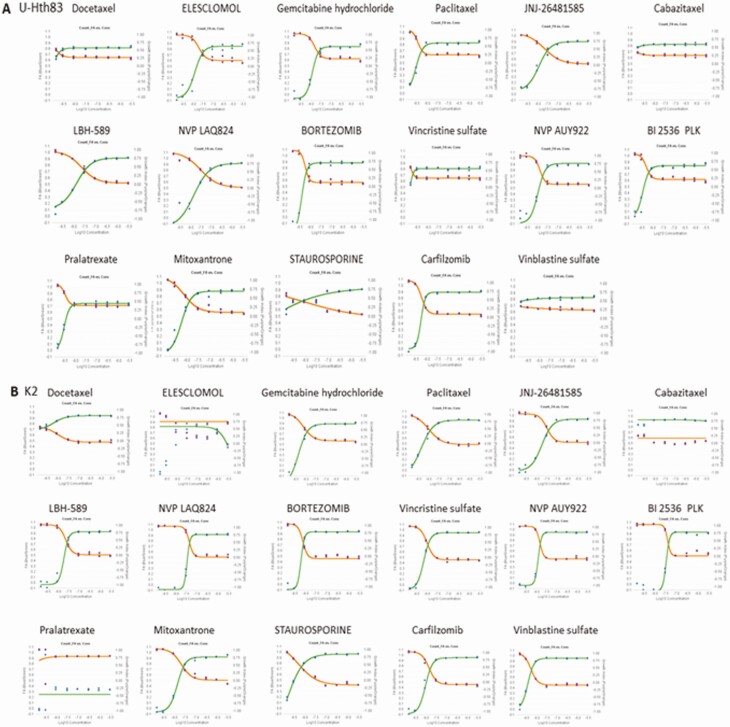
We selected 17 agents (Table 2) for further efficacy testing in all 12 cell lines (sample outputs for U-Hth83 and K2 cell lines can be found in Figure 2A and 2B, respectively). The selection criteria included the level of agent activity in the tested cell lines as well as persistent activity at lower concentrations. Most of the 17 agents selectively inhibited cell growth in a dose-dependent manner, except for cabazitaxel which did not show any change in the rate of cell growth in both the U-Hth83 and K2 cell lines. Vinblastine sulfate did not change the growth rate of U-Hth83 cells under any of the tested doses, while pralatrexate did not change the growth rate of K2 cells. All were consistent with the results from the initial screening (data not shown).
Table 2.
Agents selected for retesting
| Inhibition category | Agents |
|---|---|
| Antifolates | Pralatrexate |
| HDAC inhibitor | JNJ-26481585, LBH-589, NVP LAQ824 |
| HSP90 inhibitor | NVP AUY922 |
| Microtubule inhibitor | Cabazitaxel, docetaxel, paclitaxel, vinblastine sulfate, vincristine sulfate |
| PLK1 inhibitor | BI 2536 |
| Proteasome inhibitor | BORTEZOMIB, carfilzomib |
| Protein kinases inhibitor | STAUROSPORINE |
| Pyrimidine analog | Gemcitabine hydrochloride |
| ROS inducer | ELESCLOMOL |
| Topoisomerase inhibitor | Mitoxantrone |
Agents were selected after stringent statistical analysis from 257 potential candidates. They were listed by their inhibitory mechanisms.
Figure 2.
Confirmatory eight-point dose-response curves for selected agents against U-Hth83 (A) and K2 (B) cell lines. The green curves indicated the fraction of cells affected (FA) by the agents and the orange curves indicated the cell growth index (GI).
In Vitro Validation of Selected Compounds
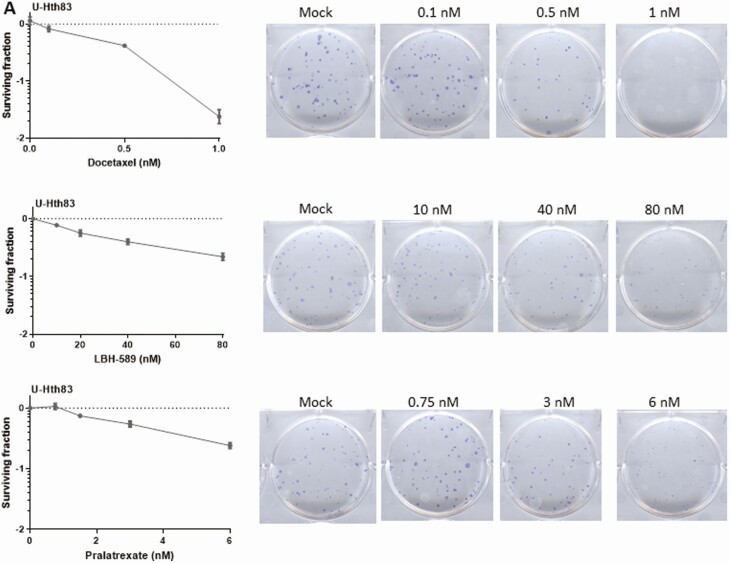
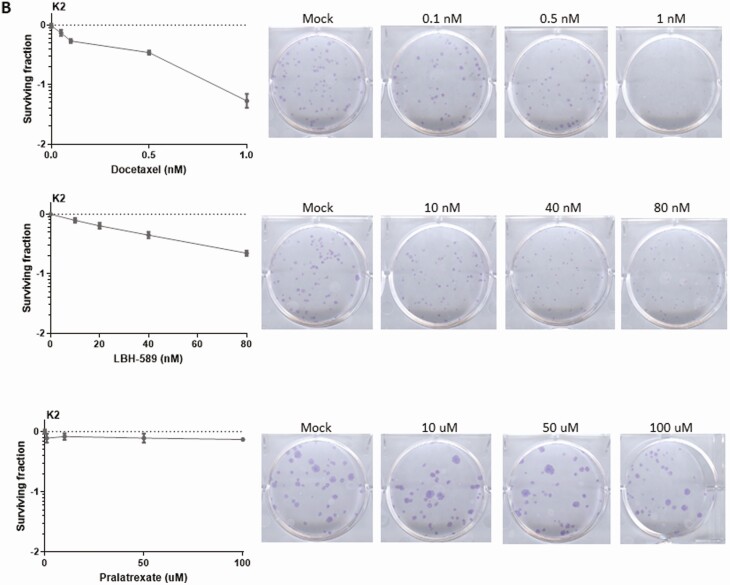
Three agents, consisting of a microtubule inhibitor (docetaxel) (26), an antifolate (pralatrexate) (27), and a HDAC inhibitor (LBH-589/Panobinostat) (28), were chosen to be further analyzed based on the screening data and their existing FDA approval for other nonthyroid cancers. Two thyroid cancer cell lines, U-Hth83 (ATC; BRAFWT, TP53P153fs) and K2 (PTC; BRAFV600E, TP53WT), were utilized for IC50 measurements, which were used to corroborate the HTS data (Table 3). To further validate the effects of the 3 agents in terms of growth inhibition, a colony formation assay was used in the U-Hth83 (Fig. 3A) and K2 cell lines (Fig. 3B). We found that all 3 agents were able to decrease the number of colonies formed in both cell lines in a dose-dependent manner at nanomolar concentrations, with the exception of pralatrexate in K2 cells.
Table 3.
IC50 of selected agents
| Cancer type | Cell line | Drug | Average IC50 (nM) |
|---|---|---|---|
| PTC | K2 | Docetaxel | 2.12 ± 0.54 |
| LBH-589 | 0.79 ± 0.54 | ||
| Pralatrexate | n/aa | ||
| ATC | U-Hth83 | Docetaxel | 1.02 ± 0.26 |
| LBH-589 | 0.06 ± 0.01 | ||
| Pralatrexate | 1.35 ± 0.11 |
To determine the IC50 of each agent, docetaxel, LBH-589, or pralatrexate were added to cells for 72 h at varying concentrations (6 replicates). Concentrations were selected based on the initial high throughput screening assay. After drug treatment, MTT (Thiazoyl Blue Tetrazolium Bromide) was added to stain cells followed by dimethylsulfoxide and absorption at 570 nm was measured using a SPECTROstar or CLARIOstar plate reader. IC50 was determined using Prism 8.0 software. Average IC50 was determined from 3 independent assays.
a not available: the IC50 was beyond the range of the cell proliferation assays (10 μM).
Figure 3.
Detecting cell growth by colony formation assay after docetaxel, LBH-589, and pralatrexate treatments. U-Hth83 (A) and K2 (B) cells (100 cells/well) were plated in 6-well plates in triplicates, and only 1 well was shown here as an example. Docetaxel, LBH-589, and pralatrexate at different concentrations were added to cells 24 h later for 72 h. After 72-h treatment, agents were removed and fresh media were added to cells. Cells were then incubated for up to 7 days without disturbance to allow colonies to grow. To visualize colonies, cells were stained with 0.05% crystal violet in 10% formalin. Controls were cells without agent treatment. Colony numbers were converted to surviving fractions by Prism after transforming colony numbers with log.
In Vivo Validation of Selected Compounds
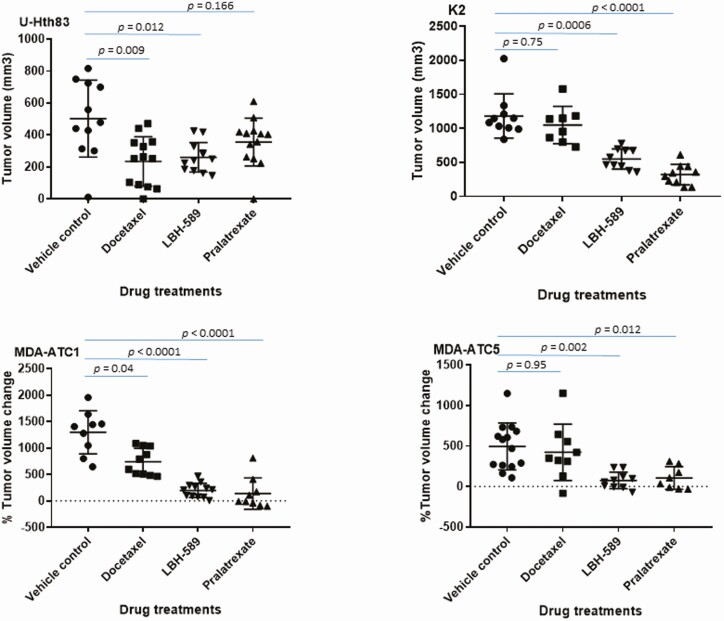
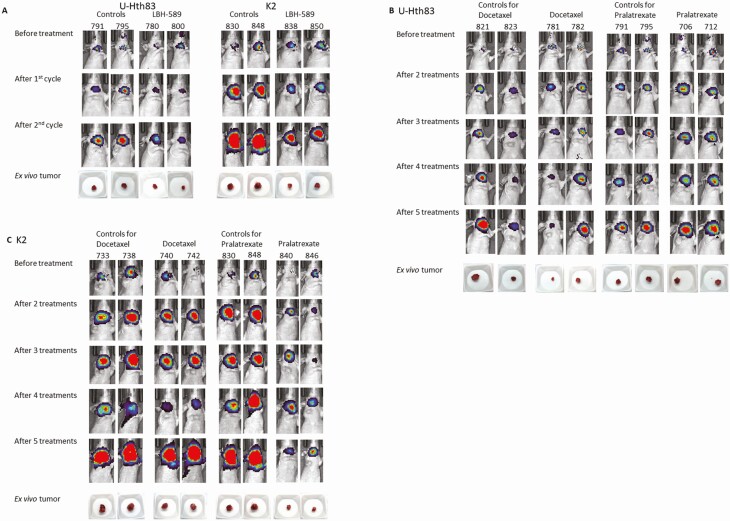
Docetaxel, pralatrexate, and LBH-589 antitumor activity was tested in orthotopic U-Hth83 or K2 tumors. LBH-589 significantly inhibited tumor growth in both U-Hth83 and K2 models (Figs. 4 and 5A). Docetaxel inhibited U-Hth83 tumor growth (Figs. 4 and 5B), while pralatrexate was able to inhibit K2 tumor growth (Figs. 4 and 5C). No significant changes in tumor volumes were detected in K2 mice treated with docetaxel and in U-Hth83 mice treated with pralatrexate. To further reinforce our findings in the orthotopic model, we tested the 3 agents in 2 ATC PDX models, MDA-ATC1 (BRAFV600E, TP53K132N), and MDA-ATC5 (BRAFWT, TP53WT) (Table 1). Significant tumor growth inhibition was detected in MDA-ATC1 and MDA-ATC5 following LBH-589 and pralatrexate treatments (Fig. 4), while docetaxel led to a significant tumor growth inhibition in MDA-ATC1.
Figure 4.
Suppressing tumor growth by docetaxel, LBH-589, and pralatrexate in orthotopic (top) and PDX (bottom) models. (Top) U-Hth83 (left) and K2 (right) cells carrying luciferase (5 × 10⁵) were injected into nude mice thyroid orthotopically and tumor growth was monitored by Xenogen twice a week. Treatment started on day 7 for vehicle control (12 mice for U-Hth83 and 10 mice for K2), 5 mg/kg docetaxel (13 mice for U-Hth83 and 8 mice for K2), and 20 mg/kg pralatrexate (13 mice for U-Hth83 and 10 mice for K2). Docetaxel and pralatrexate were given once every 3 days by intraperitoneal injection for total of 5 treatments. LBH-589 was given once a day for 5 days at 20 mg/kg (first cycle), rested for 2 days, and then once a day for 5 days at 10 mg/kg (second cycle) by intraperitoneal injection (12 mice for U-Hth83 and 10 mice for K2). Tumor volume (ex vivo) was calculated after mice were euthanized by caliber and graph was generated by Prism. P-values were calculated by Student’s t-test. (Bottom) PDX models of MDA-ATC1 (left) and MDA-ATC5 (right) were treated with docetaxel (10 mice for MDA-ATC1 and 9 mice for MDA-ATC5), LBH-589 (12 mice for MDA-ATC1 and 10 mice for MDA-ATC5), or pralatrexate (9 mice for MDA-ATC1 and 8 mice for MDA-ATC5). Vehicle controls were 10 mice for MDA-ATC1 and 16 mice for MDA-ATC5. The doses and treatment schedules for PDX models were the same as described for the orthotopic models. SubQ tumor was measured by caliber 2 to 3 times weekly. Percentage of tumor volume change was determined by correction with the starting tumor volume.
Figure 5.
Images of U-Hth83 and K2 orthotopic tumors by Xenogen and pictures of ex vivo tumors. Tumor cells (U-Hth83 or K2) were inoculated into mice thyroid orthotopically as described in Materials and Methods. Images of Xenogen were shown before treatment and after first and second cycles for LBH-589 or after 2-5 treatments for docetaxel and pralatrexate. Images of ex vivo tumors were shown underneath. Two mice from each group were shown here as examples. (A) LBH-589 treatment in both U-Hth83 and K2, (B) docetaxel and pralatrexate treatments in U-Hth83, (C) docetaxel and pralatrexate treatments in K2.
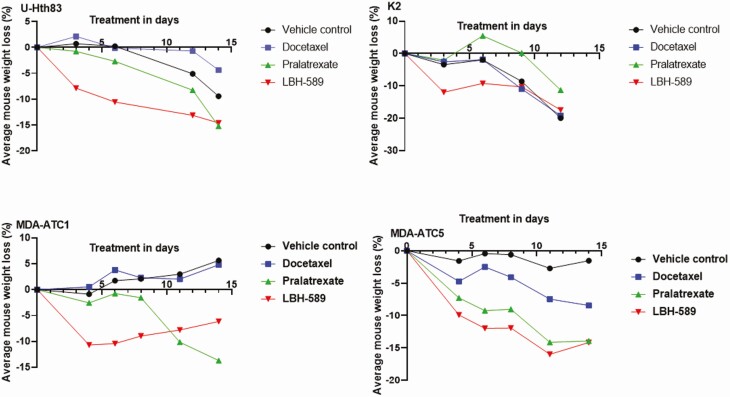
Agent toxicity evaluated as a function of changes in animal weight was moderate. LBH-589 significantly reduced mouse weight in all 4 mouse models by up to 12% after the first cycle of treatment at 20 mg/kg (Fig. 6), while pralatrexate significantly decreased mouse weight in the MDA-ATC5 mice. To ensure mice survival and complete our treatment plan, LBH-589 dosage was reduced to 10 mg/kg for the second cycle of treatment.
Figure 6.
Mice weights from orthotopic (top) and PDX (bottom) as a measurement of agent toxicity. (Top) mice inoculated with U-Hth83 (left) and K2 (right) cells orthotopically were weighed before agent treatments, 2 to 3 times weekly during treatment, and after all treatment. Percentage of average mouse weight loss was corrected with the mouse weight before treatment. (Bottom) mice weights from PDX models MDA-ATC1 (left) and MDA-ATC5 (right) were shown after correction from weight before treatment.
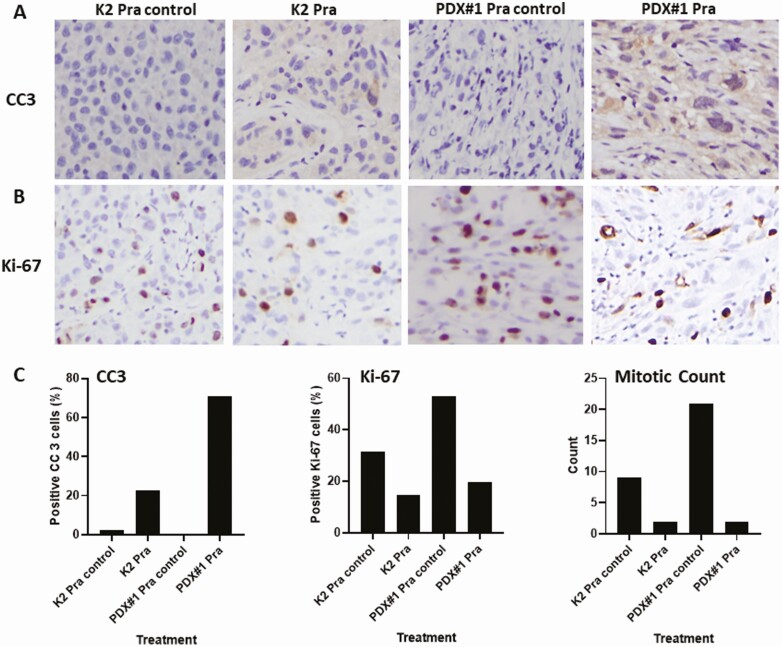
Orthotopic and PDX models were further examined for apoptosis after drug treatment through IHC of cleaved caspase 3 (Fig. 7A). Using pralatrexate as an example, we detected an increase in cleaved caspase 3 positive cells in both orthotopic (K2) and PDX (MDA-ATC1) models after drug treatment compared to controls. For proliferation of orthotopic and PDX models after drug treatment, IHC of Ki-67 (Fig. 7B) and mitotic count (Fig. 7C) were determined. IHC of Ki-67 demonstrated that the Ki-67–positive tumor cells decreased in both orthotopic (K2) and PDX models after pralatrexate treatment compared to controls (Fig. 7B). Mitotic count identified the number of cells undergoing mitosis and was used as a measurement of cell proliferation. We detected a dramatic decrease in mitotic count in both models after pralatrexate treatment when compared to control tumors (Fig. 7C). All of these results confirmed that after pralatrexate treatment tumor cells have a decreased proliferation and increased apoptosis in both orthotopic and PDX models, and these results supported our observation of a decrease in tumor volume.
Figure 7.
IHC of cleaved caspase 3 (CC3) as an indicator of apoptosis and IHC of Ki-67 and mitotic count as an indication of proliferation. Tumors from the orthotopic model K2 and the MDA-ATC1 PDX model (PDX#1) after treatment with pralatrexate are shown. All graphs were generated using Prism. IHC staining with CC3 (A) or Ki-67 (B) in K2 and PDX#1. (C) percentage of CC3 positive tumor cells (left) was counted from 4 high-power fields and calculated using the following formula: Total number of CC3 positive tumor cells/(Total number of CC3 positive tumor cells + Total number of negative tumor cells) × 100. Percentage of Ki-67 positive tumor cells (middle) was counted from 6 high-power fields and calculated using the same formula as for CC3. Mitotic count (right) was determined from 10 high-power fields.
Discussion
The potential of precision oncology is maximized in the context of “magic bullets,” compounds targeted to a specific protein that ideally is mutated or fused in a manner distinct from the normal variant. These compounds are subsequently matched to tumors demonstrating the target event (ie, mutation, fusion, amplification). BRAF inhibitors were first shown to have profound antitumor activity in the context of melanoma more than a decade ago (29,30). At the time, the short-term efficacy of BRAF inhibitors in the context of BRAF-mutant disease provided tremendous advancement in the treatment of a disease without any meaningful systemic option (29,30). However, tumors developed resistance bypassing BRAF through increased MEK activity (31). The combination of BRAF and MEK inhibitors of FDA-approved drugs for ATC (vemurafenib, dabrafenib, and trametinib) attacked this resistance mechanism, and the combinatorial approach has now become standard of care for patients with BRAF-mutated advanced melanoma, with excellent and fairly durable effects on progression-free and overall survival (32).
Variable therapeutic efficacy in a subset of tumors is largely a function of intrinsic tumor biology (33), which provides the principal rationale for basket trials. Although this is primarily applied to targeted agents such as BRAF inhibitors, intrinsic tumor biology can also drive response to conventional cytotoxic agents (34). We sought to leverage a broad preclinical platform for PDTC and ATC to identify and evaluate potentially effective systemic agents. Our findings demonstrate that HTS can effectively identify distinct classes of systemic agents that have a variable effect against thyroid cancer cell lines with variable histopathologic and mutational profiles. Although limited to 12 cell lines, this approach can be rapidly scaled to cell line banks in excess of 40 to 50 cell lines, providing a robust interface between relative drug effectiveness and molecular background as has been demonstrated by other groups (35). However, this represents simply a first step in a preclinical testing process that must support clinical trial development. In vitro screens fail to account for the significant modulatory effects of the tumor microenvironment, potentially generating false-positive and, more concerning, false-negative results, which could result in loss of potentially effective agent combinations (36-44). Variability of each mouse’s individual response to the tested agents was expected (45). In a recent study by Ghosh et al, following HTS, the effect of a BRAF inhibitor with a multitargeting TK inhibitor was analyzed and demonstrated their synergistic effect on 4 cell lines using both in vitro and in vivo (orthotopic) models. That study was limited to targeting BRAF-mutated disease, which only represents approximately 35% of the ATC population (46), and the HTS was composed of a select 32 drugs. In our study, the goal was to identify novel classes of drugs that would be useful against both BRAFV600E-mutated and wild-type ATC. HTS was augmented by in vitro validation, but most importantly, under in vivo conditions using the gold standard preclinical approach, which combines both orthotopic models with PDX models. Furthermore, 257 agents were used in the initial HTS, and we were able to identify the agents that showed potent activity against most cell lines. We validated the activity of a selected set of 17 agents after stringent statistical analyses that showed the strongest efficacy using a confirmatory 8-point dose-response curve. Three of the 17 agents were chosen for a more detailed analysis as they were already FDA-approved to treat nonthyroid cancers.
LBH-589 (HDAC inhibitor), approved for the treatment of multiple myeloma (28), was the most effective agent in terms of cell growth inhibition in vitro in both tested cell lines and in terms of tumor growth inhibition in vivo in all 4 mouse models (2 orthotopic and 2 PDX models). Combining our current findings with those of Catalano et al, we report significant antitumor LBH-589 effects in total of 5 distinct ATC cell lines in vitro, 3 xenograft models (1 flank and 2 orthotopic), and 2 PDX models, clearly making this agent a strong candidate for clinical trial consideration (47). LBH-589’s described effects on cell cycle arrest make it an excellent candidate for combinatorial strategies with radiation, currently a mainstay of ATC multimodality treatment (48,49).
Pralatrexate (antifolate/antimetabolite), approved for peripheral T-cell lymphoma (27), significantly inhibited tumor growth in both PDX models (MDA-ATC1 and MDA-ATC5) but did not consistently inhibit in vitro and in vivo growth in the human cell line models, making it potentially less attractive as a clinical agent. Although pralatrexate showed significant cell growth inhibition in U-Hth83 cells in vitro, U-Hth83 orthotopic tumor growth was not inhibited in vivo. Interestingly, the opposite was seen with the K2 cells where cell growth in vitro was not inhibited significantly, while inhibition occurred in the orthotopic tumor model. The selective inhibitory effect of pralatrexate in the K2 orthotopic tumors may be related to differences in the tumor microenvironment. As such, we cannot conclude that the inhibitory effect of pralatrexate was tumor-type specific or BRAF/TP53-mutation specific. Our results of proliferation and apoptosis after pralatrexate treatment confirmed that tumors have decreased proliferation and increased apoptosis in both orthotopic and PDX models when compared to controls. Since the mechanism of action for pralatrexate involves preferential accumulation in actively dividing cells inhibiting the function of critical enzymes involved in DNA synthesis and inducing cell death (27), these cellular functions are likely associated with other signaling transduction/metabolic pathways and are not dependent on BRAF and TP53.
Docetaxel (a microtubule inhibitor), approved for the treatment of multiple cancers including breast cancer, non-small cell lung cancer, and squamous cell carcinoma of the head and neck (26), effectively inhibited colony formation in both U-Hth83 and K2 cell lines but only managed to inhibit growth in the U-Hth83 orthotopic and MDA-ATC1 PDX models. Interestingly, both U-Hth83 and MDA-ATC1 have TP53 mutations, suggesting that docetaxel may have a selective effect. Functional TP53 was found to induce apoptosis in docetaxel-treated prostate cancer cells (50). Together with our findings, docetaxel may be targeting p53 signaling transduction pathway and regulating cell survival.
Significant toxicity measured by weight loss was expected in mice treated with LBH-589, as previously reported (28,47). LBH-589 treatment for our in vivo models started at 20 mg/kg for the first 5 days (first cycle) following the manufacturer’s recommendation (24). Significant weight loss was observed after the first cycle of treatment, which prompted us to reduce the dose to 10 mg/kg during the second cycle to ensure study completion and mouse survival. Similar weight loss with LBH-589 (8% at 20 mg/kg and 13% at 30 mg/kg) was also detected by Catalano et al when they treated mice with CAL-62 cells (ATC) injected subcutaneously (47), while increased mortality was observed at above 10 mg/kg in mice with graft-vs-host disease (28). Dose adjustments were not required for pralatrexate and docetaxel. In multiple myeloma patients treated with LBH-589, although weight loss per se was not one of the major side effects, diarrhea was found in 68% of patients vs 42% on placebo and vomiting in 26% of patients compared to 13% on placebo from the Phase III PANORAMA 1 trial (51).
Although HTS was effective for identifying agents for additional comprehensive testing, there are known limitations of in vitro HTS. Even when using robotic-based assays, there are technical challenges to screening large libraries of compounds across multiple cell lines, which is essential to account for genomic and epigenetic heterogeneity. However, these large-scale screening efforts may identify false-positive candidates. We addressed this possibility by using 4 distinct in vivo models (2 orthotopic and 2 PDX models), while employing large numbers of mice per test group (8-16 per group) to minimize potential experimental variations. Given the breadth of our cell line and PDX model inventory, we could match genetic backgrounds for the cell lines used in vitro and in vivo (orthotopic model) with the PDX models, making our overall agent discovery approach as robust as possible.
In conclusion, we report a comprehensive approach to identifying novel treatments for thyroid cancer, specifically ATC. Following HTS with 257 agents, we identified 3 candidate agents and performed extensive in vitro and in vivo analyses, culminating with a large-scale preclinical trial in 4 mouse models, 2 orthotopic and 2 PDX models. The HDAC inhibitor LBH-589 appeared to have the most effective tumor growth inhibition on thyroid cancer (both ATC and PTC regardless of BRAF and TP53 mutations in all 4 in vivo models). The inhibitory effect of docetaxel in vivo was specific for TP53-mutated tumors alone, while pralatrexate was effective in both ATC and PTC regardless of BRAF and TP53 mutation status. Our work demonstrates the feasibility of using this systematic approach for preclinical in vivo drug testing and potential combination with FDA-approved drugs in future. This platform provides an avenue for the identification of novel agents, validation, and resistance evaluation. Utilization of immunodeficient PDX models and immunocompetent murine models in the future facilitates personalized therapeutics development as a strong justification for proceeding to human clinical trials. Our study provides value to the field in 2 somewhat distinct, yet overlapping ways. First, it demonstrates that HTS can identify potentially effective compounds against the PTC-ATC disease spectrum, which have already been introduced into a clinical setting for other malignancies. This is important, because it can prompt clinicians to revisit “old” drugs using new combinatorial approaches, particularly by leveraging combinations of targeted (BRAFi) and nontargeted agents (ie, docetaxel) and through combinations with immune checkpoint inhibitors, which is in fact the current clinical strategy at our institution. Second, it identifies existing compounds (ie, HDAC inhibitors), which although not currently employed in clinical practice, may be a viable combinatorial strategy for early-phase, exploratory clinical trials with a reasonable toxicity profile. Following our methodology, others can employ similar approaches to identify novel classes of systemic agents for the treatment of ATC, as well as other malignancies.
Acknowledgments
We thank Dr. Jerome Hershman from VA Greater Los Angeles Healthcare System (Los Angeles, CA, USA) for providing TPC-1 cells; Dr. D. Wynford-Thomas from Cardiff University (Cardiff, UK) for providing K2 cells; Dr. Jeffrey Myers from MDACC for providing Hth7, Hth104, SW1736, and U-Hth83 cells; Dr. Ge Zhou for providing retrovirus carrying luciferase gene; Xuesong Li and Keri Sherman for providing STR profiling and Sequenom analyses; Viju Varghese for Sanger-based DNA sequencing; Mary Sobieski and Nghi Nguyen for high-throughput screening; MDACC DVMS Veterinary Pathology Services, MDACC Research Histology Core Laboratory, and Carol Johnston for histological services; and Deborah Rodriguez, Cynthia Steward, Norma Benavides, and Barbara Deleon for technical support.
Financial Support: This work was partly supported by the Cancer Prevention and Research Institute of Texas (CPRIT) grant (RP170366), Ohio State University/MD Anderson SPORE in Thyroid Cancer, an institutional Multi-investigator Research Program grant, and National Cancer Institute Cancer Center Support (CORE) Grant P30CA016672 for media production, DVMS Veterinary Pathology Services, Research Histology Core Laboratory, and cell line authentication, CPRIT grant (RP150578) for High Throughput Screening at IBT High Throughput Screening Core at Texas A&M Health Science Center, A.M. received a research grant from the Fonds de Recherche du Québec-Santé (FRQS) for ATC PDX model development. Donations were generously provided through Marty Schaffel, Kevin Weinrich, and other donors for papillary thyroid cancer, the Anaplastic Thyroid Cancer Research Fund, the Michael A. O’Bannon Endowment for Cancer Research, and the Petrick ATC Research Fund.
Glossary
Abbreviations
- ATC
anaplastic thyroid carcinoma
- HSP90
heat shock protein 90
- HTS
high-throughput screening
- IHC
immunohistochemistry;
- MDACC
The University of Texas MD Anderson Cancer Center
- PDTC
poorly differentiated thyroid carcinoma
- PDX
patient-derived xenograft models
- PEG
polyethylene glycol
- PTC
papillary thyroid carcinoma
- ROS
reactive of oxygen species.
Additional Information
Disclosures: M.Z. is the principal investigator for clinical trial funded by Merck. M.C. has received research fundings from Eisai, Exelixis, Kura Oncology, and Genentech and participated in advisory boards for LOXO and Ignyta in the past 2 years. F.J. has received research funding from PIQUR Therapeutics and Trovagene. The other authors declare no potential conflicts of interest.
Data Availability
Some or all data sets generated during and/or analyzed during the current study are not publicly available but are available from the corresponding author on reasonable request.
References
- 1. Siegel RL, Miller KD, Jemal A. Cancer statistics, 2019. CA Cancer J Clin. 2019;69(1):7-34. [DOI] [PubMed] [Google Scholar]
- 2. Boring CC, Squires TS, Tong T. Cancer statistics, 1992. CA Cancer J Clin. 1992;42(1):19-38. [DOI] [PubMed] [Google Scholar]
- 3. Siegel RL, Miller KD, Fuchs HE, Jemal A. Cancer Statistics, 2021. CA Cancer J Clin. 2021;71(1):7-33. [DOI] [PubMed] [Google Scholar]
- 4. Mao Y, Xing M. Recent incidences and differential trends of thyroid cancer in the USA. Endocr Relat Cancer. 2016;23(4):313-322. [DOI] [PMC free article] [PubMed] [Google Scholar]
- 5. Lewiński A, Adamczewski Z. Papillary thyroid carcinoma: a cancer with an extremely diverse genetic background and prognosis. Pol Arch Intern Med. 2017;127(6):388-389. [DOI] [PubMed] [Google Scholar]
- 6. Bhatia A, Rao A, Ang KK, et al. . Anaplastic thyroid cancer: Clinical outcomes with conformal radiotherapy. Head Neck. 2010;32(7):829-836. [DOI] [PubMed] [Google Scholar]
- 7. Maniakas A, Dadu R, Busaidy NL, et al. . Evaluation of overall survival in patients with anaplastic thyroid carcinoma, 2000-2019. JAMA Oncol 2020;6:1397-1404. [DOI] [PMC free article] [PubMed] [Google Scholar]
- 8. Redig AJ, Jänne PA. Basket trials and the evolution of clinical trial design in an era of genomic medicine. J Clin Oncol. 2015;33(9):975-977. [DOI] [PubMed] [Google Scholar]
- 9. Subbiah V, Kreitman RJ, Wainberg ZA, et al. . Dabrafenib and trametinib treatment in patients with locally advanced or metastatic BRAF V600-mutant anaplastic thyroid cancer. J Clin Oncol. 2018;36(1):7-13. [DOI] [PMC free article] [PubMed] [Google Scholar]
- 10. Iyer PC, Dadu R, Ferrarotto R, et al. . Real-world experience with targeted therapy for the treatment of anaplastic thyroid carcinoma. Thyroid. 2018;28(1):79-87. [DOI] [PMC free article] [PubMed] [Google Scholar]
- 11. Sasanakietkul T, Murtha TD, Javid M, Korah R, Carling T. Epigenetic modifications in poorly differentiated and anaplastic thyroid cancer. Mol Cell Endocrinol. 2018;469:23-37. [DOI] [PubMed] [Google Scholar]
- 12. Smith N, Nucera C. Personalized therapy in patients with anaplastic thyroid cancer: targeting genetic and epigenetic alterations. J Clin Endocrinol Metab. 2015;100(1):35-42. [DOI] [PMC free article] [PubMed] [Google Scholar]
- 13. Woodward EL, Biloglav A, Ravi N, et al. . Genomic complexity and targeted genes in anaplastic thyroid cancer cell lines. Endocr Relat Cancer. 2017;24(7):X2. [DOI] [PubMed] [Google Scholar]
- 14. Kasaian K, Wiseman SM, Walker BA, et al. . The genomic and transcriptomic landscape of anaplastic thyroid cancer: implications for therapy. BMC Cancer. 2015;15:984. [DOI] [PMC free article] [PubMed] [Google Scholar]
- 15. Schweppe RE. Thyroid cancer cell lines: critical models to study thyroid cancer biology and new therapeutic targets. Front Endocrinol 2012;3:81. [DOI] [PMC free article] [PubMed] [Google Scholar]
- 16. Phatak SS, Stephan CC, Cavasotto CN. High-throughput and in silico screenings in drug discovery. Expert Opin Drug Discov. 2009;4(9):947-959. [DOI] [PubMed] [Google Scholar]
- 17. Henderson YC, Ahn SH, Ryu J, et al. . Development and characterization of six new human papillary thyroid carcinoma cell lines. J Clin Endocrinol Metab. 2015;100(2):E243-E252. [DOI] [PMC free article] [PubMed] [Google Scholar]
- 18. Landa I, Pozdeyev N, Korch C, et al. . Comprehensive genetic characterization of human thyroid cancer cell lines: a validated panel for preclinical studies. Clin Cancer Res. 2019:25(10):3141-3151. [DOI] [PMC free article] [PubMed] [Google Scholar]
- 19. Maniakas A, Henderson Y, Hei H, et al. . Novel anaplastic thyroid cancer PDXs and cell lines: expanding preclinical models of genetic diversity. J Clin Endocrinol Metab. Published online June 2021. 10.1210/clinem/dgab453 [DOI] [PMC free article] [PubMed]
- 20. Kalu NN, Mazumdar T, Peng S, et al. . Comprehensive pharmacogenomic profiling of human papillomavirus-positive and -negative squamous cell carcinoma identifies sensitivity to aurora kinase inhibition in KMT2D mutants. Cancer Lett. 2018;431:64-72. [DOI] [PubMed] [Google Scholar]
- 21. Coussens NP, Sittampalam GS, Guha R, et al. . Assay guidance manual: quantitative biology and pharmacology in preclinical drug discovery. Clin Transl Sci. 2018;11(5):461-470. [DOI] [PMC free article] [PubMed] [Google Scholar]
- 22. Hafner M, Niepel M, Chung M, Sorger PK. Growth rate inhibition metrics correct for confounders in measuring sensitivity to cancer drugs. Nat Methods. 2016;13(6):521-527. [DOI] [PMC free article] [PubMed] [Google Scholar]
- 23. Ahn SH, Henderson Y, Kang Y, et al. . An orthotopic model of papillary thyroid carcinoma in athymic nude mice. Arch Otolaryngol Head Neck Surg. 2008;134(2):190-197. [DOI] [PubMed] [Google Scholar]
- 24. Crisanti MC, Wallace AF, Kapoor V, et al. . The HDAC inhibitor panobinostat (LBH589) inhibits mesothelioma and lung cancer cells in vitro and in vivo with particular efficacy for small cell lung cancer. Mol Cancer Ther. 2009;8(8):2221-2231. [DOI] [PMC free article] [PubMed] [Google Scholar]
- 25. Williams MD, DeLellis RA, Erickson LA, et al. . Pathology data set for reporting parathyroid carcinoma and atypical parathyroid neoplasm: recommendations from the International Collaboration on Cancer Reporting. Hum Pathol. 2021;110:73-82. [DOI] [PubMed] [Google Scholar]
- 26. Bradshaw-Pierce EL, Eckhardt SG, Gustafson DL. A physiologically based pharmacokinetic model of docetaxel disposition: from mouse to man. Clin Cancer Res. 2007;13(9):2768-2776. [DOI] [PubMed] [Google Scholar]
- 27. Jain S, Jirau-Serrano X, Zullo KM, et al. . Preclinical pharmacologic evaluation of pralatrexate and romidepsin confirms potent synergy of the combination in a murine model of human T-cell lymphoma. Clin Cancer Res. 2015;21(9):2096-2106. [DOI] [PubMed] [Google Scholar]
- 28. Wang D, Iclozan C, Liu C, Xia C, Anasetti C, Yu XZ. LBH589 enhances T cell activation in vivo and accelerates graft-versus-host disease in mice. Biol Blood Marrow Transplant 2012; 18:1182-1190.e1181. [DOI] [PMC free article] [PubMed] [Google Scholar]
- 29. Flaherty KT, Puzanov I, Kim KB, et al. . Inhibition of mutated, activated BRAF in metastatic melanoma. N Engl J Med. 2010;363(9):809-819. [DOI] [PMC free article] [PubMed] [Google Scholar]
- 30. Luke JJ, Hodi FS. Vemurafenib and BRAF inhibition: a new class of treatment for metastatic melanoma. Clin Cancer Res. 2012;18(1):9-14. [DOI] [PubMed] [Google Scholar]
- 31. Shi H, Hugo W, Kong X, et al. . Acquired resistance and clonal evolution in melanoma during BRAF inhibitor therapy. Cancer Discov. 2014;4(1):80-93. [DOI] [PMC free article] [PubMed] [Google Scholar]
- 32. Flaherty KT, Infante JR, Daud A, et al. . Combined BRAF and MEK inhibition in melanoma with BRAF V600 mutations. N Engl J Med. 2012;367(18):1694-1703. [DOI] [PMC free article] [PubMed] [Google Scholar]
- 33. De Palma M, Hanahan D. The biology of personalized cancer medicine: facing individual complexities underlying hallmark capabilities. Mol Oncol. 2012;6(2):111-127. [DOI] [PMC free article] [PubMed] [Google Scholar]
- 34. Masui K, Gini B, Wykosky J, et al. . A tale of two approaches: complementary mechanisms of cytotoxic and targeted therapy resistance may inform next-generation cancer treatments. Carcinogenesis. 2013;34(4):725-738. [DOI] [PMC free article] [PubMed] [Google Scholar]
- 35. Niu N, Wang L. In vitro human cell line models to predict clinical response to anticancer drugs. Pharmacogenomics. 2015;16(3):273-285. [DOI] [PMC free article] [PubMed] [Google Scholar]
- 36. Leung AW, Dragowska WH, Ricaurte D, et al. . 3’-Phosphoadenosine 5’-phosphosulfate synthase 1 (PAPSS1) knockdown sensitizes non-small cell lung cancer cells to DNA damaging agents. Oncotarget. 2015;6(19):17161-17177. [DOI] [PMC free article] [PubMed] [Google Scholar]
- 37. Hatano K, Kumar B, Zhang Y, et al. . A functional screen identifies miRNAs that inhibit DNA repair and sensitize prostate cancer cells to ionizing radiation. Nucleic Acids Res. 2015;43(8):4075-4086. [DOI] [PMC free article] [PubMed] [Google Scholar]
- 38. Benzina S, Pitaval A, Lemercier C, et al. . A kinome-targeted RNAi-based screen links FGF signaling to H2AX phosphorylation in response to radiation. Cell Mol Life Sci. 2015;72(18):3559-3573. [DOI] [PMC free article] [PubMed] [Google Scholar]
- 39. Higgins GS, Prevo R, Lee YF, et al. . A small interfering RNA screen of genes involved in DNA repair identifies tumor-specific radiosensitization by POLQ knockdown. Cancer Res. 2010;70(7):2984-2993. [DOI] [PMC free article] [PubMed] [Google Scholar]
- 40. Nagel R, Stigter-van Walsum M, Buijze M, et al. . Genome-wide siRNA screen identifies the radiosensitizing effect of downregulation of MASTL and FOXM1 in NSCLC. Mol Cancer Ther. 2015;14(6):1434-1444. [DOI] [PubMed] [Google Scholar]
- 41. Tiwana GS, Prevo R, Buffa FM, et al. . Identification of vitamin B1 metabolism as a tumor-specific radiosensitizing pathway using a high-throughput colony formation screen. Oncotarget. 2015;6(8):5978-5989. [DOI] [PMC free article] [PubMed] [Google Scholar]
- 42. Brett-Morris A, Wright BM, Seo Y, et al. . The polyamine catabolic enzyme SAT1 modulates tumorigenesis and radiation response in GBM. Cancer Res. 2014;74(23):6925-6934. [DOI] [PMC free article] [PubMed] [Google Scholar]
- 43. Zheng M, Morgan-Lappe SE, Yang J, et al. . Growth inhibition and radiosensitization of glioblastoma and lung cancer cells by small interfering RNA silencing of tumor necrosis factor receptor-associated factor 2. Cancer Res. 2008;68(18):7570-7578. [DOI] [PMC free article] [PubMed] [Google Scholar]
- 44. Hodzic J, Dingjan I, Maas MJ, et al. . A cell-based high-throughput screening assay for radiation susceptibility using automated cell counting. Radiat Oncol. 2015;10:55. [DOI] [PMC free article] [PubMed] [Google Scholar]
- 45. Kafkafi N, Agassi J, Chesler EJ, et al. . Reproducibility and replicability of rodent phenotyping in preclinical studies. Neurosci Biobehav Rev. 2018;87:218-232. [DOI] [PMC free article] [PubMed] [Google Scholar]
- 46. Ghosh C, Kumar S, Kushchayeva Y, et al. . A combinatorial strategy for targeting BRAFV600E-mutant cancers with BRAFV600E inhibitor (PLX4720) and tyrosine kinase inhibitor (Ponatinib). Clin Cancer Res. 2020;26(8):2022-2036. [DOI] [PMC free article] [PubMed] [Google Scholar]
- 47. Catalano MG, Pugliese M, Gargantini E, et al. . Cytotoxic activity of the histone deacetylase inhibitor panobinostat (LBH589) in anaplastic thyroid cancer in vitro and in vivo. Int J Cancer. 2012;130(3):694-704. [DOI] [PubMed] [Google Scholar]
- 48. Tseng YT, Chang TC. Multimodality treatment of anaplastic thyroid cancer with nearly resolved effect. J Formos Med Assoc. 2015;114(9):897-898. [DOI] [PubMed] [Google Scholar]
- 49. Pudney D, Lau H, Ruether JD, Falck V. Clinical experience of the multimodality management of anaplastic thyroid cancer and literature review. Thyroid. 2007;17(12):1243-1250. [DOI] [PubMed] [Google Scholar]
- 50. Liu C, Zhu Y, Lou W, et al. . Functional p53 determines docetaxel sensitivity in prostate cancer cells. Prostate. 2013;73(4):418-427. [DOI] [PMC free article] [PubMed] [Google Scholar]
- 51. San-Miguel JF, Hungria VT, Yoon SS, et al. . Overall survival of patients with relapsed multiple myeloma treated with panobinostat or placebo plus bortezomib and dexamethasone (the PANORAMA 1 trial): a randomised, placebo-controlled, phase 3 trial. Lancet Haematol. 2016;3(11):e506-e515. [DOI] [PubMed] [Google Scholar]
Associated Data
This section collects any data citations, data availability statements, or supplementary materials included in this article.
Data Availability Statement
Some or all data sets generated during and/or analyzed during the current study are not publicly available but are available from the corresponding author on reasonable request.


