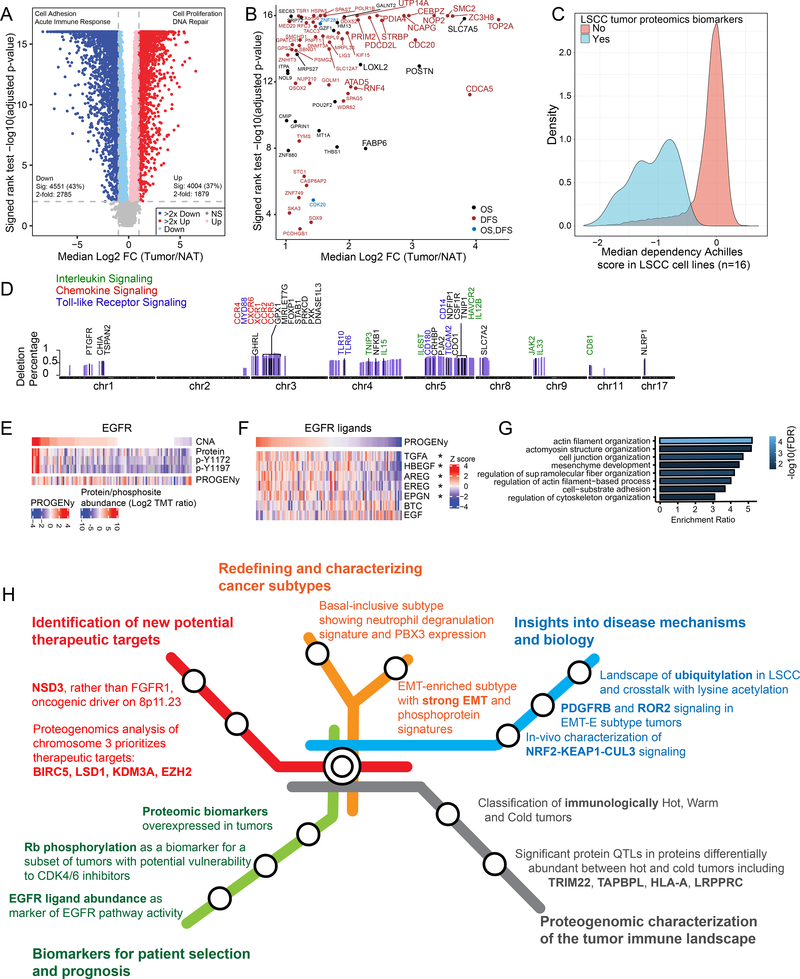
Figure 7: Proteomic Features Related to Diagnosis, Prognosis, or Treatment.
A. Differentially expressed proteins between tumors and NATs.
B. Significantly increased proteins (larger font indicates >4 fold) in the study LSCC cohort that are associated with poor overall survival (OS) or disease-free survival (DFS) in the TCGA LSCC cohort mRNA.
C. Genetic dependencies of 502 proteins (log2 FC >2, FDR<0.01 and NAs <50%) in LSCC cell lines (n=16) profiled as part of the Achilles Dependency-Map project.
D. Genes, ordered by their chromosomal location, that are deleted in at least 25% of the samples and significantly correlated to the immune score. Immune-related genes are highlighted.
E. EGFR protein and tyrosine phosphorylation levels compared to EGFR copy number and an EGFR activity score (PROGENy).
F. Heatmap showing Pearson correlation between the EGFR activity score represented by PROGENy (top) and RNA expression of EGFR ligands. *p<0.05
G. GO Biological Process enrichment for proteins with increased phosphorylation in EGFR amplified samples compared to non-amplified samples.
H. Summary roadmap figure partitioned into five major categories, indicated by different colors.

