

Abstract
Background
Printed educational materials are widely used dissemination strategies to improve the quality of healthcare professionals' practice and patient health outcomes. Traditionally they are presented in paper formats such as monographs, publication in peer‐reviewed journals and clinical guidelines. This is the fourth update of the review.
Objectives
To assess the effect of printed educational materials (PEMs) on the practice of healthcare professionals and patient health outcomes.
To explore the influence of some of the characteristics of the printed educational materials (e.g. source, content, format) on their effect on healthcare professionals' practice and patient health outcomes.
Search methods
We searched MEDLINE, Embase, the Cochrane Central Register of Controlled Trials (CENTRAL), HealthStar, CINAHL, ERIC, CAB Abstracts, Global Health, and EPOC Register from their inception to 6 February 2019. We checked the reference lists of all included studies and relevant systematic reviews.
Selection criteria
We included randomised trials (RTs), controlled before‐after studies (CBAs) and interrupted time series studies (ITSs) that evaluated the impact of PEMs on healthcare professionals' practice or patient health outcomes. We included three types of comparisons: (1) PEM versus no intervention, (2) PEM versus single intervention, (3) multifaceted intervention where PEM is included versus multifaceted intervention without PEM. Any objective measure of professional practice (e.g. prescriptions for a particular drug), or patient health outcomes (e.g. blood pressure) were included.
Data collection and analysis
Two reviewers undertook data extraction independently. Disagreements were resolved by discussion. For analyses, we grouped the included studies according to study design, type of outcome and type of comparison. For controlled trials, we reported the median effect size for each outcome within each study, the median effect size across outcomes for each study and the median of these effect sizes across studies. Where data were available, we re‐analysed the ITS studies by converting all data to a monthly basis and estimating the effect size from the change in the slope of the regression line between before and after implementation of the PEM. We reported median changes in slope for each outcome, for each study, and then across studies. We standardised all changes in slopes by their standard error, allowing comparisons and combination of different outcomes. We categorised each PEM according to potential effects modifiers related to the source of the PEMs, the channel used for their delivery, their content, and their format. We assessed the risks of bias of all the included studies.
Main results
We included 84 studies: 32 RTs, two CBAs and 50 ITS studies. Of the 32 RTs, 19 were cluster RTs that used various units of randomisation, such as practices, health centres, towns, or areas.
The majority of the included studies (82/84) compared the effectiveness of PEMs to no intervention. Based on the RTs that provided moderate‐certainty evidence, we found that PEMs distributed to healthcare professionals probably improve their practice, as measured with dichotomous variables, compared to no intervention (median absolute risk difference (ARD): 0.04; interquartile range (IQR): 0.01 to 0.09; 3,963 healthcare professionals randomised within 3073 units). We could not confirm this finding using the evidence gathered from continuous variables (standardised mean difference (SMD): 0.11; IQR: ‐0.16 to 0.52; 1631 healthcare professionals randomised within 1373 units ), from the ITS studies (standardised median change in slope = 0.69; 35 studies), or from the CBA study because the certainty of this evidence was very low. We also found, based on RTs that provided moderate‐certainty evidence, that PEMs distributed to healthcare professionals probably make little or no difference to patient health as measured using dichotomous variables, compared to no intervention (ARD: 0.02; IQR: ‐0.005 to 0.09; 935,015 patients randomised within 959 units). The evidence gathered from continuous variables (SMD: 0.05; IQR: ‐0.12 to 0.09; 6,737 patients randomised within 594 units) or from ITS study results (standardised median change in slope = 1.12; 8 studies) do not strengthen these findings because the certainty of this evidence was very low.
Two studies (a randomised trial and a CBA) compared a paper‐based version to a computerised version of the same PEM. From the RT that provided evidence of low certainty, we found that PEM in computerised versions may make little or no difference to professionals' practice compared to PEM in printed versions (ARD: ‐0.02; IQR: ‐0.03 to 0.00; 139 healthcare professionals randomised individually). This finding was not strengthened by the CBA study that provided very low certainty evidence (SMD: 0.44; 32 healthcare professionals).
The data gathered did not allow us to conclude which PEM characteristics influenced their effectiveness.
The methodological quality of the included studies was variable. Half of the included RTs were at risk of selection bias. Most of the ITS studies were conducted retrospectively, without prespecifying the expected effect of the intervention, or acknowledging the presence of a secular trend.
Authors' conclusions
The results of this review suggest that, when used alone and compared to no intervention, PEMs may slightly improve healthcare professionals' practice outcomes and patient health outcomes. The effectiveness of PEMs compared to other interventions, or of PEMs as part of a multifaceted intervention, is uncertain.
Plain language summary
Printed educational materials for healthcare professional practice and patient health
What is the aim of this review?
The aim of this review was to find out whether printed educational material distributed to healthcare professionals can improve their practice and in turn improve patient health.
Key messages
The results of this review indicate that printed educational materials probably improve the practice of healthcare professionals and probably make little or no difference to patient health. The results also suggest that computerised versions may make little or no difference to healthcare professionals' practice compared to printed versions of the same printed educational material. Further research with rigorous methodology is likely to have an important impact on our confidence in these estimates of effect, and may change the estimate.
What was studied in the review?
Medical journals and clinical practice guidelines are common channels to distribute scientific information to healthcare professionals, as they allow a wide distribution at relatively low cost. Delivery of printed educational materials is meant to improve healthcare professionals' awareness, knowledge, attitudes, and skills, and ultimately improve their practice and patients' health outcomes.
What are the main results of this review?
The review authors found 84 studies. Most of these studies compared healthcare professionals who had received printed educational material to healthcare professionals who had not received them. Results of this review suggest that printed educational material probably improves healthcare professionals' practice, and probably makes little or no difference to patient health compared to no intervention. Two studies (a randomised trial and a CBA) compared printed and computerised versions of the same educational material and suggest that computerised versions may make little or no difference to healthcare professionals' practice compared to printed versions.
How up‐to‐date is this review?
The review authors searched for studies that had been published up to 8 February 2019.
Summary of findings
Background
Description of the condition
Most research findings are not making their way into practice in a timely fashion despite the considerable resources devoted to health sciences research (Straus 2013). Recommendations are frequently not applied in practice and many patients do not benefit from evidence‐based research (Grol 2001; Schuster 2005).
Description of the intervention
Printed educational materials (PEMs) are probably one of the most common approaches to translate research findings into clinical practice (Bero 1998). This review focuses on the dissemination of PEMs, defined as the distribution of published or printed recommendations for clinical care including clinical practice guidelines, monographs, and publications in peer‐reviewed journals, delivered personally or through mass mailing.
How the intervention might work
PEMs have the potential to improve the care received by patients by promoting clinical practice of proven benefit and discouraging ineffective procedures (Gagliardi 2015). Given that PEMs are familiar, accessible, inexpensive, and convenient to use, they could be a cost‐effective intervention within healthcare settings (Grimshaw 2004; Grimshaw 2006).
Potential factors influencing the impact of PEMs can be derived from various theories on quality‐improvement and implementation of change in health care (Agbadjé 2018, Greenhalgh 2017; Grol 2007; Stergiou‐Kita 2010). Cognitive theories suggest that PEMs should take into account healthcare professionals' decision processes and learning styles to support their decisions in practice better. Educational and adult learning theories propose that change is driven by the desire to learn and be professionally competent, suggesting that PEMs should be linked to professionals' needs and motivation, define personal targets for improvement and contain individual 'learning plans' related to desired performance. Attitudinal and motivational theories suggest that PEMs should address professionals' attitudes, beliefs, perceived social norms, and experienced control related to desired performance to influence their motivations to change. Professional development theories emphasise the importance of professional loyalty, pride, consensus, and that change be endorsed by a professional body; thus, PEMs should incorporate these elements and define professional standards for the desired behaviour. Social influence theories suggest that the content or message of the PEMs be endorsed or reinforced by recognised leaders in their field. Literature on communication design might also be useful to appraise some of the more visual aspects of PEMs (Ancker 2007; Rosenbaum 2010).
The persuasive communication theory proposes five input variables that may possibly affect communication effectiveness: source, message, channel, receiver, and destination (Wilson 2010). For the purpose of this review, we chose to focus on the three variables to characterise the intervention itself, namely source, message and channel. In addition, to acknowledge the possible importance of PEMs' visual aspects to explain their effectiveness, we added a variable that we labelled 'format'. With regards to source, we considered credibility and proximity of the source. Source credibility influences the extent to which a message is believed (Sbaffi 2017; Wathen 2002), so that PEMs that are endorsed by a credible organisation, such as a national professional organisation might have more impact on practice. Proximity of the source to the target audience (i.e. when the information is locally tailored to the audience) can also affect health behaviour change more positively than can targeted, personalised, or generic interventions (Revere 2001). We also consider the source quality level which integrates both the ease of access to the source by healthcare professionals, and how the source meets critical appraisal criteria (Haynes 2007). For channel, we considered the mode, frequency, and duration of PEM delivery. The mode of delivery must be appropriate to the target audience ‐ widest audiences should be reached via mass communication and local audiences via personalised channels (Marriott 2000). Frequently delivered PEMs that lead to a more frequent exposure of the professional to the message, following principles of persuasive communication, might be more effective to improve professional practice performance (Davis 2009; McGuire 1989). For message, we considered the PEM's clinical area, type of targeted behaviour, purpose, and educational component. Compatibility of PEMs with existing beliefs, for example, if PEM's purpose is to increase an established management, could possibly increase their acceptability to users (Rogers 1995), but evidence has demonstrated that clinical recommendations that are more compatible with clinician beliefs were less effective to change professional practice, which is likely to be because of ceiling effects (Foy 2002). Evidence‐based recommendations are better followed in practice than recommendations that are not based on scientific evidence (Foy 2002; Grol 1998). For format, we considered format and appearance. Shorter and simpler documents have the potential to facilitate more effective and efficient uptake of key information, as professionals often do not have time to screen, organise, and appraise new scientific literature (Grandage 2002; Marriott 2000; Wang 2009).
Why it is important to do this review
The first version of the present review on the effectiveness of the dissemination of PEMs included nine studies comparing PEMs to no intervention and it concluded that this strategy had little impact on professional practice (Freemantle 1997). These results were then supported by another broader review of 44 reviews covering a wide range of interventions that concluded that passive dissemination of PEMs is generally ineffective (NHS 1999). These early results led researchers to use PEMs as a control condition for evaluating the impacts of more complex and intensive quality improvement interventions (e.g. Jain 2006; Maiman 1988; Mettes 2010), instead of evaluating PEMs per se. However, subsequent reviews (Grimshaw 2004; Hakkennes 2008) and the first update of the present review published in 2008 showed that PEMs led to modest improvement in professional practice (Farmer 2008). The first version of this review included nine randomised trials comparing PEMs to no intervention and observed a median absolute effect on performance of 4.3% (range ‐8.0% to 9.6%) for healthcare professionals' practice outcomes measured with dichotomous variables (six studies: Bearcroft 1994; Beaulieu 2004; Bjornson 1990; Croudace 2003; Kottke 1989; Oakeshott 1994) and a relative improvement of 13.6% for healthcare professionals' practice outcomes measures with continuous variables (three studies: Azocar 2003; Denig 1990; Oakeshott 1994).
Since the last update (Giguere 2012), several new studies of the dissemination of PEMs have been published, but no other review on the effectiveness of this strategy to improve any professional behaviour has, to our knowledge, been done. Several reviews have studied the dissemination of PEMs alongside other types of quality improvement strategies to improve specific behaviours, such as antibiotic prescribing (Arnold 2005), use of imaging (French 2010), management of diabetes (De Belvis 2009; Seitz 2011), or psychiatric care (Weinmann 2007). However, these reviews included few studies that compared the dissemination of PEMs to no intervention, limiting conclusions on their effectiveness.
In addition, the small number of trials included in the first update prevented exploration of which PEM characteristics were associated with greater effectiveness. The larger number of studies gathered through this second update should allow us to assess the impact of potential effect modifiers of PEMs (to then suggest strategies to optimise them). It should also allow us to generalise the review conclusions to a larger set of conditions.
Objectives
To assess the effect of PEMs on the practice of healthcare professionals and patient health outcomes.
To explore the influence of some of the characteristics of the PEMs (e.g. mode of delivery, source of information, format) on their effect on professional practice and patient health outcomes.
To address the first objective, we included the following types of comparisons: (1) PEM only compared to no intervention, (2) PEM only versus single intervention, and (3) multifaceted intervention where PEM is included versus multifaceted intervention without PEM.
To address the second objective, we classified each included intervention according to potential effect modifiers related to the source of the PEMs, the channel used for their delivery, the message, and their format.
Methods
Criteria for considering studies for this review
Types of studies
We included randomised trials, quasi‐randomised studies, controlled before‐after studies (CBAs) and interrupted time series studies (ITSs) were included. For CBAs, we considered only the trials that used contemporaneous data collection (i.e. pre‐ and post‐intervention periods for study and control sites are the same); that selected appropriate control sites for studies using second sites as controls (i.e. study and control sites are comparable with respect to dominant reimbursement system, level of care, setting of care, and academic status); and that used a minimum number of sites (i.e. there was a minimum of two intervention sites and two control sites). We used two criteria for inclusion of studies with an ITS design: a clearly defined point in time when the intervention occurred, and at least three data points before and three after the intervention. We included studies published in all languages.
Types of participants
Any healthcare professional provided with PEMs to improve their practice or patient health outcomes, or both. We included studies in which the participants were students and healthcare professionals only if we could separate the outcomes from students and qualified healthcare professionals.
Types of interventions
We included studies of the distribution of published or printed recommendations for clinical care and evidence to inform practice, comprising clinical practice guidelines, journal articles, posters, checklists, job aids and monographs. We included PEMs delivered personally (i.e. addressed to a specific individual), through mass mailings, or passively delivered through broader communication channels (e.g. printable documents available on the Internet, mass media). Interventions to provide increased access to electronically retrievable information were considered to be outside of the scope of this review.
We included multifaceted interventions that comprised PEM only if they were compared to the same multifaceted intervention without the studied PEM.
Types of outcome measures
Any objective measure either of healthcare professionals' practice (e.g. the number of tests ordered, prescriptions for a particular drug) or of patient health outcomes (e.g. blood pressure, complications after surgery). We excluded studies that only reported the impact of PEMs on healthcare professionals' attitudes, awareness, knowledge, or opinions.
Search methods for identification of studies
Electronic searches
We identified primary studies and related systematic reviews using the following bibliographic databases, sources and approaches.
Cochrane Central Register of Controlled Trials (CENTRAL; 6 February 2019) via OVID
MEDLINE, OVID (1948 to 6 February 2019)
Embase, OVID (1947 to 6 February 2019)
Database of Abstracts of Reviews of Effects (DARE; 2015, Issue 2) via OVID
Cochrane Database of Systematic Reviews (CDSR; 6 February 2019) via OVID
Cochrane Methodology Register (MTH; 2012, Issue 3) via OVID
CINAHL EBSCO (Cumulative Index to Nursing and Allied Health Literature; 1980 to 6 February 2019)
ERIC Wilson (Educational Resources Information Center; 1966 to 6 February 2019)
HealthStar, OVID (1999 to 6 February 2019)
For this update, we used the same search strategy as the one used in the last update (Appendix 1). To this search we also added a manual search of the lists of references of existing Cochrane Effective Practice and Organisation of Care (EPOC) reviews on the effectiveness of implementation strategies directed at healthcare workers (http://epoc.cochrane.org/our-reviews). We also checked the reference lists of all included studies and relevant systematic reviews and conducted a citation search of all included studies.
The search strategy included both controlled vocabulary terms and keywords. One portion of the search was a focused keyword search using high‐value phrases such as printed educational materials, or print intervention, print/written material in proximity to education terms; we did not combine results from this portion of the strategy with methodological filters and we screened all citations. The second part of the strategy used Medical Subject Headings (MeSH) for continuing education and in‐service training and combined these concepts with terms describing health professionals and a broad array of synonyms for print material. This strategy also incorporated two study design filters. We developed strategies for OVID MEDLINE and translated them for other databases.
Searching other resources
We identified additional information as follows:
searched clinicaltrials.gov (clinicaltrials.gov) and the World Health Organization International Clinical Trials Registry Platform (who.int/ictrp).
reviewed reference lists of included studies, relevant systematic reviews, or other publications;
conducted cited reference searches in ISI Web of Science/Web of Knowledge (May 2017).
Data collection and analysis
We structured data analysis using the statistical methods developed by Grimshaw and colleagues (Grimshaw 2004). We grouped studies according to study design (ITS or controlled studies), type of end point (professional practice or patient health outcome, continuous or dichotomous) and type of comparison (PEM only versus no intervention or PEM only versus other intervention). For studies where the quantitative data were absent or insufficient to calculate effect sizes, we presented the qualitative data as presented by the authors and conducted a descriptive analysis of the effectiveness of the included PEMs. Scales varied from study to study, with some scales having positive outcomes with large values and others having positive outcomes with small values. In all cases, the effect size was standardised so that a positive difference between post‐intervention percentages or means was a favourable end point.
Interrupted time series studies
We tabulated descriptive statistics for each study, and we re‐analysed the results where possible. For the purpose of re‐analysis, we derived data on individual observations over time from tables of results or graphs presented in the original study, by reading the corresponding values from the images. This approach shows good consistency between data derived from graphs and those explicitly reported in papers (Grilli 2002). Additionally, all time scales were converted to a monthly basis.
Following recommendations of Ramsay and colleagues (Ramsay 2003), we used time regression analyses to re‐analyse the results of each study. We also investigated the use of an auto‐regressive integrated moving average (ARIMA) model. Upon visual inspection, we found the ARIMA model captured more detail in only two of the 50 included studies, though general conclusions remained similar. For ease of interpretation, we decided to use only the segmented linear auto‐regressive error model. We tested auto‐regressive lag orders using the Durbin‐Watson statistic, and tested orders according to the frequency of data over a year, up to 12 for monthly data and up to four for quarterly data. We parameterised the model to identify changes in slope allowing also for changes in base levels.
For ITS studies, standardised change in the slope of the regression line is used as the effect size representing how the intervention modified trends in the outcome as a monthly change in standard errors, allowing comparisons and combination of different outcomes. We used these standardised changes in slopes to calculate median slope differences for each study, and then for each type of outcome (professional practice or patient health outcomes). It is also possible the PEM had an effect on base level as parameterised, but this value had little practical interpretation given that changes occurred at different time points across studies.
Controlled studies (C‐randomised trials, randomised trials and CBAs)
Where studies reported more than one measure of each end point, the primary measure (as defined by the authors of the study) or the median measure was abstracted. For example, if the study reported multiple healthcare professionals' practice outcomes as dichotomous variables, and none of them was denoted the primary variable, then the effect sizes of all the variables were computed, adjusted for the direction of the effect and the median value was taken. For dichotomous end points, we computed the risk difference for each outcome, multiplying by ‐1 when a positive outcome was represented by a decrease in the risk. We then calculated the median risk difference (ARD) per study and outcome type. The ARD represents the difference in end point between intervention and control group and a positive value indicates that the outcome improved more in the group that received the PEM than in the control group (e.g. an ARD of 0.11 indicates that 11% more individuals had a positive outcome when they received the PEM than when they did not). For continuous end points, we computed the standardised mean difference (SMD) by dividing the mean score difference of the intervention and comparison groups in each study by the pooled estimated standard deviation for the two groups and multiplied by ‐1 when a positive outcome was indicated by a lower score. We then computed the median standardised mean difference per study and outcome type. For dichotomous and continuous end points, we constructed 95% confidence intervals (CIs) according to the recommendations of Review Manager 5 (RevMan 2014). When no baseline was reported, we considered groups to be similar prior to the intervention. When the baseline was different for the two groups, we extracted a qualitative quote from the primary study report on the effectiveness of the intervention and on any confounding factors when available.
Analyses were carried out using the SAS software package (version 9.4), and Review Manager (version 5.3) (RevMan 2014).
Subgroup analysis and investigation of heterogeneity
We considered the PEM characteristics that were listed previously (Data extraction and management) as potential sources of heterogeneity to explain variations in the results of the included studies. We prepared box plots (displaying median effect sizes, interquartile ranges, and outliers) and visually explored the size of the observed effects in relationship to each of these characteristics. Based on the work of various authors outlined in the Background section (How the intervention might work), we hypothesised that endorsement (Tseng 1999; Wathen 2002), tailoring (Revere 2001), increased frequency (Davis 2009; McGuire 1989), better certainty of evidence (Foy 2002; Grol 1998), educational component, graphically enhanced communication format, and shorter length (Grandage 2002; Marriott 2000) would enhance the PEM effectiveness. We did not have a priori hypotheses for the other potential effect modifiers.
Selection of studies
Two reviewers (from DUA, EFB, AM, JW, SY) independently screened the titles and abstracts of all the retrieved reports to assess which studies met the inclusion criteria. We then retrieved full‐text copies of all papers that were either potentially relevant or for which the inclusion criteria were not clear in the title or abstract. Any disagreements on selection were resolved by discussion among the reviewers and lead author (AG).
Data extraction and management
For multi‐arm studies, we selected the intervention groups as those that could be included in a pairwise comparison of intervention groups that, if investigated alone, would meet the criteria for including studies in the review. Where more than two arms met these inclusion criteria, we selected the most intensive intervention among the experimental arms.
Two reviewers extracted outcome data independently (from DUA, AF and PAGN) and disagreements were resolved by discussion between the reviewers and lead author (AG). We gathered the actual PEMs to allow a better description of their characteristics. For the extraction of the data on the characteristics of the studies and interventions, we used a modified version of the EPOC data collection checklist. A single review author initially extracted the data and a second review author double‐checked the extracted data (from DUA, AF and PAGN). All modifications proposed by the second reviewer to the initial extraction were verified by the lead author (AG). Disagreements were resolved by discussion between the reviewers and lead author (AG).
We categorised each PEM according to potential effects modifiers by reading the study report and by assessing, where available, the PEM itself (Appendix 2). We chose the characteristics (effect modifiers) that we hypothesised would be most important in explaining differences in the effectiveness of the PEM. Effects modifiers related either to the source of the PEMs, the channel used to deliver them, their message, or their format, as described hereafter:
Source
Source of information: researchers/clinicians, university, local expert body, national professional expert body, national government expert body, local clinicians, international professional expert body, international government expert body (Tseng 1999; Wathen 2002).
Endorsement: endorsed by an official source, not endorsed (Marriott 2000; Wathen 2002).
Tailoring: tailored to individuals based on diagnostic, behavioural, or motivational characteristics; tailored to groups of individuals; personalised but not tailored; generic (Baker 2010; Bull 2001; Kreuter 1996; Revere 2001)
Source quality level: system, summary, systematic review of randomised trials, clinical practice guidelines, other synthesis, original randomised trial, original nonrandomised trial study, expert opinion (Burgers 2003a; Foy 2002; Grol 1998; Haynes 2007).
Channel
Mode of delivery: publication in peer‐reviewed journal, passive dissemination, direct mailing, mass mailing, media, hand delivery (Grol 1998).
Frequency of delivery: once, twice, three times, more than three times, indeterminate (Davis 2009).
Duration of delivery: once, one to three months, four to six months, over six months, indeterminate.
Message
Clinical area: e.g. cardiovascular disease, antibiotic treatment, hypertension, diabetes, oestrogen replacement therapy, statin therapy, chest radiography, prostheses, orthopaedic surgery (Grol 2003; Marriott 2000).
Type of targeted behaviour: prescribing/treatment, financial, general management of a problem, diagnosis, procedures, referrals, test ordering, surgery, patient education/advice, clinical prevention, screening, reporting, professional‐patient communication, record keeping, discharge planning (Arnold 2005).
Purpose: initiation of new management, stopping the introduction of new management, increase of established management, cessation of established management, reduction of established management, modification of management (Foy 2002; Grol 1998; Rogers 1995).
Educational component: continuing professional development credits to recipients, delivered as part of a formal education programme, clear statement that was intended for education, no evidence of educational component (Davis 2009).
Format
Format: publication of randomised trial in peer‐reviewed journal, quick reference of clinical practice guidelines, full clinical practice guidelines, newsletter/bulletin, manual of article reprints, other (Grandage 2002).
Appearance: black and white with figures/tables, graphically enhanced communication format (Bull 2001; Hoffman 2004).
A single reviewer initially categorised each PEM and a second reviewer double‐checked the categories chosen (from DUA, AF and PAGN). All modifications proposed by the second reviewer to the initial classification were verified by the lead author (AG). Disagreements were resolved by discussion between the reviewers and lead author (AG).
We contacted the primary authors of the studies to complete missing data relative to outcomes, study design, and mode of delivery. We also asked them for the actual PEM that had been evaluated within the study if it was unavailable within the report and could be not found on the Internet.
Assessment of risk of bias in included studies
Two independent reviewers (from DUA, AF and PAGN) assessed the risk of bias for each included study.
For the RT and CBA studies, we used the criteria described in the EPOC module (see 'Additional information', 'Assessment of methodological quality' under Group Details). We resolved any discrepancies in quality ratings by discussion between the reviewers and the lead author (AG). Each study was evaluated based on the following criteria: low risk, high risk, or unclear risk.
Random sequence generation ‐ was the allocation sequence adequately generated?
Allocation concealment ‐ was allocation concealment adequate?
Baseline characteristics similar ‐ are baseline characteristics of the study and control healthcare professionals similar?
Baseline outcomes similar ‐ were baseline outcomes measured prior to the intervention and no important differences present across study groups?
Incomplete outcome data ‐ were loss to follow‐up or dropouts unlikely to bias the results?
Blinding of participants and personnel ‐ were participants and personnel blind to the intervention?
Blinding of outcome assessment ‐ were outcome assessors blind to the intervention?
Contamination protection ‐ was the allocation by community, institution or practice, or were there safeguards to cross‐contamination of the control group?
Selective reporting ‐ were all outcomes in the methods reported in the results?
Other risks of bias ‐ were any additional risks noted during bias assessment?
We contacted the primary authors of the studies to complete missing data regarding sequence generation and allocation concealment.
For the ITS studies, we used the criteria proposed by Ramsay et al. (Ramsay 2003).
Measures of treatment effect
Interrupted time series studies
Descriptive statistics for each study were tabulated, and we re‐analysed the results where possible. For the purpose of re‐analysis, data on individual observations over time were derived from tables of results or graphs presented in the original study, by reading the corresponding values from the images. This approach shows good consistency between data derived from graphs and those explicitly reported in papers (Grilli 2002).
Following recommendations of Ramsay and colleagues (Ramsay 2003), time regression analyses were used to re‐analyse the results of each study. We visually compared the results of an auto‐regressive integrated moving average (ARIMA) model and a segmented linear auto‐regressive error model. We found the ARIMA model captured more details in only two of the 65 included outcomes, and both models gave comparable results in these cases, so we decided to use only the segmented linear auto‐regressive error model. Auto‐regressive lag orders were tested using the Durbin‐Watson statistic. Orders were tested according to the frequency of data over a year, up to 12 for monthly data and up to four for quarterly data. The model was parameterised to identify changes in slope allowing also for changes in base levels.
For ITS studies, standardised change in the slope of the regression line is used as the effect size representing how the intervention modified trends in the outcome as a monthly change in standard errors, allowing comparisons and combination of different outcomes. All changes in slopes were standardised by their standard error. We used these standardised changes in slopes to calculate median level differences for each study, and then for each type of outcome (professional practice or patient health outcomes). It is also possible the PEM had an effect on base level as parameterised, but this value adds little practical interpretation given that changes occurred at different time points across studies.
Controlled studies (C‐randomised trials, randomised trials and CBAs)
Where studies reported more than one measure of each end point, the primary measure (as defined by the authors of the study) or the median measure was abstracted. For example, if the study reported multiple dichotomous professional practice variables, and none of them was denoted the primary variable, then the effect sizes of all the variables were computed, adjusted for the direction of the effect and the median value was taken. For dichotomous end points, we computed the risk difference for each outcome, multiplying by ‐1 when a positive outcome was represented by a decrease in the risk. We then calculated the median risk difference (ARD) per study and outcome type. The ARD represents the difference in end point between intervention and control group and a positive value indicates that the outcome improved more in the group that received the PEM than in the control group (e.g. an ARD of 0.11 indicates that 11% more individuals had a positive outcome when they received the PEM than when they did not). For continuous end points, we computed the standardized mean difference (SMD) by dividing the mean score difference of the intervention and comparison groups in each study by the pooled estimated standard deviation for the two groups and multiplied by ‐1 when a positive outcome was indicated by a lower score. We then computed the median standardised mean difference per study and outcome type. For dichotomous and continuous end points, we constructed 95% confidence intervals (CIs) according to the recommendations of Review Manager 5 (RevMan 2014). When no baseline was reported, we considered groups to be similar prior to the intervention. When the baseline was different for the two groups, we extracted a qualitative quote from the primary study report on the effectiveness of the intervention and on any confounding factors when available.
Unit of analysis issues
We noted whether studies randomised healthcare providers or clusters of providers, such as practices. If the analysis did not allow for clustering of healthcare providers, we recorded a unit of analysis error, as such analysis tends to overestimate the precision of the effect of treatment (Donner 2001). We also checked for unit of analysis issues in the included CBAs.
Dealing with missing data
When required information to perform the calculations on an outcome was missing, this outcome was not included in the analyses.
Assessment of heterogeneity
We explored the degree of heterogeneity by reviewing the median effect sizes across studies as displayed in the Additional tables displaying effect sizes for each comparison, study design and type of outcome (Table 3; Table 4; Table 5; Table 6; Table 7; Table 8; Table 9; Table 10). When an effect size was estimated from a single study, we chose to be more conservative and rated heterogeneity as high (Table 2).
1. Comparison 1, RT design, healthcare professional's practice outcome measure with dichotomous variables.
| Study | Study design`Numbers of HCPs and randomisation units | Outcome | Control group (n/N or %) | Experimental group (n/N or %) | Absolute risk difference | Weighted median effect size⭐ | ||
| Pre | Post | Pre | Post | |||||
| Bearcroft 1994 | C‐RT; 210 HCPs randomised by practice (n = unclear) | X‐ray requests not meeting guideline requirements∡* | NA | 87/1059 | NA | 78/1362 | 0.02 | 0.04 |
| X‐ray requests with inadequate patient history∡* | NA | 164/1059 | NA | 148/1362 | 0.05 | |||
| Recorded clinical diagnosis | NA | 454/1059 | NA | 668/1362 | 0.06 | |||
| Reported smoking history | NA | 258/1059 | NA | 382/1362 | 0.04 | |||
| Bjornson 1990 | RT; 576 HCPs randomised individually | Complete change of therapy: switch of therapy to hydralazine and isosorbide | NA | 1/288 | NA | 4/288 | 0.01 | 0.01 |
| Dormuth 2004 | C‐RT; 499 HCPs randomised by local health area (n = 24) | Newly treated patients receiving the analysis drug (cimetidine) | 23/131,529 | 25/137,742 | 27/149,735 | 45/152,201 | 0.00 | 0.00 |
| Newly treated patients receiving the analysis drugs (metronidazole/amoxicillin or tetracycline) | 20/134,245 | 10/137,742 | 7/153,561 | 9/157,743 | 0.00 | |||
| Newly treated patients receiving the analysis drugs (ASA/ibuprofen/naproxen) | 116/136,589 | 121/142,610 | 100/156,390 | 131/161,168 | 0.00 | |||
| Newly treated patients receiving the analysis drug (isosorbide dinitrate) | 7/142,091 | 4/131,571 | 7/160,368 | 7/144,926 | 0.00 | |||
| Newly treated patients receiving the analysis drug (thiazide diuretics) | 114/141,176 | 50/131,588 | 104/156,544 | 69/148,488 | 0.00 | |||
| Newly treated patients receiving the analysis drug (inhaled corticosteroids) | 13/138,165 | 4/140,163 | 15/150,533 | 11/154,274 | 0.00 | |||
| Newly treated patients receiving the analysis drug (calcium‐channel blockers)* | 141,107/141,176 | 131,541/131,588 | 156,457/156,544 | 148,450/148,488 | 0.00 | |||
| Newly treated patients receiving the analysis drug (long‐acting benzodiazepines)* | 141,806/141,967 | 133,804/133,995 | 154,554/154,719 | 147,960/148,121 | 0.00 | |||
| Newly treated patients receiving the analysis drug (hormones)* | 133,333/133,403 | 134,904/134,991 | 147,656/147,745 | 147,381/147,487 | 0.00 | |||
| Newly treated patients receiving the analysis drug (calcium‐channel blockers)* | 132,461/132,512 | 139,870/139,935 | 150,298/150,358 | 152,025/152,082 | 0.00 | |||
| Newly treated patients receiving the analysis drug (clonazepam/alprazolam/diazepam)* | 129,906/129,951 | 139,796/139,836 | 148,318/148,381 | 152,844/152,891 | 0.00 | |||
| Newly treated patients receiving the analysis drug (finasteride)* | 136,681/136,691 | 129,769/129,775 | 152,183/152,195 | 142,379/142,392 | 0.00 | |||
| Guadagnoli 2004 | RT; 394 HCPs randomised individually | Conformance with guideline recommendations regarding acute myocardial infaRTion ‐ Proportion of patients who were prescribed ACE inhibitors | NA | 122/183 | NA | 106/160 | 0.00 | 0.01 |
| Conformance with guideline recommendations regarding acute myocardial infaRTion ‐ Proportion of patients who were prescribed beta‐blockers | NA | 152/164 | NA | 134/141 | 0.02 | |||
| Conformance with guideline recommendations regarding acute myocardial infaRTion ‐ Proportion of patients who were prescribed daily aspirin | NA | 254/258 | NA | 222/223 | 0.01 | |||
| Conformance with guideline recommendations regarding acute myocardial infaRTion ‐ Proportion of patients who were tested for cholesterol | NA | 258/277 | NA | 214/232 | ‐0.01 | |||
| Conformance with guideline recommendations regarding acute myocardial infaRTion ‐ Proportion of patients for whom left ventricular ejection fraction was determined | NA | 254/277 | NA | 213/232 | 0.00 | |||
| Conformance with guideline recommendations regarding acute myocardial infaRTion ‐ Proportion of patients assessed for depression | NA | 68/277 | NA | 56/232 | 0.00 | |||
| Conformance with guideline recommendations regarding acute myocardial infaRTion ‐ Proportion of patients who received advice for smoking cessation | NA | 51/67 | NA | 31/46 | ‐0.09 | |||
| Conformance with guideline recommendations regarding heart failure ‐ Proportion of patients who were prescribed ACE inhibitors | NA | 33/39 | NA | 46/51 | 0.06 | |||
| Conformance with guideline recommendations regarding heart failure ‐ Proportion of patients who were prescribed target ACE inhibitors | NA | 15/32 | NA | 22/45 | 0.02 | |||
| Conformance with guideline recommendations regarding heart failure ‐ Proportion of patients who were prescribed beta‐blockers | NA | 27/36 | NA | 37/48 | 0.02 | |||
| Conformance with guideline recommendations regarding heart failure ‐ Proportion of patients for who left ventricular ejection were determined | NA | 119/164 | NA | 131/159 | 0.10 | |||
| Conformance with guideline recommendations regarding heart failure ‐ Proportion of patients for who serum potassium levels were measured | NA | 104/117 | NA | 104/110 | 0.06 | |||
| Conformance with guideline recommendations regarding heart failure ‐ Proportion of patients for who serum creatinine levels were measured | NA | 108/125 | NA | 103/117 | 0.02 | |||
| Conformance with guideline recommendations regarding heart failure ‐ Proportion of patients whose weight was assessed | NA | 150/164 | NA | 151/159 | 0.03 | |||
| Conformance with guideline recommendations regarding heart failure ‐ Proportion of patients assessed for peripheral oedema | NA | 155/164 | NA | 151/159 | 0.00 | |||
| Conformance with guideline recommendations regarding heart failure ‐ Proportion of patients advised to limit salt intake | NA | 114/164 | NA | 104/159 | ‐0.04 | |||
| Kajita 2010 | C‐RT; Unclear number of HCPs randomised by municipal health centre (n = 100) | Education on milk and dairy product ‐ premenopausal | 4/49 | 6/49 | 4/51 | 8/51 | 0.03 | 0.04 |
| Education on milk and dairy product ‐ postmenopausal | 19/49 | 20/49 | 16/51 | 26/51 | 0.10 | |||
| Education on milk and dairy product ‐ elderly | 18/49 | 20/49 | 16/51 | 23/51 | 0.04 | |||
| Education on soy product ‐ premenopausal | 14/49 | 20/49 | 19/51 | 27/51 | 0.12 | |||
| Education on soy product ‐ postmenopausal | 16/49 | 20/49 | 20/51 | 28/51 | 0.14 | |||
| Education on soy product ‐ elderly | 16/49 | 20/49 | 19/51 | 26/51 | 0.10 | |||
| Education on calcium Intake ‐ premenopausal | 25/49 | 22/49 | 22/51 | 29/51 | 0.12 | |||
| Education on calcium intake ‐ postmenopausal | 26/49 | 23/49 | 23/51 | 33/51 | 0.18 | |||
| Education on calcium Intake ‐ elderly | 23/49 | 21/49 | 22/51 | 29/51 | 0.14 | |||
| Education on calcium supplement ‐ premenopausal | 0/49 | 0/49 | 0/51 | 1/51 | 0.02 | |||
| Education on calcium supplement ‐ postmenopausal | 0/49 | 0/49 | 0/51 | 2/51 | 0.04 | |||
| Education on calcium supplement ‐ elderly | 0/49 | 0/49 | 0/51 | 2/51 | 0.04 | |||
| Education on vitamin D intake ‐ premenopausal | 0/49 | 0/49 | 1/51 | 2/51 | 0.04 | |||
| Education on vitamin D intake ‐ postmenopausal | 0/49 | 0/49 | 1/51 | 2/51 | 0.04 | |||
| Education on vitamin D intake ‐ elderly | 0/49 | 0/49 | 0/51 | 1/51 | 0.02 | |||
| Education on magnesium intake ‐ premenopausal | 1/49 | 0/49 | 1/51 | 2/51 | 0.04 | |||
| Education on magnesium intake ‐ postmenopausal | 0/49 | 0/49 | 1/51 | 2/51 | 0.04 | |||
| Education on magnesium intake ‐ elderly | 0/49 | 0/49 | 0/51 | 1/51 | 0.02 | |||
| Education on isoflavone intake ‐ premenopausal | 2/49 | 4/49 | 3/51 | 5/51 | 0.02 | |||
| Education on isoflavone intake ‐ postmenopausal | 2/49 | 5/49 | 3/51 | 8/51 | 0.05 | |||
| Education on brisk walking ‐ elderly | 14/49 | 10/49 | 19/51 | 25/51 | 0.29 | |||
| Education on high‐impact training ‐ premenopausal | 2/49 | 4/49 | 2/51 | 10/51 | 0.11 | |||
| Education on high‐impact training ‐ postmenopausal | 2/49 | 5/49 | 2/51 | 9/51 | 0.07 | |||
| Education on high‐impact training ‐ elderly | 2/49 | 5/49 | 2/51 | 11/51 | 0.11 | |||
| Education on low‐impact training ‐ elderly | 4/49 | 2/49 | 8/51 | 12/51 | 0.19 | |||
| Education on being active in everyday life ‐ elderly | 0/49 | 2/49 | 1/51 | 2/51 | 0.00 | |||
| Education on strengthening of back muscles ‐ elderly | 0/49 | 1/49 | 2/51 | 3/51 | 0.04 | |||
| Education on exposure to sunlight ‐ premenopausal | 6/49 | 5/49 | 4/51 | 2/51 | ‐0.06 | |||
| Education on exposure to sunlight ‐ postmenopausal | 6/49 | 4/49 | 4/51 | 2/51 | ‐0.04 | |||
| Education on exposure to sunlight ‐ elderly | 5/49 | 4/49 | 4/51 | 2/51 | ‐0.04 | |||
| Education on maintenance of appropriate weight ‐ premenopausal | 8/49 | 12/49 | 15/51 | 12/51 | ‐0.01 | |||
| Education on maintenance of appropriate weight ‐ postmenopausal | 8/49 | 12/49 | 14/51 | 12/51 | ‐0.01 | |||
| Education on maintenance of appropriate weight ‐ elderly | 7/49 | 11/49 | 13/51 | 10/51 | ‐0.03 | |||
| Education on do not start smoking ‐ premenopausal | 8/49 | 6/49 | 9/51 | 3/51 | ‐0.06 | |||
| Education on do not start smoking ‐ postmenopausal | 8/49 | 6/49 | 8/51 | 4/51 | ‐0.04 | |||
| Education on stop smoking ‐ premenopausal | 5/49 | 2/49 | 6/51 | 4/51 | 0.04 | |||
| Education on stop smoking ‐ postmenopausal | 5/49 | 1/49 | 5/51 | 3/51 | 0.04 | |||
| Education on stop smoking ‐ elderly | 5/49 | 1/49 | 5/51 | 3/51 | 0.04 | |||
| Education on alcohol drinking ‐ elderly* | 7/49 | 8/49 | 11/51 | 10/51 | ‐0.03 | |||
| Education for elderly subjects with a history of falls ‐ elderly* | 30/49 | 23/49 | 24/51 | 23/51 | 0.21 | |||
| Education on total body exercise including balance ‐ postmenopausal | 10/49 | 8/49 | 8/51 | 8/51 | ‐0.01 | |||
| Education on total body exercise including balance ‐ elderly | 15/49 | 13/49 | 11/51 | 13/51 | ‐0.01 | |||
| Education on modification of behaviour after examination of risk factors ‐ postmenopausal | 15/49 | 10/49 | 15/51 | 10/51 | ‐0.01 | |||
| Education on modification of behaviour after examination of risk factors ‐ elderly | 20/49 | 18/49 | 22/51 | 18/51 | ‐0.01 | |||
| Education on environmental Improvement ‐ postmenopausal | 14/49 | 10/49 | 17/51 | 10/51 | ‐0.01 | |||
| Education on environmental Improvement ‐ elderly | 20/49 | 19/49 | 26/51 | 19/51 | ‐0.02 | |||
| Kunz 2007 | C‐RT; 132 HCPs randomised by practice (n = 22) | Non adherence of the practitioner to discharge medication, measured as the proportion of patients for who medications were discontinued* | NA | 29.4 | NA | 18.5 | 0.11 | 0.11 |
| Liaw 2008 | C‐RT; 24 HCPs randomised by practices (n = 19) | Proportion of GPs who provided of children with asthma with a written asthma action plan, self‐reported measure | 12/15 | 6/9 | 10/17 | 13/15 | 0.20 | 0.20 |
| McEwen 2002 | RT; 107 HCPs randomised individually | Proportion of GPs who had recommended or prescribed Nicotine Replacement Therapy | NA | 46 | NA | 56 | 0.08 | 0.08 |
| Nicholas 2009 | RT; 449 HCPs randomised individually | Frequency of using sex‐specific body mass index (BMI)‐for‐age percentiles to screen for obesity for children aged 2‐5 years | 27 | 29 | 26 | 39 | 0.10 | 0.10 |
| Frequency of using sex‐specific body mass index (BMI)‐for‐age percentiles to screen for obesity for children aged 6‐11 years | 32 | 31 | 34 | 45 | 0.11 | |||
| Frequency of using sex‐specific body mass index (BMI)‐for‐age percentiles to screen for obesity for children aged 12‐20 years | 36 | 37 | 45 | 50 | 0.05 | |||
| Oakeshott 1994 | C‐RT; 170 HCPs randomised by practice (n = 62) | Relevant positive findings at radiology | 9/21 | 10/21 | 9/22 | 10/22 | ‐0.03 | ‐0.01 |
| Radiological request forms giving physical findings | 14/21 | 12/21 | 13/22 | 13/22 | ‐0.01 | |||
| Proportion of radiology requests conforming to the guidelines | 16/21 | 15/21 | 16/22 | 18/22 | 0.10 | |||
| Perria 2007 | C‐RT; 4422 patients randomised by HCP (n = 252) | Proportion of patients who were prescribed 3 measurements of glycosylated haemoglobin with at least 2 months’ interval per year (metabolic control) | 196/2232 | 230/2232 | 169/2190 | 222/2190 | 0.00 | 0.00 |
| Proportion of patients who were prescribed all macrovascular complications assessment tests per year (macrovascular control) | 244/2232 | 277/2232 | 235/2190 | 257/2190 | ‐0.01 | |||
| Proportion of patients who were prescribed all microvascular complications assessment tests per year (microvascular control) | 112/2232 | 105/2232 | 98/2190 | 108/2190 | 0.00 | |||
| Rahme 2005 | C‐RT; 167 HCPs randomised by town (n = 8) | Proportion of adequate prescriptions relative to the total number of prescriptions of acetaminophen, NSAIDs, or COX‐2 inhibitors | 675/1437 | 593/1209 | 799/1569 | 712/1317 | 0.05 | 0.05 |
| Shah 2014 | C‐RT; Unclear number of HCPs randomised by practice (n = 80) | Proportion of high risk patients prescribed a statin (initiation or ongoing use), assessed by chart review | NA | 725/797 | NA | 700/795 | ‐0.03 | ‐0.03 |
| Tsuji 2009 | C‐RT; 234 patients randomised by HCP (n = 8) | Proportion of patients with a prescription of an antidepressant at the first appointment with the clinician | NA | 100/114 | NA | 119/120 | 0.11 | 0.11 |
| Ulbricht 2014 | RT; 852 HCPs randomised individually | Proportion of GPs who assessed patients for psychotropic prescription drug abuse, assessed by phone interview with GP | NA | 342/397 | NA | 405/455 | 0.03 | 0.03 |
| Proportion of GPs who referred patients because of psychotropic prescription drug dependence, assessed by phone interview with GP | NA | 183/397 | NA | 225/455 | 0.03 | |||
| Proportion of GPs who treated patients for psychotropic prescription drug dependence, assessed by phone interview with GP | NA | 341/397 | NA | 395/455 | 0.01 | |||
| Weaver 2016 | C‐RT; 123 HCPs randomised by practice (n = 20) | Proportion of completed visits for which Sexually Transmitted Infections (STI) management tasks were completed during an unannounced SP encounter ‐ Correct medication offer | 10/29 | 9/28 | 8/32 | 8/27 | ‐0.03 | ‐0.03 |
| Proportion of completed visits for which Sexually Transmitted Infections (STI) management tasks were completed during an unannounced SP encounter ‐ HIV test offer | 18/29 | 17/28 | 16/32 | 17/27 | 0.02 | |||
| Proportion of completed visits for which Sexually Transmitted Infections (STI) management tasks were completed during an unannounced SP encounter ‐ Condoms provision | 13/29 | 10/28 | 7/32 | 9/27 | ‐0.02 | |||
| Proportion of completed visits for which Sexually Transmitted Infections (STI) management tasks were completed during an unannounced SP encounter ‐ Provision of partner notification slips | 10/29 | 11/28 | 6/32 | 7/27 | ‐0.13 | |||
| Proportion of completed visits for which Sexually Transmitted Infections (STI) management tasks were completed during an unannounced SP encounter ‐ Offer of a genital exam | 11/29 | 13/28 | 15/32 | 10/27 | ‐0.09 | |||
| Beaulieu 2004 | RT; 3293 HCPs randomised individually | Antiplatelets prescription | Quote: "we observed an overall increase of 10% in the prescribing rates for antiplatelet agents and beta blockers from 1997 to 1999, and a smaller overall increase in the prescribing rates for hypolipaemic drugs. However, for hypolipaemic drugs these increases were not distributed equally among patient age groups: greater increases were seen for patients aged greater than or equal to 70 years (Figure 2b)" (improvement) | |||||
| Hypolipaemics prescription (β‐blockers) | ||||||||
| Bjornson 1990 | RT; 576 HCPs randomised individually | Partial change of therapy | Quote: "a total of five (0.9%) of the physicians in the two groups switched their patients to both hydralazine and isosorbide (full change); another 23 (4.05%) switched them to at least one of the drugs or discontinued prazosin (partial change)" (indeterminate) | |||||
| Zwarenstein 2014 | C‐RT; 5048 HCPs randomised by practice (n = 4125) | Percentage of patients obtaining retinal screening within 90 days of mail out (crude success rate) | In order to present the quartiles, the percentage of patients receiving an eye examination was determined for each physician, and these percentages were summarised for each intervention group. Group practices were not taken into account for this crude analysis. Quote: "No intervention effect was detected (eye exam rates were 31.6% for patients of control physicians, 31.3% for the insert, 32.8% for the outsert, 32.3% for those who received both, and 31.2% for those who received both plus the patient reminder with the largest 95% confidence interval around any effect extending from −1.3% to 1.1%)" (no impact) |
|||||
| Zwarenstein 2016 | C‐RT; 4504 HCPs randomised by practice (n = 3734) | Percentage of patients aged over 65 and newly diagnosed with hypertension who were prescribed a thiazide as the sole initial prescription medication | Quote: "This printed information intervention was designed to increase physician prescribing of thiazides as the first line pharmaceutical treatment for hypertension. The interventions, evaluated in a very large trial, with sufficient power to detect a small change in physician behaviour, failed to change prescribing practice. This confirms the results of studies that found no impact of mailing the Ontario hypertension guidelines to all physicians in Ontario. [...] We found that only 27.5 % of the individuals newly started on antihypertension medication were started on only a thiazide. This is similar to the rate of 29% reported by Morgan et al. for another Canadian jurisdiction (although Morgan et al. included patients whose first hypertension treatment was a thiazide diuretic along with another antihypertensive drug, in addition to those who received only a thiazide diuretic) but lower than the 35% rate reported for Ontario between 1994 and 2002 [17]." (no impact) | |||||
* Results were transformed so that a positive difference in outcomes between groups could be interpreted as an improvement in outcome.
⭐Standard median effect size across all studies in this table = 0.04.
¥ Baseline measures not comparable
∡ Confidence intervals were not included due to a unit of analysis error.
ACE: Angiotensin‐converting enzyme ASA: Acetylsalicylic acid BMI:Body mass index COX‐2: cyclooxygenase‐2 GP: General practitioner HCP: Healthcare professional HIV: Human immunodeficiency viruses NA: Not available NSAID:Nonsteroidal anti‐inflammatory drugs SP: Standardised patient STI: Sexually transmitted infections
2. Comparison 1, RT design, healthcare professionals' practice outcome measured with continuous variables.
|
Study Study design Numbers of HCPs and randomisation units |
Outcome | Control group | Experimental group | Standard effect size | Weighted median effect size⭐ | ||||
| N | Pre‐mean (SD) | Post‐mean (SD) | N | Pre‐mean (SD) | Post‐mean (SD) | ||||
|
Denig 1990 RT 124 HCPs randomised individually |
Antispasmodic prescription ‐ undesirable antispasmodics (IBS)* | 90 | 28.2 (31.6) | 29 (28.3) | 96 | 27.2 (38.2) | 25.6 (33.6) | 0.11 | 0.13 |
| Antispasmodic prescription ‐ all antispasmodics (IBS)* | 90 | 124.9 (88.2) | 130.4 (101.2) | 96 | 116.5 (92.7) | 115.7 (97.5) | 0.15 | ||
|
Dubey 2006 C‐RT 210 HCPs randomised by practice (n = 4 practices) |
Percentage of up‐to‐date preventive health services delivered per patient | 261 | 51.8 (17.3) | 48.9 (16.7) | 248 | 51.4 (22.5) | 71.7 | 0.52 | 0.52 |
|
Kottke 1989 RT 66 HCPs randomised individually |
Average proportion of patients asked by physicians if they smoke | 17 | NA | 51.4 (24.9) | 22 | NA | 61 (29) | 0.35 | 0.37 |
| Proportion of patients asked by physicians to quit smoking for each physician | 17 | NA | 39.7 (14.2) | 22 | NA | 54.9 (20) | 0.86 | ||
| Proportion of smoking patients who were asked to set a quit date for each physician | 17 | NA | 5.4 (17.3) | 22 | NA | 9.6 (19.5) | 0.23 | ||
| Proportion of smoking patients who were given a follow‐up appointment for each physician | 17 | NA | 3.8 (5.5) | 22 | NA | 6.9 (10.1) | 0.37 | ||
| Smoking patients who received supportive materials | 17 | NA | 10.6 (7.7) | 22 | NA | 36.4 (15.7) | 2.01 | ||
|
McEwen 2002; RT; 107 HCPs randomised individually |
Rate of opportunistic advice per week | 37 | NA | 2.8 | 37 | NA | 4.9 | 0.66 | 0.57 |
| Rate of giving counselling about stopping smoking per week | 37 | NA | 1 | 37 | NA | 2.2 | 0.49 | ||
|
Ulbricht 2014 RT 852 HCPs randomised individually |
Mean number of patients assessed for psychotropic prescription drug abuse | 342 | NA | 5.08 | 405 | NA | 5.23 | 0.02 | 0.02 |
| Mean number of patients referred because of psychotropic prescription drug dependence | 183 | NA | 2.52 | 225 | NA | 2.6 | 0.01 | ||
| Mean number of patients treated for psychotropic prescription drug dependence | 341 | NA | 9.72 | 395 | NA | 10.9 | 0.06 | ||
|
Mohammadi 2015 RT 200 HCPs randomised individually |
Prescription errors ; Number of prescriptions of each GP* | 100 | 164.57 | 157.73 | 95 | 229.24 | 185.65 | ‐0.17 | ‐0.11 |
| Prescription errors ; Number of items in prescriptions* | 100 | 3.22 | 3.32 | 95 | 3.61 | 3.5 | ‐0.22 | ||
| Number of injection drugs prescibed ‐ Prescription errors* | 100 | 88.68 | 78.48 | 95 | 149.64 | 85.88 | ‐0.09 | ||
| Prescription errors ; Number of corticosteroids prescribed* | 100 | 38.72 | 31.11 | 95 | 61.19 | 34.9 | ‐0.11 | ||
| Prescription errors ; Number of penicillin injections prescribed* | 100 | 24.27 | 13.83 | 95 | 36.89 | 12.77 | 0.05 | ||
| Prescription errors ; Number of cephalosporins prescribed* | 100 | 9.16 | 7.19 | 95 | 18.75 | 10.52 | ‐0.23 | ||
| Prescription errors ; Number of aminoglycosides prescribed* | 100 | 1.49 | 1.19 | 95 | 1.82 | 1.6 | ‐0.11 | ||
| Prescription errors ; Number of NSAIDs prescribed* | 100 | 16.75 | 13.92 | 95 | 31.14 | 20.01 | ‐0.28 | ||
| Prescription errors ; Number of injection solutions prescribed* | 100 | 12,39 | 14.71 | 95 | 22.45 | 18.32 | ‐0.17 | ||
| Prescription errors ; Number of prescriptions of IV gentamicin + ceftriaxone* | 100 | 1.01 | 0.96 | 95 | 1.57 | 0.73 | 0.11 | ||
| Cost of prescriptions* | 100 | 36312 | 35261 | 95 | 32016 | 33799 | 0.15 | ||
|
Watson 2001 RT 72 HCPs from 20 practices |
Prescription of 3 recommended NSAIDS relative to total NSAID prescribing (mean in all practices) (%) | 36 | 79 (4.9) | 81.2 (3.7) | 36 | 77 (7.6) | 80.3 (7.2) | ‐0.16 | ‐0.16 |
|
Avorn 1983 RT 435 HCPs randomised individually |
Mean number of units prescribed/physician (all three drugs) | 140 | 5415 (NA) | 4921 (NA) | 132 | 5875 (NA) | 5071 (NA) | NA | NA |
| Quote: "a significant difference was found in the post‐intervention prescribing pattern of the face‐to‐face group as compared with those of the other physicians in the study in terms of units of medication (number of tablets or capsules) prescribed for the three target‐drugs groups". (improvement) | |||||||||
|
Azocar 2003 RT 323 HCPs randomised individuall |
Guideline adherence (continuation of treatment. i.e. more than 180 days of treatment) | Quote: "finally, there were no differences in the delivery of continuation treatment across the dissemination group despite the fact that this practice is heavily emphasized in UBH, AHCPR, and APA treatment guidelines. Only 19% of study patients received continuation care" (no effect). | |||||||
| Guideline adherence (documentation of a mental health or substance abuse comorbidity) | Quote: "detection of comorbid substance use disorders by study clinicians was low, with only 0.6% documenting the detection of substance abuse or dependence where actual rates are to be approximately 15%" (no effect). | ||||||||
| Guideline adherence (documentation of medical condition inducing depression) | Quote: "detection of depression due to medical problems by clinicians, using Mood Disorder Due to a Medical Condition of the Diagnostic and Statistical Manual Fourth Edition (DSM IV) diagnosis code as a proxy, also was remarkably low at 0.4%" (no effect). | ||||||||
|
Nicholas 2009 RT 449 HCPs randomised individually |
Frequency of using sex‐specific body mass index (BMI)‐for‐age percentiles to screen for obesity for children aged 2‐5 years | Quote:"At follow‐up, more physicians in the intervention group than in the control group reported using BMI percentiles to screen for childhood obesity. Compared with physicians in the control group, physicians in the intervention group had a larger increase in their routine use of BMI percentiles to screen children aged 2 to 5, 6 to 11, and 12 to 20 years, although the differences in the older 2 groups did not attain statistical significance." (improvement) | |||||||
| Frequency of using sex‐specific body mass index (BMI)‐for‐age percentiles to screen for obesity for children aged 6‐11 years | |||||||||
| Frequency of using sex‐specific body mass index (BMI)‐for‐age percentiles to screen for obesity for children aged 12‐20 years | |||||||||
|
Tziraki 2000 C‐RT 810 practices randomised |
Level of compliance to the nutrition manual; extent to which the office was organised to provide nutrition information and promote nutrition‐related activities (office organisation); range from 0‐12, and then transformed to percentages | Quote: "The adoption of the manual’s recommendations was highest among the practices in the training group as reflected by their higher adherence scores. They organized their office (P = .005) and screened their patients regarding their eating habits (P = .046) significantly more closely to the recommendations of the nutrition manual than practices in the manual‐only group. However, despite being the highest in compliance, the training group practices were only 54.9% adherent to the manual’s recommendations regarding nutrition advice/referral, and 28.5% adherent to its recommendations on office organization, 23.5% adherent to its recommendations on nutrition screening, and 14.6% adherent to its patient follow‐up recommendations." (improvement in some outcomes, no improvement in others) | |||||||
| Level of compliance to the nutrition manual; extent to which the practice performed nutrition screening (nutrition screening); range from 0‐22, and then transformed to percentages | |||||||||
* Results were transformed so that a positive difference in outcomes between group could be interpreted as an improvement in outcome.
⭐ Standard median effect size across all studies in this table = 0.11
AHCPR:Agency for Health Care Policy and Research APA: American Psychiatric Association BMI:Body mass index DSM IV: Diagnostic and Statistical Manual of Mental Disorders version IV HCP: Healthcare professional IBS: Irritable bowel syndrome IV: Intravenously NA: Not available NSAID: Nonsteroidal anti‐inflammatory drugs
3. Comparison 1, CBA design, healthcare professional's practice outcome measured with continuous variables.
| Study | Outcome | Control group mean (standard error) | Experimental group mean (standard error) | Overall effect | ||||
| Pre | Post | % increase | Pre | Post | % increase | |||
| Steffensen 1997 | Mean sales of two oral anticoagulants per month (defined daily dose of oral anticoagulant/1000 inhabitants) | 165.0 (0.8) | 268.8 (1.0) | 63 | 325.0 (1.2) | 537.9 (1.5) | 66 | Quote (p.212): "The use of oral anticoagulants increased substantially in both counties during the 2‐year follow‐up, but the difference in relative change between the counties was negligible." |
4. Comparison 1, ITS design, healthcare professionals' practice outcomes (data were re‐analysed with segmented regression statistical model).
| Study ID ‐ PEM ID (seeAppendix 2) | Outcome | Change in slope per month (SE) | P‐value‡ | Weighted median effect size (standardised change in slope)⭐ |
| Austin 2003 | Prevalence of ERT in women over 65 in Ontario: Percent of female patients over 65 receiving ERT Rx before and after HERS study | 0.18 (0.03) | *** | 6.21 |
| Incidence of ERT in women over 65 in Ontario: Incidence of female patients over 65 receiving ERT Rx before and after HERS study | 233 (17) | *** | ||
| Austin 2004A | Total number of claims for clonidine in Ontario for women 65 years of age and older | 4.21 (10.4) | NS | 0.40 |
| Austin 2004B | Relative market share of angiotensin‐converting enzyme inhibitors/angiotensin receptor blockers∡ | ‐0.45 (0.70) | NS | ‐0.74 |
| Relative market share of β‐blockers∡ | 0.07 (0.58) | NS | ||
| Relative market share of thiazide‐type diuretics | ‐0.45 (0.4) | NS | ||
| Relative market share of calcium channel blockers∡ | ‐0.30 (0.41) | NS | ||
| Austin 2005 | Statin prescribing (atorvastatin 80 mg/day): Total number of prescriptions of statin for residents age 65 and older in Ontario, Canada | 84.4 (8.8)*** | <.0001 | 9.61 |
| Statin prescribing (pravastatin 40 mg/day): Total number of prescriptions of statin for residents age 65 and older in Ontario, Canada ∡ | 115 (63) | NS | ||
| Barbaglia 2009 | Prevalence of HRT use in women aged 50 to 54 (%): Annual prevalence levels of hormone therapy use | 0.21(0.04) | * | 4.79 |
| Barber 2017 ‐ VHA OXY | Proportion of new oxycodone CR prescriptions that were preceded within the past 60 days by prescription for morphine or methadone | ‐0.03 (0.04) | NS | ‐0.71 |
| Barber 2017 ‐ FDA FENTA | Proportion of new fentanyl prescriptions prescribed to patients who were prescribed another opioid whose day’s supply overlapped the start of fentanyl | ‐0.03 (0.06) | NS | ‐0.42 |
| Barber 2017 ‐ VHA FENTA | Proportion of new fentanyl prescriptions prescribed to patients who were prescribed another opioid whose day’s supply overlapped the start of fentanyl ‐ Exclusion criteria specified | ‐0.08 (0.10) | NS | ‐0.83 |
| Barber 2017‐ VHA PROPO | Proportion of new propoxyphene prescriptions | 0.14 (0.03) | *** | ‐6.04 |
| Proportion of new propoxyphene prescriptions for which dose is less than 390 mg per day for propoxyphene HCL and 600 mg for propoxyphene napsylate | ‐0.02 (0.004) | *** | ||
| Black 2002 | Mean number of surgery per 10,000 children aged under 10 years for 13 health districts ∡ | 1.39 (0.31) | ** | 4.48 |
| Buyle 2010 | Monthly ratio of intravenous versus total fluoroquinolone consumption, in daily defined doses per 1000 bed days | 0.07 (0.23) | NS | 0.32 |
| Chandy 2014 | Average monthly overall antibiotic (Tetracyclines) defined daily doses (DDD) normalised for 100 beds | 0.99 (0.18) | *** | 5.63 |
| Fijn 2000 | Proportion of patients newly prescribed antithrombotic therapy after having a diagnosis of Ischaemic heart disease | Insufficient data | NA | NA |
| Fonarow 2009 ‐ MIRACL | Change in rates (%) of lipid lowering agent use for all patients, pre‐ and post‐MIRACL | ‐0.51 (0.11) | *** | ‐0.28 |
| Rate (%) of lipid lowering agent use pre and post‐MIRACL | ‐0.04 (0.14) | NS | ||
| Rate (%) of lipid lowering agent use pre and post‐MIRACL | 0.11 (0.064) | NS | ||
| Fonarow 2009 ‐ ACC‐AHA NSTEMI | Change in rates (%) of lipid lowering agent use for all patients, pre‐ and post‐ACC AHA NSTEMI guideline | 0.36 (0.092) | ** | 2.39 |
| Rate (%) of lipid lowering agent use pre and post‐ACC AHA NSTEMI guideline | 0.23 (0.095) | * | ||
| Rate (%) of lipid lowering agent use pre and post‐ACC AHA NSTEMI guideline | 0.01 (0.73) | NS | ||
| Fonarow 2009 ‐ PROVE‐IT TIMI 22 | Change in rates (%) of lipid lowering agent use for all patients, pre‐ and post‐PROVE‐IT TIMI 22 | 0.56 (0.32) | NS | 0.13 |
| Rate (%) of lipid lowering agent use pre and post‐PROVE‐IT TIMI 22 | ‐0.37 (0.45) | NS | ||
| Rate (%) of lipid lowering agent use pre and post‐PROVE‐IT TIMI 22 | 0.05 (0.37) | NS | ||
| Fonarow 2009 ‐ ACC‐AHA STEMI Guideline | Change in rates (%) of lipid lowering agent use for all patients, pre‐ and post‐ACC AHA STEMI Guideline | ‐0.58 (0.30) | NS | ‐0.18 |
| Rate (%) of lipid lowering agent use pre and post‐ACC AHA STEMI Guideline | ‐0.06 (0.32) | NS | ||
| Rate (%) of lipid lowering agent use pre and post‐ACC AHA STEMI Guideline | ‐0.05 (0.40) | NS | ||
| Fukuda 2009 | Adjusted odds ratios of receiving breast conserving surgery in patients with breast cancer | Insufficient data | NA | NA |
| Guay 2007 | Total number of HRT prescriptions dispensed per month∡ | 1144 (158) | *** | 7.23 |
| Haas 2004 ‐ HERS study | Percentage of women reporting hormone use∡ | 0.60 (0.20) | * | 3.06 |
| Haas 2004 ‐ WHI study | Percentage of women reporting hormone use∡ | 1.79 (0.31) | *** | 5.68 |
| Hersh 2004 | Total number of prescriptions per year (before and after the publication of Heart and Estrogen/progestin Replacement Study (HERS) ‐ August 1998) | Insufficient data | NA | NA |
| Jackevicius 2001 | Rate of change in the prescription of statins | 0.52 (0.044) | *** | 11.78 |
| Jameson 2010 | Percentage of patients following a lower limb arthroplasty receiving LMWH | 0.75 (0.084) | *** | 8.96 |
| Judge 2015 | Proportion of prescriptions of Methotrexate (MTX) within 3 months of RA diagnosis date | 0.04 (0.01) | * | 3.29 |
| Proportion of prescriptions of any Disease‐modifying antirheumatic drugs (DMARD) within 3 months of RA diagnosis date | 0.05 (0.01) | * | ||
| Proportion of prescriptions of Methotrexate (MTX) within 12 months of RA diagnosis date | Insufficient data | NA | ||
| Proportion of prescriptions of any Disease‐modifying antirheumatic drugs (DMARD) within 12 months of RA diagnosis date | Insufficient data | NA | ||
| Juurlink 2004 | Rate of spironolactone Rx | 11.5 (0.92) | *** | 12.46 |
| Kabir 2007‐ALLHAT | Monthly rate of new prescriptions for ACE inhibitors before and after Anti‐hypertension and Lipid‐Lowering Treatment to prevent Heart Attack (ALLHAT December 2002) | 0.28 (0.08) | * | 3.69 |
| Monthly rate of new prescriptions for amlodipine before and after Anti‐hypertension and Lipid‐Lowering Treatment to prevent Heart Attack (ALLHAT December 2002) | Insufficient data | NA | ||
| Monthly rate of new prescriptions for thiazide‐type diuretics before and after Anti‐hypertension and Lipid‐Lowering Treatment to prevent Heart Attack (ALLHAT December 2002) | ‐0.06 (0.14) | NS | ||
| Kabir 2007‐LIFE | Monthly rate of new prescriptions for atenolol before and after Losartan Intervention for End point reduction (LIFE February 2002) | 0.05 (0.06) | NS | ‐0.81 |
| Monthly rate of new prescriptions for losartan before and after Losartan Intervention for End point reduction (LIFE February 2002) | ‐0.04 (0.05) | NS | ||
| Kabir 2007‐VALUE | Monthly rate of new prescriptions for Valsartan before and after Valsartan Anti‐hypertensive Long‐term Use Evaluation (VALUE June 2004) | 0.001 (0.05) | NS | 0.03 |
| Monthly rate of new prescriptions for calcium channel blockers before and after Valsartan Anti‐hypertensive Long‐term Use Evaluation (VALUE June 2004) | 0.13 (0.08) | NS | ||
| Komen 2017 ‐ ESC | Proportion of newly initiated patients on novel oral anticoagulants (NOACs) each month | 2.23 (0.4) | *** | 5.74 |
| Komen 2017 ‐ PN | Proportion of newly initiated patients on novel oral anticoagulants (NOACs) each month | ‐0.19 (0.32) | NS | ‐0.60 |
| Komen 2017‐ DTC | Proportion of newly initiated patients on novel oral anticoagulants (NOACs) each month | ‐0.93 (0.4) | * | ‐2.44 |
| Komen 2017 ‐ FN | Proportion of newly initiated patients on novel oral anticoagulants (NOACs) each month | ‐0.47 (0.8) | NS | ‐0.56 |
| Lam 2009 | Rate of statin use per 1000 diabetic haemodialysis patients | 1.73 (1.33) | NS | 1.30 |
| Luo 2018 | ARNI (angiotensin receptor neprilysin inhibitor) uptake in clinical practice | ‐0.57 (0.44) | NS | ‐1.29 |
| Majumdar 2003‐ HOPE | Percentage of augmentation in the number of prescriptions | 12.47 (0.62) | *** | 20.02 |
| Percentage of augmentation in the number of prescriptions | 6.72 (0.71) | *** | ||
| Majumdar 2003‐ RALES | Percentage of augmentation in the number of prescriptions | 2.59 (0.55) | * | 4.72 |
| Percentage of augmentation in the number of prescriptions | 1.70 (0.89) | NS | ||
| Majumdar 2004 | Total number of prescriptions in millions (numbers in the "outcome" column are not means; they are the total number of prescriptions dispensed). | 0.72 (0.60) | NS | 3.69 |
| Total number of prescriptions in millions (numbers in the "outcome" column are not means; they are the total number of prescriptions dispensed). | 0.12 (0.02) | * | ||
| Total number of prescriptions in millions (numbers in the "outcome" column are not means; they are the total number of prescriptions dispensed). | 0.11 (0.03) | * | ||
| Total number of prescriptions in millions (numbers in the "outcome" column are not means; they are the total number of prescriptions dispensed). | ‐0.02 (0.01) | NS | ||
| Total number of prescriptions in millions (numbers in the "outcome" column are not means; they are the total number of prescriptions dispensed). | 0.15 (0.02) | *** | ||
| Markovitz 2017 ‐ Formulary | Proportion of prescribing of moderate‐to‐high‐intensity statins among high‐risk patients | 0.21 (0.02) | * | 10.52 |
| Markovitz 2017‐ ACC/AHA guideline | Proportion of prescribing of moderate‐to‐high‐intensity statins among high‐risk patients | 0.06 (0.03) | * | 2.40 |
| Mason 1998/99 | Total volume of antidepressant treatment prescribed in numbers in England (the "outcome" column does not show means; it shows the total volume) | ‐1402 (281) | *** | ‐2.38 |
| Total volume of antidepressant treatments prescribed in numbers in England (the "mean" column are not means; they are the total volume) | ‐327(138) | * | ||
| Mason 2001 | Mean number of procedures per 1000 habitants under 15 years old for 14 regions | 0.02(0.003) | *** | 5.82 |
| Matowe 2002 | Total number of X‐ray imaging requests from general practice in two Grampian radiology departments in Scotland | 11.2 (18.20) | NS | 0.62 |
| Meyer 2007 | Expressed as daily defined doses (DDD) and normalised per 1000 patient days. One DDD is the standard adult daily dose of an antimicrobial agent for 1 day of treatment defined by the WHO. | ‐1.89 (5.77) | NS | ‐0.33 |
| Naimer 2017 | Fifteen outcomes (see Naimer 2017) | Insufficient data | NA | NA |
| Ouldali 2017 | Antibiotic prescription rate for ARTI (acute respiratory tract infections) per 1000 PED visits in the PED discharge prescriptions | ‐0.57 (0.93) | NS | ‐0.61 |
| Rigobon 2019 | Proportion of eligible patients with statins prescriptions | Insufficient data | NA | NA |
| Proportion of eligible patients with ACEI/ARB prescriptions | Insufficient data | NA | ||
| Proportion of eligible patients with antiplatelets prescriptions | Insufficient data | NA | ||
| Roberts 2007 | Percent use of uncemented prostheses∡ | ‐0.14 (0.05) | * | ‐2.75 |
| Percent use of hybrid prostheses of all hips implanted | ‐0.23 (0.06) | * | ||
| Roifman 2017 ‐ Oct2005 | Age‐ and sex‐standardised monthly rate of MPI scans per 10,000 adults | ‐0.007 (0.03) | NS | ‐0.28 |
| Roifman 2017 ‐ Jun2009 | Age‐ and sex‐standardised monthly rate of MPI scans per 10,000 adults | 0.09 (0.03) | * | 3.10 |
| Roifman 2017 ‐ Feb2014 | Age‐ and sex‐standardised monthly rate of MPI scans per 10,000 adults | ‐0.001 (0.03) | NS | ‐0.04 |
| Salzler 2017 ‐ CMSG | Use of carotid artery stenting for high‐risk patients | Insufficient data | NA | NA |
| Salzler 2017 ‐ CREST | Use of carotid artery stenting for high‐risk patients | Insufficient data | NA | NA |
| Santerre 1996 | Vaginal birth after previous C‐section: Percentage of number of vaginal birth after C‐section in 55 hospitals | Insufficient data | NA | NA |
| Shah 2008 | Number of new users of thiazolidinedione (rosiglitazone or pioglitazone) | ‐121.1 (10.5) | *** | ‐11.54 |
| Stafford 2004 | Number of α‐blockers prescriptions dispensed ‐ all α‐blockers (both newly dispensed and refills)∡ | 0.05 (0.005) | *** | 10.21 |
| Stocks 2017‐ MHRA2004 | Prevalence of prescribing of antipsychotics to older patients with dementia without psychosis | 0.008 (0.05) | NS | 0.76 |
| Prevalence of prescribing of antipsychotics to older patients with dementia | 0.03 (0.04) | NS | ||
| Stocks 2017 ‐ NICE2006 | Prevalence of prescribing of antipsychotics to older patients with dementia without psychosis | 0.05 (0.04) | NS | 0.57 |
| Prevalence of prescribing of antipsychotics to older patients with dementia | 0.02 (0.04) | NS | ||
| Stocks 2017 ‐ MHRA2009 | Prevalence of prescribing of antipsychotics to older patients with dementia without psychosis | 0.17 (0.02) | ** | 8.36 |
| Prevalence of prescribing of antipsychotics to older patients with dementia | 0.19 (0.02) | *** | ||
| Stocks 2017 ‐ CHALL | Prevalence of prescribing of antipsychotics to older patients with dementia without psychosis | ‐0.11 (0.02) | ** | ‐8.04 |
| Prevalence of prescribing of antipsychotics to older patients with dementia | ‐0.12 (0.01) | *** | ||
| Wang 2005 | LDL cholesterol reporting for diabetes visits relative to CHD visits | Insufficient data | NA | NA |
| LDL cholesterol reporting for diabetes visits relative to CHD visits: (Percent of diabetes visits with LDL cholesterol reported) minus (Percent of Chad visits with LDL cholesterol reported) | Insufficient data | NA | ||
| Weiner 2017 | Total number of opioid prescriptions per month by emergency physicians | 303 (147) | * | 2.06 |
| Weiss 2011 | Monthly prescribing rates (no. of prescriptions/1000 inhabitants) for all antibiotics in Quebec relative to the rest of Canada∡ | ‐0.15 (0.07) | * | ‐2.14 |
∡ Results were transformed so that a positive difference in outcomes between groups could be interpreted as an improvement in outcome.
‡ P value < 0.0001:***, < 0.001: **, ≤ 0.05: *, > 0.05: NS.
⭐Standardardised median change in level across all studies in this table = 0.69.
ACE: Angiotensin‐converting enzyme ACEI: Angiotensin‐converting enzyme inhibitors ARB: Angiotensin II Receptor Blockers
ARNI: Angiotensin receptor neprilysin inhibitor ARTI: Acute respiratory tract infections CHD: Coronary heart disease CR: Controlled release DDD: Defined daily doses DMARD: Disease‐modifying antirheumatic drugs ERT: Estrogen replacement therapy HCL: Hydrochloride HRT: Hormone replacement therapy LDL: Low‐density lipoprotein LMWH: Low molecular weight heparin MPI: Myocardial perfusion imaging MTX: Methotrexate NA: Not available NOAC: Non‐Vitamin K antagonist oral anticoagulants NS: Not statistically significant PED: Pediatric emergency departments RA: Rheumatoid arthritis Rx: Medication WHO: World Health Organization
5. Comparison 1, RT design, patient health outcomes measured with dichotomous variables.
| Study | Study design; Numbers of HCPs and randomisation units | Outcome | Control (n/N) | Experimental (n/N) | Absolute risk difference (95% CI) | Weighted median effect size⭐ | ||
| Pre | Post | Pre | Post | |||||
| Evans 1986 | C‐RT; 76 HCPs randomised by practice (n = 62) | Control of hypertension: Mean DBP < 99 mmH | NA | 45/81 | NA | 63/102 | 0.06 | 0.05 |
| Control of hypertension at one year: Proportion of patients with minimum DBP < 90 mm Hg | NA | 54/81 | NA | 68/102 | 0.00 | |||
| Control of blood pressure of hypertensive patients: Proportion of patients on Hypertension Detection and Follow‐up Program. [Control of hypertension HDFP criteria (Table 3)] | NA | 44/81 | NA | 60/102 | 0.05 | |||
| Izcovich 2011 | RT; 809 patients randomised individually | Combined outcome consisting of the proportion of deaths or transfers to an ICU (intensive care unit)* | NA | 36/402 | NA | 40/407 | ‐0.01 | 0.00 |
| Proportion of rehospitalisations during the course of the study* | NA | 67/402 | NA | 68/407 | 0.00 | |||
| Shah 2014 | C‐RT; Unclear number of HCPs randomised by practice (n = 80) | Proportion of deaths or non‐fatal myocardial infarctions, from administrative databases (composite endpoint)* | NA | 11,536/466,076 | NA | 11,736/467,713 | 0.00 | 0.00 |
| Tsuji 2009 | C‐RT; 234 patients randomised by HCP (n = 8) | Clinical remission | NA | 65/114 | NA | 84/120 | 0.13 | 0.13 |
⭐Standard median effect size across all studies in this table = 0.02.
DBP: Diastolic Blood Pressure HCP: Healthcare professional HDFP: Hypertension Detection and Follow‐up Program ICU: Intensive care unit NA: Not available
6. Comparison 1, RT design, patient health outcomes measures using continuous variables.
|
Study Study design Numbers of HCPs and randomisation units |
Outcome | Control | Experimental | Standard effect size | Weighted median effect size⭐ | ||||
| N | Pre mean (SD) | Post mean (SD) | N | Pre mean (SD) | Post mean (SD) | ||||
|
Azocar 2003 RT 323 HCPs randomised individually |
Guidelines adherence (Combined outpatient) | 309 | NA | 4.5 (5.5) | 254 | 4.9 (4.9) | 0.08 | 0.08 | |
|
Kottke 1989 RT 66 HCPs randomised individually |
Proportion of patients who agreed to quit smoking for each physician | 17 | NA | 17.1 (8.1) | 22 | NA | 25.5 (12.9) | 0.76 | ‐0.14 |
| Proportion of patients who reported an attempt to quit smoking (more than 24 hours without smoking) | 17 | NA | 44.4 (12.6) | 22 | NA | 44 (9.6) | ‐0.04 | ||
| Duration of smoking cessation (in days) | 17 | NA | 74.2 (35.8) | 22 | NA | 66.7 (63.1) | ‐0.14 | ||
| Number of months patients have attempted to quit (patient report) | 17 | NA | 8.2 (2.0) | 22 | NA | 7.8 (1.2) | ‐0.25 | ||
| Proportion of patients who reported not smoking at the time of interview for each physician | 17 | NA | 14.3 (6.5) | 22 | NA | 12 (7.4) | ‐0.33 | ||
|
Dickinson 2003 RT 188 HCPs individually |
Emotional functioning subscale (MCS) subscale of the Functional Status (SF‐36) Scale for Abriged Somatization | 92 | NA | 48.5 | 91 | NA | 48.9 | 0.04 | ‐0.04 |
| Emotional functioning subscale (MCS) of the Functional Status (SF‐36) for Multisomatoform disorder | 55 | NA | 47.6 | 56 | NA | 47.8 | 0.02 | ||
| Emotional functioning subscale (MCS) of the Functional Status (SF‐36) for Somatization disorder | 43 | NA | 47.5 | 45 | NA | 48.7 | 0.12 | ||
| Physical functioning (PCS) subscale of the Functional Status (SF‐36) for Abriged Somatization | 92 | NA | 44.3 | 91 | NA | 42.4 | ‐0.17 | ||
| Physical functioning (PCS) subscale of the Functional Status (SF‐36) for Multisomatoform disorder | 55 | NA | 42.4 | 56 | NA | 41.3 | ‐0.10 | ||
| Physical functioning (PCS) subscale of the Functional Status (SF‐36) for Somatization disorder | 43 | NA | 42.2 | 45 | NA | 40.3 | ‐0.16 | ||
|
Fukuda 2018 C‐RT 357 HCPs randomised by residential aged care facility (n = 17) |
Distress induced by behavioural and psychological symptoms of dementia | 172 | 25.5 (27.3) | 25.1 (26.7) | 185 | 27.5 (22.6) | 22.7 (23.4) |
‐4.47 | ‐4.47 |
|
Izcovich 2011 RT 809 patients randomised individually |
Average length of stay (days of hospitalisation) | "The impact of bibliographic assistance on clinically important outcomes could not be proven by this study. However, results suggest that some interventions, such as delivering information by hand, might be beneficial in a subgroup of inpatients." (p.131) | |||||||
⭐Standard median effect size across all studies in this table = 0.05.
HCP: Healthcare professional MCS: Mental component summary NA: Not available PCS: Physical functioning SF‐36: 36‐item short form
7. Comparison 1, ITS design, patient health outcomes (data were re‐analysed with segmented regression statistical model).
| Study ID ‐ PEM ID (seeAppendix 2) | Outcome | Change in slope per month (SE) | P‐value‡ | Weighted median effect size (standardised change in slope)⭐ |
| Coopersmith 2002 | Central venous catheter days of catheter‐related bloodstream infections∡ | ‐0.02 (0.01) | NS | ‐1.42 |
| Hawley 2018 | 5‐year incidence rate of total hip replacement after incident RA diagnosis. | 0.07 (0.01) | *** | 5.56 |
| 5‐year incidence rate of total knee replacement after incident RA diagnosis. | 0.12 (0.01)*** | *** | ||
| Jameson 2010 | Complications from hip or knee replacement surgeries (venous thromboembolic events; VTE)∡ | ‐0.02 (0.01) | NS | 0.95 |
| Complications from hip or knee replacement surgeries (thrombocytopaenia; TCP)∡ | 0.01 (0.01) | NS | ||
| Juurlink 2004 | Rate of hospital admission for hyperkalaemia for patients with heart failure | 0.13 (0.02) | *** | 3.27 |
| Rate of in‐hospital death owing to hyperkalaemia for heart failure patients | 0.01 (0.004) | * | ||
| Lee 2018A ‐ G2011 | Postoperative revisits after ambulatory paediatric tonsillectomy for privately insured patients | 0.0006 (0.0005) | NS | 1.29 |
| Lee 2018A ‐ G2012 | Postoperative revisits after ambulatory paediatric tonsillectomy for privately insured patients | ‐0.0005 (0.0004) | NS | ‐1.10 |
| Lee 2018B ‐ NICE2007 | Voiding cystourethrogram use per 100,000 (age 0 to 2 years old) | 0.40 (0.19) | * | 1.29 |
| Voiding cystourethrogram use per 100,000 (age 3 to 10 years old) | 0.09 (0.07) | NS | ||
| Lee 2018B ‐ AAP2011 | Voiding cystourethrogram use per 100,000 (age 0 to 2 years old) | 0.67 (0.32) | * | 0.94 |
| Voiding cystourethrogram use per 100,000 (age 3 to 10 years old) | 0.05 (0.06) | NS | ||
| Li 2017 ‐ MRSA | This study lists 4 outcomes (see Li 2017) | Insufficient data | NA | NA |
| Li 2017 ‐ MRSA update | This study lists 4 outcomes (see Li 2017) | Insufficient data | NA | NA |
| Marincowitz 2018 ‐ SIGN1 | Hospital admissions in patients with head injury | 0.16 (0.1) | NS | 1.69 |
| Marincowitz 2018 ‐ 4H | Hospital admissions in patients with head injury | ‐0.12 (0.06) | NS | ‐1.91 |
| Marincowitz 2018 ‐ SIGN2 | Hospital admissions in patients with head injury | 0.08 (0.03) | * | 2.57 |
| Sakai 2017 | Incidence of infective endocarditis hospitalisation | ‐0.0006 (0.003) | NS | ‐0.21 |
∡ Results were transformed so that a positive difference in outcomes between groups could be interpreted as an improvement in outcome.
‡ P value < 0.0001:***, < 0.001: **, ≤ 0.05: *, > 0.05: NS.
⭐Standard median change in level across all studies in this table = 1.12
NA: Not available NS: Not statistically significant RA: Rheumatoid arthritis TCP: Thrombocytopaenia VTE: Venous thromboembolic events
8. Comparison 2, RT design, healthcare professionals' practice outcome measured with dichotomous variables.
|
Study Study design Numbers of HCPs and randomisation units |
Outcome | Paper‐based version (n/N) | Computerised version (n/N) | Absolute risk difference | Weighted median effect size | ||
| Pre | Post | Pre | Post | ||||
|
Jousimaa 2002 C‐RT 139 HCPs randomised individually |
Proportion of consultation decisions compliant with guidelines (laboratory examinations) | NA | 1372/1529 | NA | 1481/1640 | 0.01 | ‐0.02 |
| Proportion of consultation decisions compliant with guidelines (radiological examinations) | NA | 1416/1518 | NA | 1504/1604 | 0.00 | ||
| Proportion of consultation decisions compliant with guidelines (physical examinations) | NA | 1461/1545 | NA | 1494/1610 | ‐0.02 | ||
| Proportion of consultation decisions compliant with guidelines (other examinations) | NA | 248/307 | NA | 235/314 | ‐0.06 | ||
| Proportion of consultation decisions compliant with guidelines (procedures) | NA | 140/171 | NA | 152/196 | ‐0.04 | ||
| Proportion of consultation decisions compliant with guidelines (physiotherapy) | NA | 83/103 | NA | 77/98 | ‐0.02 | ||
| Proportion of consultation decisions compliant with guidelines (non‐pharmacological treatments) | NA | 110/122 | NA | 80/92 | ‐0.03 | ||
| Proportion of consultation decisions compliant with guidelines (pharmacological treatment) | NA | 1350/1568 | NA | 1391/1654 | ‐0.02 | ||
| Proportion of consultation decisions compliant with guidelines (referrals) | NA | 1508/1578 | NA | 1619/1684 | 0.01 | ||
HCP: Healthcare professional NA: Not available
Summary of findings 2. Printed educational material only versus single intervention.
| Printed educational material only vs. single intervention | ||||||
| Patient or population: healthcare professionals (physicians) Settings: general practice Intervention: computerised or electronic printed educational material Comparison: paper‐based printed educational material | ||||||
| Outcomes* | Design | Standard median effect size | Magnitude of effect | No of participants (studies) | Certainty of evidence (GRADE) | Results in words |
| Healthcare professionals' practice outcome measured using dichotomous variables Absolute risk difference across various outcomes Mean follow‐up: 20 months | Randomised trial | 0.02 lower (interquartile range from ‐0.03 to 0.00) | Very small (estimated Cohen's d: ‐0.15) | 139 healthcare professionals randomised individually (1 study, 1 PEM) | ⊕⊕⊝⊝ Low1 | PEM in computerised versions may make little or no difference to professionals' practice compared to PEM in printed versions |
| Healthcare professionals' practice outcome measured using continuous variables Standardised mean difference Mean follow‐up: 6 months | CBA | 0.44 higher (interquartile range cannot be estimated) | Not available | 32 healthcare professionals (1 study, 1 PEM) |
⊕⊝⊝⊝ Very low1,2 | |
| * Where studies reported more than one measure of each endpoint, the primary measure (as defined by the authors of the study) or the median measure was abstracted. For dichotomous measures, we calculated the odds ratio between the intervention of interest and the control intervention.For continuous measures, we calculated standardised mean difference by dividing the mean score difference of the intervention and comparison groups in each study by the pooled estimate standard deviation for the two groups | ||||||
| GRADE Working Group grades of evidence High quality: Further research is very unlikely to change our confidence in the estimate of effect. Moderate quality: Further research is likely to have an important impact on our confidence in the estimate of effect and may change the estimate. Low quality: Further research is very likely to have an important impact on our confidence in the estimate of effect and is likely to change the estimate. Very low quality: We are very uncertain about the estimate. | ||||||
1 We have downgraded due to inconsistency, as with a single study, this criterion could not be evaluated. This item was downgraded to be conservative.
2 We have downgraded due to unclear or inadequate allocation concealment.
Data synthesis
We structured data analysis using the statistical methods developed by Grimshaw and colleagues (Grimshaw 2004). Studies were grouped according to study design (ITS or controlled studies), type of end point (professional practice or patient health outcome, continuous or dichotomous) and type of comparison (PEM only versus no intervention or PEM only versus other intervention). For studies where the quantitative data were absent or insufficient to calculate effect sizes, we presented the qualitative data as presented by the authors and conducted a descriptive analysis of the effectiveness of the included PEMs. Scales varied from study to study, with some scales having positive outcomes with large values and others having positive outcomes with small values. In all cases, the effect size was standardised so that a positive difference between post‐intervention percentages or means was a favourable end point. To further facilitate interpretation, a magnitude of effect statement was formulated by estimating Cohen's d, defined as the mean effect divided by its standard deviation, by using formulas presented by Wan and colleagues (Wan 2014) to estimate these two quantities from the median and interquartile range (IQR).
Analyses were carried out using the SAS software package (version 9.4, SAS Institute Inc.), and Review Manager (RevMan 2014).
Summary of findings
The main outcomes of this review are healthcare professionals' practice and patient health outcomes. A single reviewer (AG) assessed the certainty of evidence for both of these types of outcomes using GRADE (GRADE 2009), and a second reviewer double‐checked the evaluation (BV). Disagreements were resolved by discussion between the reviewers and lead author (AG).
Subgroup analysis and investigation of heterogeneity
We considered the PEM characteristics that were listed previously (Data extraction and management) as potential sources of heterogeneity to explain variations in the results of the included studies. We prepared box plots (displaying median effect sizes, interquartile ranges, and outliers) and visually explored the size of the observed effects in relationship to each of these characteristics. Based on the work of various authors outlined in the Background section (How the intervention might work), we hypothesised that endorsement (Tseng 1999; Wathen 2002), tailoring (Revere 2001), increased frequency (Davis 2009; McGuire 1989), better certainty of evidence (Foy 2002; Grol 1998), educational component, and format (Grandage 2002; Marriott 2000; Wang 2009) would enhance the PEM effectiveness. We did not have a priori hypotheses for the other potential effect modifiers.
Results
Description of studies
See Characteristics of included studies, Characteristics of excluded studies.
Results of the search
In its last update, the current review included 45 studies (Giguere 2012). For the current update, we identified 5959 potentially relevant reports, 5482 of which we excluded based on their titles and abstracts (Figure 1). The complete texts of the remaining 477 reports were retrieved and screened against our inclusion criteria. This second full‐text screening led to the exclusion of 438 reports, leaving 39 new included studies in this update, for a total of 84 included studies.
1.
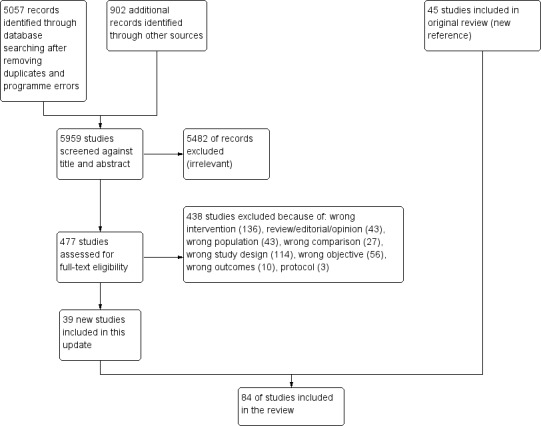
Study flow diagram for the current update.
Included studies
We included a total of 84 studies, of which 50 used an ITS study design, 32 were randomised trials, and two used a CBA study design (Adereti 2018; Steffensen 1997). The majority of included studies (82/84) compared the effectiveness of PEM only to no intervention (comparison 1: PEM only versus no intervention). Two of the included studies addressed comparison 2 (PEM only versus single intervention): a CBA (Adereti 2018) and a RT (Jousimaa 2002). In both cases, the single intervention was an electronic tool. None of the included studies addressed comparison 3. Eighteen of the included studies were cluster‐randomised trials.
The majority of the included studies took place in North America (23 in Canada, 25 in the US). We also included 26 studies conducted in Europe (including 14 in the UK), three in East‐Asia (Fukuda 2009; Fukuda 2018; Kajita 2010), two in South America (Izcovich 2011; Tsuji 2009), one in Australia (Liaw 2008), one in South Asia (Chandy 2014), two in Africa (Adereti 2018; Weaver 2016), and one in the Middle East (Mohammadi 2015).
Thirty studies took place in general or family medicine practices, thirteen in outpatient (ambulatory) settings, fifteen in hospitals, four in mixed settings and one in a residential aged care facility (Fukuda 2018). The clinical settings of 13 studies were unclear; rather, participants were selected from within a specific geographic region.
In most studies (64/84), participants were physicians. In two studies, participants consisted of physicians and other types of professionals, either nurses (Coopersmith 2002) or pharmacists (Weiss 2011). One study included psychologists or psychiatrists (Azocar 2003). In two studies, participants were either nurses (including interns) (Adereti 2018) or staff of residential aged care facilities without medical specialists and/or registered nurses (Fukuda 2018). It was unclear which type of health professionals participated in the remaining studies.
Description of printed educational materials
A total of 113 PEMs were evaluated in the 84 included studies. This apparent discrepancy, stems from two elements: (1) a few studies (Austin 2005; Barber 2017; Fonarow 2009; Haas 2004; Hersh 2004; Kabir 2007; Komen 2017; Lee 2018A; Majumdar 2003; Marincowitz 2018; Markovitz 2017; Roifman 2017; Salzler 2017; Stocks 2017; Wang 2005) evaluated more than one PEM, and (2) the same PEMs were evaluated in several studies, namely the HERS (Austin 2003; Haas 2004; Hersh 2004), WHI (Austin 2004A; Barbaglia 2009; Haas 2004; Hersh 2004; Majumdar 2004,), ALLHAT (Austin 2004B; Kabir 2007; Stafford 2004), Prove‐IT (Austin 2005; Fonarow 2009), RALES (Juurlink 2004; Majumdar 2003), and EHC‐OM (Black 2002; Mason 2001) trials reports (Appendix 2: PEM descriptions).
Among the studies that evaluated more than one PEM, some did not provide the data required to analyse the effectiveness of each of the PEMs separately, so we considered the effectiveness of the combined PEMs as they were a single intervention (Austin 2005; Hersh 2004; Wang 2005). Lastly, several ITS studies evaluated the impact of multiple distinct PEMs that were delivered successively over time, by looking at the trends before and after each of the delivered PEMs (Barber 2017; Fonarow 2009; Haas 2004; Kabir 2007; Komen 2017; Lee 2018A; Majumdar 2003; Marincowitz 2018; Markovitz 2017; Roifman 2017; Salzler 2017; Stocks 2017). We were able to consider these evaluations as separate studies as we had the required data to do so.
The PEMs evaluated using ITS designs were different from those evaluated with randomised trial designs. These PEMs were more homogenous regarding their source, endorsement, and format, as they were generally reports of a randomised trial published in a peer review journal. They also often targeted prescribing. PEMs tested by means of randomised trial designs were more diverse. In the following section, we describe the characteristics of these 113 PEMs.
PEM characteristics (potential effect modifiers)
Source
Various sources produced the studied PEMs. Thirty‐four were produced by researchers or clinicians, and 39 were produced by national professional expert bodies, such as the Women's Health Initiative, the College des médecins du Quebec, the Society for Obstetrics and Gynecology, or the Royal College of Radiologists (Figure 2). Fourteen PEMs came from local expert bodies (Bjornson 1990; Buyle 2010; Chandy 2014; Evans 1986; Komen 2017; Lee 2018A; Li 2017; Meyer 2007; Perria 2007; Steffensen 1997; Watson 2001; Weiss 2011), 13 from national government expert bodies (Barber 2017; Denig 1990; Dubey 2006; Marincowitz 2018; Naimer 2017; Nicholas 2009; Stocks 2017; Tziraki 2000; Weaver 2016), four from universities (Avorn 1983; Dormuth 2004; Lee 2018B), and one from local clinicians (Coopersmith 2002). Source was unclear/not documented for seven PEMs. Three PEMs had both researchers/clinicians and local expert body sources at the same time (Azocar 2003; Meyer 2007; Perria 2007).
2.
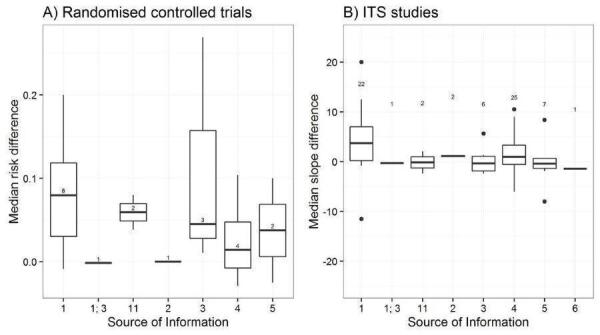
Potential effect modifier ‐ source of information. Legend: 1 = researchers/clinicians; 2 = university; 3 local expert body; 4 = national professional expert body; 5 = national government expert body; 6 = local clinicians; 7 = international expert body; 8 = international government expert body; 9 = unclear. The box plots display median effect sizes, interquartile ranges (IQR), 1.5 the IQR (whiskers), and outliers (data point).
Of the 113 studied PEMs, 84 were endorsed, for example, by a college of physicians, corporate source, or other key stakeholder (Figure 3). In 22 cases, we were unable to assess whether or nor the PEMs presented were endorsed. Four PEMs were not endorsed (Guadagnoli 2004; Mohammadi 2015; Tsuji 2009; Watson 2001). A large proportion of the endorsed PEMs (50/84) were peer‐reviewed journal publications.
3.
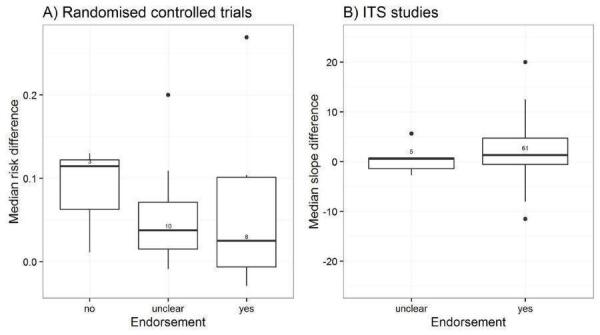
Potential effect modifier ‐ endorsement (yes, no, unclear). The box plots display median effect sizes, interquartile ranges (IQR), 1.5 the IQR (whiskers), and outliers (data point).
Six PEMs were tailored to the individual professionals and four were tailored to groups of professionals (Figure 4). Three PEMs were personalised, that is, the recipient's name appeared on the printed information, and they were evaluated in three studies (Beaulieu 2004; Denig 1990; Dormuth 2004). However, most were generic, without any tailoring (98/113).
4.
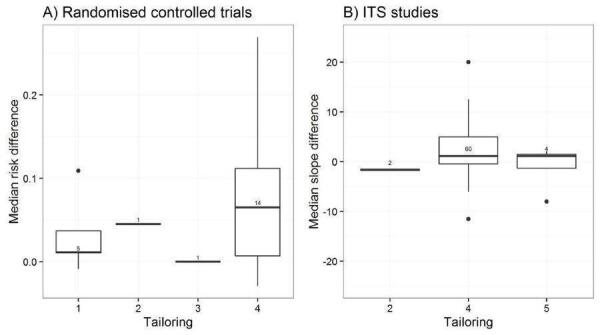
Potential effect modifier ‐ tailoring. Legend: 1 = tailored to individuals based on diagnostic, behavioural, or motivational characteristics; 2 = tailored to groups of individuals; 3 = personalised, but not tailored (person's name on the information); 4 = generic; 5 = unclear. The box plots display median effect sizes, interquartile ranges (IQR), 1.5 the IQR (whiskers), and outliers (data point).
The source quality level was clear for 101 PEMs: 54 were clinical practice guidelines developed through a formal consensus process, 25 original randomised trials, four were original studies that were not randomised (Marincowitz 2018; Ouldali 2017; Rigobon 2019; Salzler 2017) (Figure 5), four were syntheses other than systematic reviews (Stocks 2017), 12 were summaries (Black 2002; Mason 1998/99; Mason 2001; Naimer 2017; Roifman 2017; Sakai 2017; Zwarenstein 2014; Zwarenstein 2016), and one was a systematic review of randomised trials (Shah 2008). Five PEMs were based on expert opinion (Marincowitz 2018; Markovitz 2017; Weiss 2011).
5.
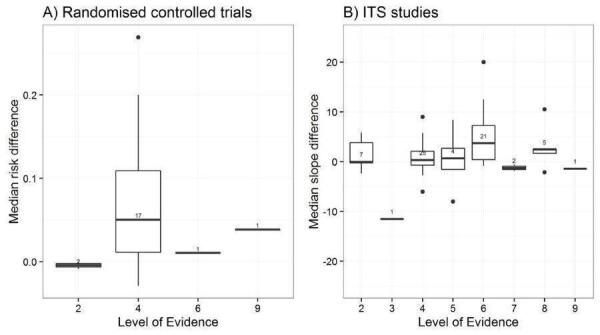
Potential effect modifier ‐ Source quality level. Legend: 1 = system (computerised decision support); 2 = summaries (evidence‐based textbook); 3 = systematic review of randomised trials; 4 = clinical practice guidelines developed through formal consensus process; 5 = other synthesis; 6 = original randomised trial; 7 = original studies not randomised trial; 8 = expert opinion; 9 = unclear. The box plots display median effect sizes, interquartile ranges (IQR), 1.5 the IQR (whiskers), and outliers (data point).
Channel
Thirty‐five out of 113 PEMs were disseminated passively (Figure 6) . For the previous version of this review, the frequency and duration of exposure of professionals to these documents were generally indeterminate except for the bulletin (Mason 2001) that was delivered once, but it was documented for the 16 passively disseminated studies of this new version.
6.
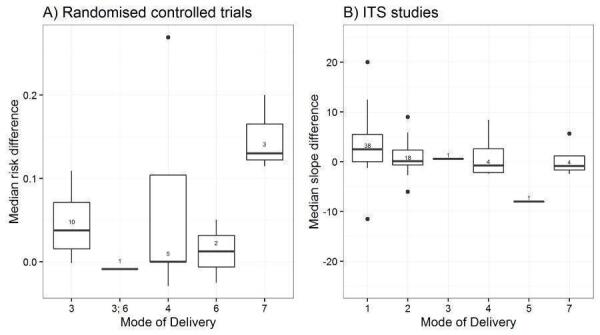
Potential effect modifier ‐ Mode of delivery. Legend: 1 = publication in peer‐reviewed journal; 2 = passive dissemination; 3 = direct mailing; 4 = mass mailing; 5 = media; 6 = hand delivery; 7 = unclear. The box plots display median effect sizes, interquartile ranges (IQR), 1.5 the IQR (whiskers), and outliers (data point).
Twenty PEMs were disseminated actively through direct mailing, 15 of which were delivered only once (Figure 7). Eleven PEMs were disseminated through mass mailing, with variable frequencies and durations of delivery: seven were delivered once, two were delivered twice, and the other consisted of a series of evidence‐based bulletins mailed out regularly over a three‐year period (Figure 8). Five PEMs were disseminated through hand delivery (Dubey 2006; Fukuda 2018; Izcovich 2011; Rahme 2005; Weaver 2016). None of the studies reported that PEMs had been delivered electronically, however those that were disseminated passively probably used electronic dissemination channels, such as the journal's website, in the case of the articles published in scientific journals.
7.
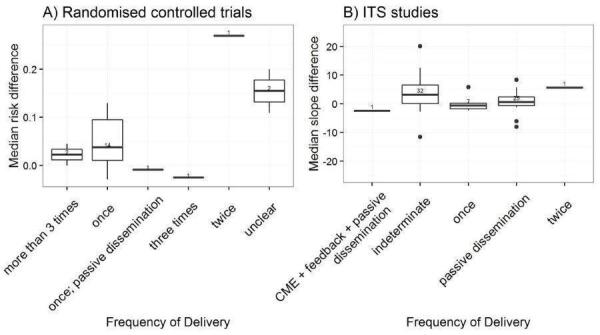
Potential effect modifier ‐ frequency of delivery (once, twice, 3 times, more than 3 times, indeterminate). The box plots display median effect sizes, interquartile ranges (IQR), 1.5 the IQR (whiskers), and outliers (data point).
8.
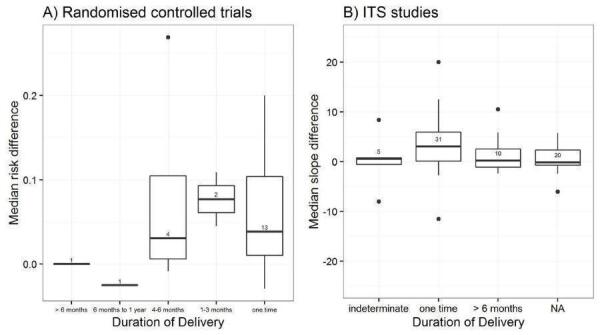
Potential effect modifier ‐ duration of delivery (once, 1‐3 months, 4‐6 months, over 6 months, indeterminate). The box plots display median effect sizes, interquartile ranges (IQR), 1.5 the IQR (whiskers), and outliers (data point).
Message
The PEMs covered a broad range of clinical areas, including cardiovascular diseases (37 PEMs), infectious and inflammatory diseases (16), oestrogen replacement therapy for menopausal women (10 PEMs), mental health (10 PEMs), and diabetes (seven PEMs) (Figure 9). Other topics covered were paediatric medicine (six PEMs) and pain management (four PEMs).
9.
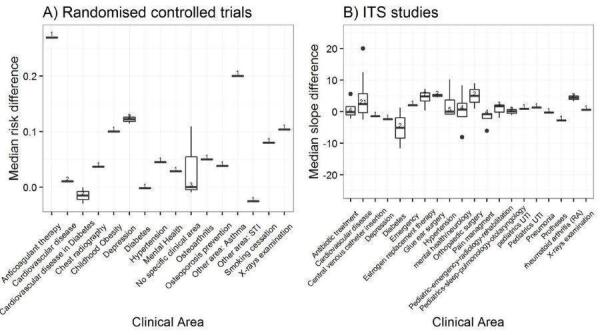
Potential effect modifier ‐ clinical area. Legend: ERT = Oestrogen‐replacement therapy. The box plots display median effect sizes, interquartile ranges (IQR), 1.5 the IQR (whiskers), and outliers (data point).
Most PEMs (77/113) targeted a single type of clinical behaviour, while 36 addressed two or more behaviours (Figure 10). Eighty PEMs targeted providers' prescribing or treatment behaviour, 39 targeted the general management of a problem, and 27 addressed procedures. There were 20 PEMs for test ordering, 10 directed at surgery, 15 targeted at patient education/advice, 17 on diagnoses, ten regarding referrals, and seven covered screening. Thirteen PEMs targeted clinical prevention services, and three targeted discharge planning. One PEM targeted reporting (Rigobon 2019) and four targeted professional‐patient communication (Marincowitz 2018; Rigobon 2019). For two PEMs, the target was financial/resources use (Avorn 1983; Buyle 2010). The target was unclear for two PEMs as well (Jousimaa 2002; Steffensen 1997).
10.
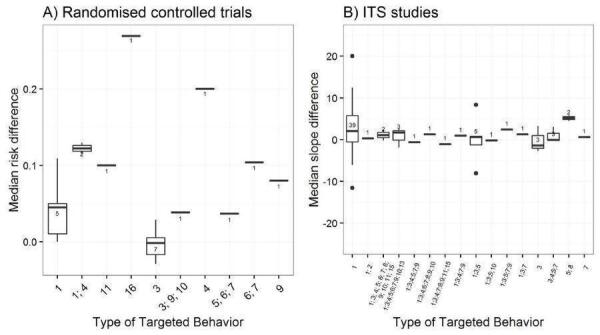
Potential effect modifier ‐ type of targeted behaviour. Legend: 1 = prescribing/treatment; 2 = financial (resource use); 3 = general management of a problem; 4 = diagnosis; 5 = procedures; 6 = referrals; 7 = test ordering; 8 = surgery; 9 = patient education/advice; 10 = clinical prevention service; 11 = screening; 12 = reporting; 13 = professional‐patient communication; 14 = record keeping; 15 = discharge planning; 16 = unclear. The box plots display median effect sizes, interquartile ranges (IQR), 1.5 the IQR (whiskers), and outliers (data point).
Most PEMs (107/113) were intended to modify an already established management, either to increase it (22 PEMs), to decrease it (25 PEMs), to cease it (1) or to increase management in one activity and reduce it in another (59 PEMs) (Figure 11). A single PEM was intended to cease an established practice, and it was studied in a single study (Shah 2008). Two PEMs intended to initiate a new management (e.g. introduction of new technology) (Komen 2017; Marincowitz 2018). The intent of four PEMs was unclear for three studies (Marincowitz 2018; Markovitz 2017; Stocks 2017).
11.
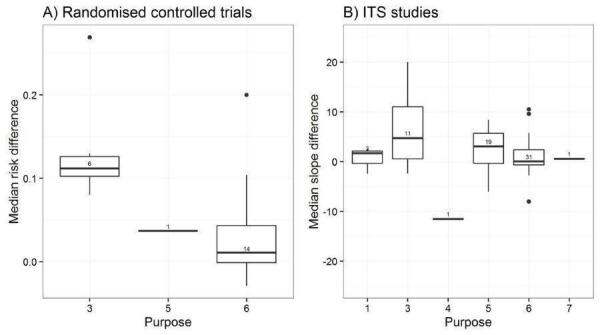
Potential effect modifier ‐ purpose. Legend: 1 = initiation of management (e.g. introduction of new technology); 2 = stopping introduction of new management; 3 = increase of established management; 4 = cessation of established management; 5 = reduction of established management; 6 = modification of management (e.g. increased management in one activity, reduction in another). The box plots display median effect sizes, interquartile ranges (IQR), 1.5 the IQR (whiskers), and outliers (data point).
Twenty‐one PEMs specified that they were intended for educational purposes, the others (92) were unclear in this respect (Figure 12).
12.
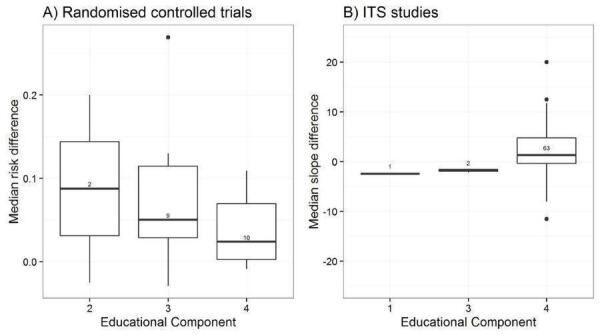
Potential effect modifier ‐ educational component. Legend: 1 = continuing professional development (CPD) credits to recipients of PEMs; 2 = PEM delivered within a formal education programme; 3 = clear statement in the study that the PEM is intended for education; 4 = no clear educational component. The box plots display median effect sizes, interquartile ranges (IQR), 1.5 the IQR (whiskers), and outliers (data point).
Format
The PEMs identified were published in different formats (Figure 13; Figure 14).
13.
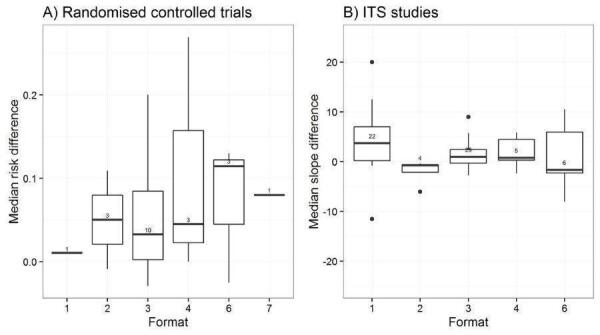
Potential effect modifier ‐ format. Legend: 1 = publication of randomised trial results in peer‐reviewed journal; 2 = quick reference of clinical guidelines; 3 = full clinical guidelines; 4 = newsletter or bulletin; 5 = manual of peer‐reviewed clinical article reprints; 6 = other; 7 = unclear. The box plots display median effect sizes, interquartile ranges (IQR), 1.5 the IQR (whiskers), and outliers (data point).
14.
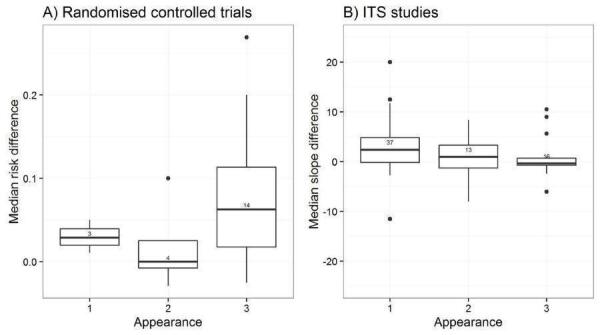
Potential effect modifier ‐ appearance. Legend: 1 = black and white, with a few figures or tables; 2 = graphically enhanced communication format (colour, picture, or figure); 3 = unclear. The box plots display median effect sizes, interquartile ranges (IQR), 1.5 the IQR (whiskers), and outliers (data point).
Twenty‐seven PEMs consisted of results of trials published in peer‐reviewed journals, and were thus printed in black and white with figures or tables.
Forty‐seven PEMs consisted of full sets of evidence‐based guidelines, and their appearance was specified for 27 PEMs): 14 published in black and white and the other 13 used colour, pictures or figures to enhance their content.
Eleven PEMs were newsletters or bulletins: five were published in black and white, and three were graphically enhanced. The three that were graphically enhanced consisted of several issues of evidence‐based bulletins and they were evaluated in three studies (Dormuth 2004; Zwarenstein 2014; Zwarenstein 2016).
Twelve PEMs, including four from a single study (Barber 2017), were quick reference to guidelines, and their appearance was not specified, except for two PEMs (Dubey 2006; Rahme 2005). The format of publication and the appearance were not specified in three PEMs from two studies (Marincowitz 2018; Stocks 2017).
Excluded studies
Among the 564 excluded studies, 381 studies were excluded due to ineligible study design, 28 studies due to ineligible study participants, 144 studies were excluded due to non‐PEM intervention, and 17 studies due to inappropriate outcomes.
Reasons for exclusion of 25 studies are found in the excluded studies table (Excluded studies). Five studies were excluded due to ineligible study design (Kulkarni 1998; Martino 2011; Mollon 2009; Morse 2009; Ozgun 2010). Five studies were excluded for not having objective outcomes (Evans 2010; Hunskaar 1996; Jackevicius 1999; Mockiene 2011; Richardson 2002). Two studies were excluded for not having PEM as an intervention (Fontaine 2006; Perez‐Jauregui 2008). One study was excluded due to the intervention being aimed at patients rather than healthcare professionals (Janmeja 2009). One study was excluded because it focused on evaluating the validity of the guideline rather than its effectiveness in changing professional practice (Kocher 2003). Twelve studies were excluded for not reporting data from comparison groups (Croudace 2003; Emslie 1993; Engers 2005; Ferrari 2005; Hazard 1997; Jain 2006; Maiman 1988; Majumdar 2008; Mettes 2010; Schwartz 2007; Simon 2007). Six of these studies included multi‐faceted comparisons and it was difficult to determine the effectiveness of PEMs (Croudace 2003; Engers 2005; Hazard 1997; Jain 2006; Mettes 2010).
Risk of bias in included studies
A single randomised trial scored low on all of the risk of bias criteria (Watson 2001). Among the 32 randomised trials and two CBAs included in this review, we found the random sequence generation to be appropriate in 21 studies, and the concealment of allocation to be appropriate in 15 studies (Figure 15). Protection against baseline imbalance was appropriate for participants' characteristics in 25 studies and for outcomes in 14 studies. All studies, except for seven, reported appropriate means to blind outcome assessment. We judged that there was a low risk of attrition bias in 12 studies. A potential unit of analysis error was identified in two cluster‐randomised trials in which the analyses did not account for clustering (Bearcroft 1994, Fukuda 2018). Clarity of reporting regarding the risk of bias variables was frequently inadequate.
15.
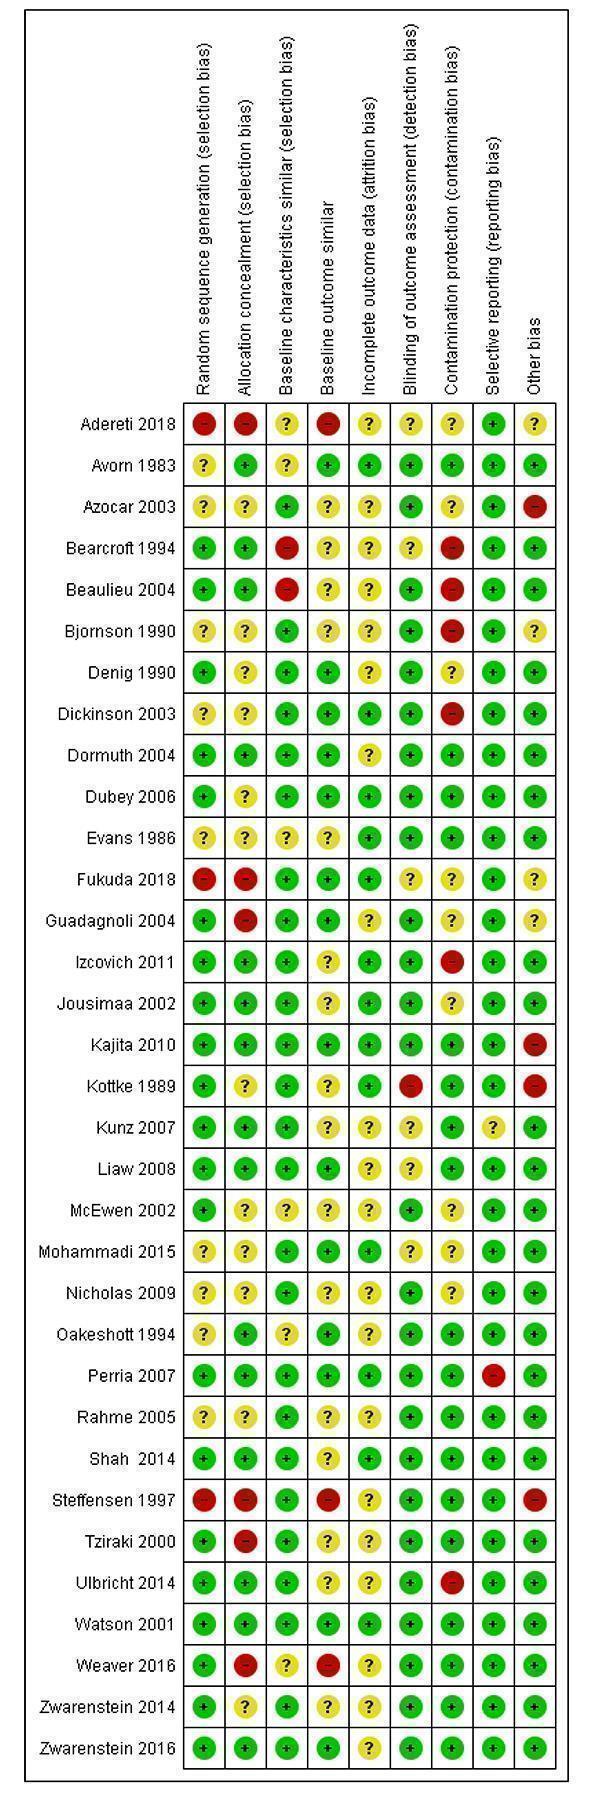
Risk of bias summary: review authors' judgements about each risk of bias item for each included RT and CBA study
Fifty of the included studies were ITS designs. For most of the risk of bias variables evaluated for these studies, we judged the risks to be low (Figure 16). For 13 ITS studies, we judged that there were high risks that the intervention effects were affected by other changes happening at the same time as the intervention. This risk was low in seven studies, and clarity of reporting was inadequate to allow assessing this risk in 30 out of the 50 ITS studies. The direction of the intervention effect was only specified in 20 studies, and was not prespecified or unclear for 30 of the included ITS studies. For 20 of the included ITS, we lacked information to assess measurement biases. Two ITS studies scored all risk of bias items as low risk (Black 2002; Majumdar 2003).
16.
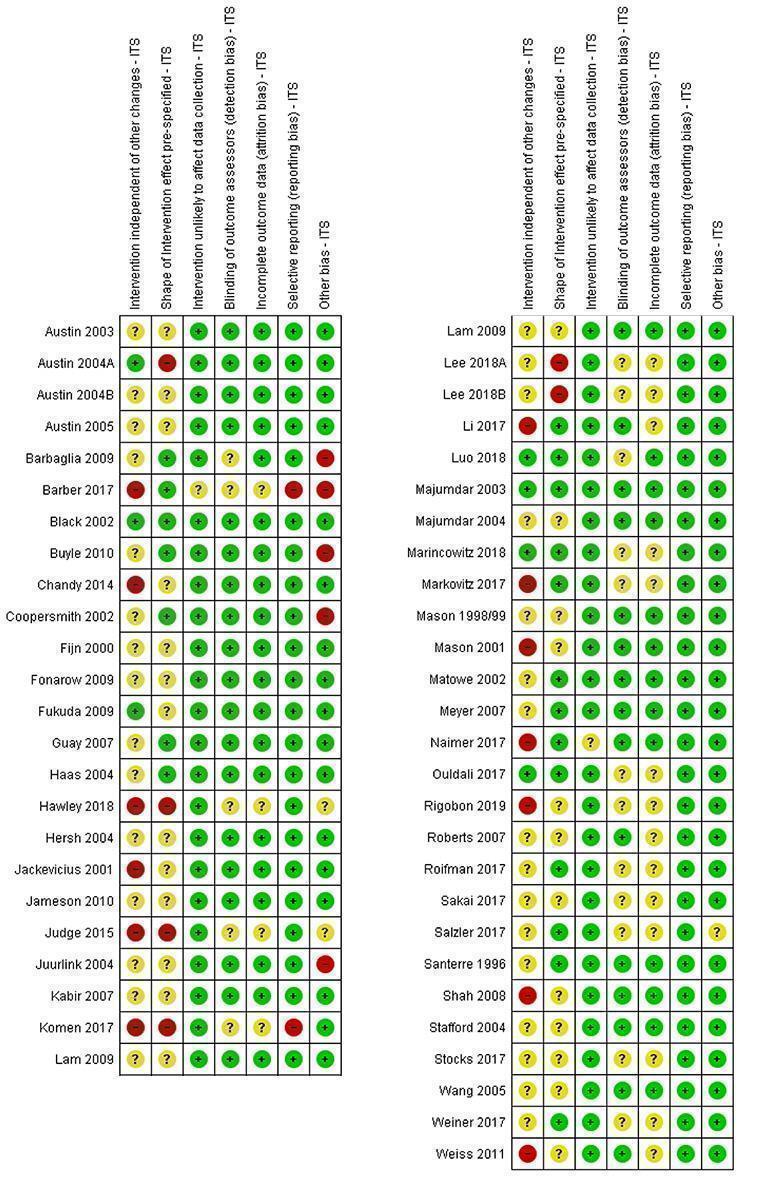
Risk of bias summary: review authors' judgements about each risk of bias item for each included ITS study.
Effects of interventions
Summary of findings 1. Printed educational material vs. no intervention.
| Printed educational material vs. no intervention | ||||||
| Patient or population: healthcare professionals (physicians and allied health professionals) Settings: multiple settings (general practice/family medicine, outpatient, inpatient) Intervention: printed educational material (generally about prescribing treatment, diagnosing diseases or testing ordering) Comparison: no intervention | ||||||
| Outcomes* | Design | Standard median effect size | Magnitude of effect | No of participants (studies) | Certainty of evidence (GRADE) | Results in words |
| Healthcare professionals' practice outcome measured using dichotomous variables Absolute risk difference across various outcomes Mean follow‐up: 9 months | Randomised trials | 0.04 higher (interquartile range from +0.01 to +0.09) | Large (estimated Cohen's d: 0.79) | Over 3963 healthcare professionals randomised by 3073 units (professionals, practices, health centres, areas, towns) (16 studies, 16 PEMs) | ⊕⊕⊕⊝ Moderate1 | PEMs distributed to healthcare professionals probably improves their practice |
| Healthcare professionals' practice outcome measured using continuous variables Standardised mean difference across various outcomes Mean follow‐up: 13 months | Randomised trials | 0.11 higher (interquartile range from ‐0.16 to +0.52) | Small (estimated Cohen's d: 0.31) | 1631 healthcare professionals randomised by 1373 units (professionals, practices) (7 studies, 7 PEMs) | ⊕⊝⊝⊝ Verylow1, 2, 3 | |
|
Healthcare professionals' practice outcome measured using continuous variables Follow‐up: 9 months |
CBA | Not available | Not available | Not available (1 study, 1 PEM) |
⊕⊕⊝⊝ Very low2,3,4 |
|
|
Healthcare professionals' practice outcome Standardised median change in slope across various outcomes Mean follow‐up: 5.6 years |
ITS | 0.69 change in slope (interquartile range from ‐0.60 to 5.63) | Moderate (estimated Cohen's d: 0.41) | Not available (35 studies, 54 PEMs) |
⊕⊝⊝⊝ Verylow1, 2, 5 |
|
|
Patient health outcome measured using dichotomous variables Absolute risk difference across various outcomes Mean follow‐up: 8 months |
Randomised trials | 0.02 higher (interquartile range from ‐0.005 to +0.09) | Moderate (estimated Cohen's d: 0.47) | 935,015 patients randomised by 959 units (patients, physicians, practices) (4 studies, 4 PEMs) |
⊕⊕⊕⊝ Moderate2, 3 |
PEMs distributed to healthcare professionals probably make little or no difference to patient health |
|
Patient health outcome measured using continuous variables Standardised mean difference across various outcomes Mean follow‐up: 14 months |
Randomised trials | 0.05 higher (interquartile range from ‐0.12 to +0.09) | Very small (estimated Cohen's d: 0.04) | Over 6737 patients randomised by 594 units (patients, healthcare professionals, aged care facilities) (4 studies, 4 PEMs) |
⊕⊝⊝⊝ Verylow1, 2, 3 | |
|
Patient health outcome Standardised median change in slope across various outcomes Mean follow‐up: 6.8 years |
ITS | 1.12 change in slope (interquartile range from ‐0.65 to 2.13) | Moderate (estimated Cohen's d: 0.42) | Not available (8 studies, 12 PEMs) |
⊕⊝⊝⊝ Verylow1, 2, 5 |
|
| * Where studies reported more than one measure of each endpoint, the primary measure (as defined by the authors of the study) or the median measure was abstracted. For dichotomous measures, we calculated the odds ratio between the intervention of interest and the control intervention. For continuous measures, we calculated standardised mean difference by dividing the mean score difference of the intervention and comparison groups in each study by the pooled estimate standard deviation for the two groups. | ||||||
| GRADE Working Group grades of evidence High quality: Further research is very unlikely to change our confidence in the estimate of effect. Moderate quality: Further research is likely to have an important impact on our confidence in the estimate of effect and may change the estimate. Low quality: Further research is very likely to have an important impact on our confidence in the estimate of effect and is likely to change the estimate. Very low quality: We are very uncertain about the estimate. | ||||||
1 We have downgraded due to inconsistency, as some studies measured a deterioration in outcomes whereas others showed improvements.
2 We have downgraded due to imprecision of the observed effect, as the analyses used did not allow computing confidence intervals to support an evaluation of the precision of the estimate. Moreover, the number of included studies was modest, and the recommendation would differ if upper versus the lower boundaries of the interquartile range represented the truth.
3 We have downgraded due to unclear or inadequate allocation concealment.
4 We have downgraded due to inconsistency, as with a single study, this criterion could not be evaluated. This item was downgraded to be conservative.
5 We have downgraded due to risks of bias, as these studies did not use a control group, were conducted retrospectively, and often without prespecifying the expected effect of the intervention.
Comparison 1: PEM only versus no intervention
Healthcare professionals' practice outcomes
Healthcare professionals' practice outcomes measured with dichotomous variables were evaluated within 20 RTs that compared PEM to no intervention (Table 1). Data from 16 of these studies (over 3963 healthcare professionals randomised by 3073 units, 102 outcomes) were available for re‐analysis. The median ARD across all outcomes from these studies was 0.04 (IQR from 0.01 to 0.09) (Table 3), indicating an improvement in healthcare professionals' practice in groups that received PEMs compared to groups that received no intervention (large magnitude of effect; Cohen's d: 0.79). Four studies could not be included in this analysis because of incomplete data sets. Among these, one report concluded that the PEM intervention led to improved outcomes (Beaulieu 2004), one concluded that it was difficult to draw any conclusions (Bjornson 1990), and two concluded that the studied PEMs had no impact (Zwarenstein 2014; Zwarenstein 2016). Based on this evidence, we conclude that printed educational material distributed to healthcare professionals probably improve healthcare professionals' practice, as measured with dichotomous variables, compared to no intervention.
These findings could not be confirmed by the very low‐certainty evidence obtained from the continuous variables extracted from 11 randomised trials that compared PEM to no intervention. We had the complete data to calculate effect sizes for seven of these studies (1631 healthcare professionals randomised by 1373 units; 25 outcomes), from which we calculated a 0.11 (IQR: ‐0.16 to 0.52) improvement in healthcare professionals' practice between healthcare professionals exposed to PEMS relative to healthcare professionals unexposed to them (small magnitude of effect; Cohen's d: 0.31) (Table 4). For the four other randomised trials, the dataset was incomplete and we were unable to re‐analyse the results. Study authors reported improvements in some outcomes after exposure of participants to the PEM in three instances (Avorn 1983; Nicholas 2009; Tziraki 2000) and no effect in the other (Azocar 2003).
These findings could also not be confirmed by the very low‐certainty evidence extracted from the included ITS studies. Of the 50 included ITS studies, 43 provided dichotomous variables. We were able to extract and re‐analysed 87 healthcare professionals' practice outcomes from 35 of these ITS studies, which allowed us to calculate an overall improvement in healthcare professionals' practice outcomes across studies after the introduction of the PEM, with a standardised median change in slope of 0.69 (IQR: ‐0.60 to 5.63; moderate magnitude of effect; Cohen's d: 0.41) (Table 1). This increase is a standardised value without weighing and has no units. Eight of the 43 ITS studies could not be included in these analyses because of incomplete datasets. Of importance, some of the included reports comprised ITS studies for several PEMs that were implemented sequentially (Austin 2003; Austin 2004B; Austin 2005; Barber 2017; Fonarow 2009; Haas 2004; Judge 2015; Kabir 2007; Komen 2017; Majumdar 2003; Majumdar 2004; Markovitz 2017; Mason 1998/99; Roberts 2007; Roifman 2017; Stocks 2017) and we considered each as a distinct study.The data needed for re‐analysis was missing for eight ITS studies (Fijn 2000; Fukuda 2009; Hersh 2004; Naimer 2017; Rigobon 2019; Salzler 2017; Santerre 1996; Wang 2005).
These findings could also not be confirmed by the very low‐certainty evidence extracted from the CBA (Steffensen 1997), as we could not calculate a standardised mean difference from these data, because mean values were collected overall for each experimental group without any detail on impacts at the individual healthcare professionals' level. In the end, this study presented overall results for the two studied counties, without replicating the experiment in additional counties, or providing an account of the sales from prescriptions for individual healthcare professionals (Table 5).
Overall, based on this evidence, we conclude that printed educational materials distributed to healthcare professionals probably improve healthcare professionals' practice compared to no intervention.
Patient health outcomes
Patient health outcomes measured with dichotomous variables were evaluated in four randomised trials, in seven outcomes (935,015 patients randomised by 959 units). Our re‐analysis gave an overall ARD of 0.02 (IQR from ‐0.005 to 0.09) across these seven outcomes (Table 7), indicating that PEMs distributed to healthcare professionals probably make little or no difference to patient health as measured using dichotomous variables, compared to no intervention (moderate magnitude of effect; Cohen's d: 0.47). These findings could not be strengthened by the very low‐certainty evidence obtained from the continuous variables extracted from four randomised trials comparing a PEM to no intervention. We had the complete data to calculate effect sizes for three of these studies (over 6737 patients randomised by 594 units; 13 outcomes), and calculated a 0.05 improvement in the SME for these outcomes (interquartile range from ‐0.12 to 0.09; very small magnitude of effect; Cohen's d: 0.04) (Table 8). These findings could not be strengthened by the 17 patient health outcomes extracted from eight of the 50 included ITS studies, because the certainty of this evidence was very low (standard median change in slope: 1.12; IQR: ‐0.65 to 2.13; moderate magnitude of effect; Cohen's d: 0.42) (Table 1). The data needed for re‐analysis was missing for one ITS study (Li 2017).
Overall, based on this evidence, we conclude that PEMs distributed to healthcare professionals probably make little or no difference to patient health compared to no intervention.
Comparison 2: PEM only versus single intervention
Two studies (a randomised trial and a CBA) compared a paper‐based version to a computerised version of the same PEM. From the randomised trial that provided evidence of low certainty (Jousimaa 2002), we found that PEM in computerised versions may make little or no difference to professionals' practice compared to PEM in printed versions (ARD: ‐‐0.02; IQR: ‐0.03 to 0.00; 139 healthcare professionals randomised individually; 9 outcomes) (Table 10). This finding could not be confirmed by the CBA study (Adereti 2018) that provided very low‐certainty evidence (SMD: 0.44; 32 healthcare professionals; 1 outcome) (Table 11). Overall, based on this evidence, we conclude that printed education material in computerised version may make little or no difference to professionals' practice compared to PEM in printed versions (Table 2).
9. Comparison 2, CBA, healthcare professionals' practice outcome measured with continuous variables.
| Study | Outcome | Printed version | Computerized version | Standard effect size | Weighted mean median effect size⭐ | ||||
| N | Pre‐mean (SD) | Post‐mean (SD) | N | Pre‐mean (SD) | Post‐mean (SD) | ||||
| Adereti 2018 | Quality of nurses' documentation | 16 | 34.5 (14.9) | 42.6 (26.1) | 16 | 25.2 (14.9) | 52.9 (20.0) | 0.44 | Not applicable |
⭐P value < 0.0001:***, < 0.001: **, ≤ 0.05: *, > 0.05: NS.
⭐The standard effect size was of 0.44.
Comparison 3: Multifaceted intervention where PEM is included versus multifaceted intervention without PEM
None of the included studies addressed this comparison.
Effect modifiers
We prepared box plots to explore whether various PEM characteristics might influence their effectiveness in changing professional practice (Figure 2; Figure 3; Figure 4; Figure 5; Figure 6; Figure 7; Figure 8; Figure 9; Figure 10; Figure 11; Figure 12; Figure 13; Figure 14). Visual inspection of these graphs suggests that some characteristics may have more potential to influence effectiveness, however, there are not enough data yet for some of the characteristics to see any trend.
For example, we observed that effectiveness varied more among the following characteristics: format (Figure 13), source quality level (Figure 5), tailoring (Figure 4), duration of delivery (Figure 8), clinical areas (Figure 9), type of targeted behaviour (Figure 10), purpose (Figure 11) source of information (Figure 2) and education component (Figure 12).
Visual inspection of the bar graphs also suggested that the effectiveness of PEMs does not vary much with regards to frequency (Figure 7), mode of delivery (Figure 6) or endorsement (Figure 3).
Some potential effect modifiers did not vary across the studied PEMs, preventing any conclusion on their potential impact. For instance, most of the PEMs were not tailored (Figure 4), were delivered once or with indeterminate frequency of delivery (Figure 7), and they were generally all black and white with a few figures and tables (appearance, Figure 14).This lack of variability prevents any conclusion on the importance of these characteristics in determining the effectiveness of PEMs.
Discussion
Summary of main results
Printed educational material distributed to healthcare professionals probably improve healthcare professionals' practice, as measured with dichotomous variables from randomised trials (ARD: 0.04; IQR: 0.01 to 0.09; 16 studies; 102 outcomes), compared to no intervention (Table 1). More studies are however needed to confirm these effects sizes, as the certainly of the available evidence is moderate. These findings could not be confirmed by the very low certainty of evidence gathered from continuous variables (SMD: 0.11; interquartile range: ‐0.16 to 0.52; 7 studies; 25 outcomes), from the ITS studies (0.69 change in slope; IQR: ‐0.6 to 5.63) or from the single CBA (1 study, 1 outcome). Data collected from ITS studies represent a larger dataset that is prone to important risks of bias, especially since the studies were conducted retrospectively, often without prespecifying the expected effect of the intervention. We found that results from the ITS studies were consistently positive across studies, which could be ascribed to the design itself, or to the fact that the PEMs evaluated in the ITS studies were different and more effective in improving practice than the PEMs studied in the randomised trials. Frequently, those PEMS were scientific peer‐reviewed publications in high impact journals, which are not amenable to randomised trial designs because they are passively disseminated at time of publication.
Printed educational material distributed to healthcare professionals probably make little or no difference to patient health compared to no intervention, as measured using dichotomous variables from randomised trials studies, (ARD: 0.02; IQR: ‐0.005 to 0.09; 4 studies; 7 outcomes) (Table 1). The evidence gathered from continuous variables (SMD: 0.05; IQR: ‐0.12 to 0.09; 4 studies; 13 outcomes) or from ITS study results (standardised median change in slope: 1.12; IQR: ‐0.65 to 2.13) do not strengthen these findings because the certainty of this evidence is very low. More studies are needed to confirm these effect sizes.
PEM in computerised versions may make little or no difference to professionals' practice compared to PEM in printed versions, as shown from a single randomised trial that provided evidence of low certainty (ARD: ‐0.02; IQR: ‐0.03 to 0.00; 1 study; 9 outcomes). This finding could not be strengthened by the CBA study that provided very low‐certainty evidence (SMD: 0.44; 1 study; 1 outcome) (Table 2).
To be consequent with the computation of median effect sizes to summarise study findings, we chose not to compute CIs but we presented IQRs instead. The IQRs describe the range in which half of all observed effect sizes appear; because of this reliance on observed data and not on theoretical assumptions, they are more susceptible to different sources of bias. Clinical significance of the observed effect sizes is unknown, but they fall in the range of effects of other quality improvement systematic reviews that reported absolute risk differences ranging from 0.04 to 0.09 for dichotomous professional outcomes and standardised mean differences ranging from 0.013 to 0.23 for continuous outcomes (Lau 2015). Clinical significance of the observed 0.11 improvement in continuous outcomes that we observed in the current review may be easier to judge if, for instance, we consider the results of Denig 1990: an 0.11 improvement corresponded in this case to a change from 27 defined daily doses (DDDs) of an undesirable antispasmodic per 1000 prescriptions before the PEM delivery to 26 DDDs/1000 prescriptions after the PEM delivery.
A few characteristics of the PEMs seem promising to increase their impact on professional practice. However, these findings are exploratory and should be interpreted with caution.
Overall completeness and applicability of evidence
Although PEMs were distributed to many types of healthcare professionals, participants in the included studies were generally physicians. Therefore, the findings of our review need to be confirmed for other types of professionals. The included studies were performed in developed countries (almost all in North America and Europe), primarily in outpatient practices and in some hospitals. The applicability of the observed results to other settings is unknown.
Compared to previous reviews of clinical practice guidelines (Grimshaw 2004), we have included more diverse types of PEMs, including full clinical guidelines, guideline summaries, publications in peer‐reviewed journals, bulletins, or newsletters. Therefore, our results can be generalised to a broader category of PEMs. More studies are needed to draw conclusions on many of the potential effect modifiers that we have decided to study. For instance, most PEMs were not explicit about their educational intent, so it is difficult from the set of included studies to evaluate whether an intervention developed specifically as educational would be more efficient.
Even though PEMs are often used as an add‐on to a single or multifaceted intervention, no evidence can be used to support this practice as we were not able to find any studies comparing the addition of a PEM to another intervention compared to the intervention alone. To improve the applicability of this review, we chose to exclude the many studies that compared multifaceted interventions including PEMs to a 'no intervention' control, as these comparisons do not allow isolation of the 'PEM effect' from the effect of the other interventions.
We did not restrict our review to specific outcomes or clinical areas, allowing for a greater number of included studies. Thus, were able to review and pool a relatively wide variety of professional practice outcomes. This breadth of outcomes also allows for generalisability to any clinical situation. However, a relatively small number of studies looked at patient health outcomes. Our inclusion criteria (any objective measure of professional practice or patient health outcomes) also led to the exclusion of many educational interventions that are typically evaluated with non‐clinical outcomes (e.g. knowledge, attitudes). The benefits of PEMs should be interpreted in the context of their costs and span of coverage. Unfortunately, no studies undertook a formal economic evaluation of the effects of the PEMs.
The change in slope estimates were evaluated with time series analyses, from a limited number of data points considering that this type of analysis would be best performed with a minimum of 50 to 100 data points (Chatfield 2001; Lagarde 2012). Thus, the pooling of changes in slope is also prone to substantial imprecision.
Certainty of evidence
The methodological quality of the 32 randomised trials and two CBAs was variable; the proportion of quality criteria met varied from one to eight out of nine. The items 'Random sequence generation' and 'Allocation concealment' were evaluated as having unclear or high risk of bias in 31% and 50% of randomised trials, respectively, resulting in risks of selection bias for these studies, and possibly leading to an overestimation of effects (Wood 2008). This is likely to be a consequence of the randomisation issues, as only 14 randomised trials reported comparable baseline outcomes.
As we included only objective outcomes, there was a low risk of bias in assessment in most studies (25 of RT studies), even if assessment was unblinded. The completeness of outcome data was unclear in many randomised trials (18 of 32 randomised trials), which is likely to be because of the inclusion of older trials published before the CONSORT statement, and these can often make study interpretation difficult (Higgins 2011). Most of the reviewed randomised trials were clustered to avoid contamination problems (19 of 32 randomised trials). However, the risk of contamination bias was uncertain in two cluster‐randomised trials, and two cluster‐randomised trials did not take into account clustering in the analysis potentially leading to a unit of analysis error.
Inclusion of ITS studies allows considerably more experimental studies to be reviewed, with the drawback and challenge of having to weigh up methodological quality in the review conclusions. As mentioned earlier, the included ITS studies were conducted retrospectively, often without prespecifying the expected effect of the intervention, or acknowledging the presence of a secular trend. It is still important to include these studies since finding an equivalent control group of practitioners who is not exposed can be challenging when recommendations are disseminated widely on a national level ‐ or when consensus recommendations are directed at the entire population of practitioners (Kanouse 1995). We avoided the problem of inappropriate analyses in reviewed ITS studies by re‐analysing all the results using times series regressions (Ramsay 2003).
Quality assessment items were not consistently described in all the included studies, suggesting that there remains room for improvement in the level of reporting on quality assessment criteria in publications.
Potential biases in the review process
Our approach focused on the observed effect sizes and did not consider statistical significance or weight by study size. However, it provides information on the effect size of the intervention, which is more informative than the vote counting approach. It is also possible that our review suffered from publication bias, so the reader should consider the possibility that we are overestimating the effectiveness of the intervention.
We were often limited by missing information from the primary studies. For instance, frequency of the PEM delivery was generally not reported in primary studies, and the messages and formats of the PEMs were not clearly and consistently described across the primary literature. To complete the missing information, we attempted to obtain a copy of the actual PEM tested within each study; despite our best efforts, we were not able to obtain copies of all the PEMs and some information remained missing.
Agreements and disagreements with other studies or reviews
The findings from this review converge with the last update of this Cochrane review that concluded that "when used alone and compared to no intervention, PEMs may have a small beneficial effect on professional practice outcomes when randomised trials and CBAs studies are considered. There is insufficient information to reliably estimate the effect of PEMs on patient health outcomes, and clinical significance of the observed effect sizes is not known." (Giguere 2012). The results are not yet stable and further research might be needed, especially on patient health outcomes. Before this review, Grimshaw and colleagues had conducted the most comprehensive systematic review on the effectiveness of guideline dissemination and implementation strategies (Grimshaw 2004). Their review results concur with the present work, as they found that PEMs have a moderate effect across health conditions.
Authors' conclusions
Implications for practice.
PEMs are a commonly used method of disseminating information to healthcare professionals. They can be distributed to large numbers of healthcare professionals and are relatively inexpensive. Studies of the effects of PEMs generally show modest, but potentially important, improvements in professional practice. Only a few studies have shown small deteriorations of uncertain clinical significance. Those interested in using PEMs should be aware of the potentially small effects and limitations of the current evidence. Further, there is preliminary evidence about how to optimise educational materials.
Implications for research.
Authors of future primary studies are encouraged to provide a detailed description of the PEM studied and to publish it with their report to allow further message and format analysis. This would allow for replication, comparison across studies, and more robust analyses of effect modifiers. Future studies should also consider evaluating head‐to‐head comparisons of PEMs with different characteristics.
More PEM versus control two‐arm studies are needed to obtain a more definite answer on the effectiveness of PEMs to improve patient health outcomes.
Studies should be sufficiently powered to detect smaller effects.
Quasi‐experimental designs such as ITS may increasingly be used for evaluating PEMs and other interventions for change in healthcare practice, given their low cost, convenience, and value for informing policy decisions. However, it is important that appropriate statistical methods be used to analyse time series data, preferably time series regression models.
In many studies, PEMs serve as a control group rather than an intervention of interest, or some studies used PEMs alongside other interventions for investigating additive effects of interventions. Future intervention studies examining the effect of PEMs should consider the impact of PEMs on their own.
Economic evaluations of PEMs are needed. Future studies should provide information about the resources required for development, dissemination, and implementation of PEMs (Grimshaw 2004).
We chose to describe some of PEMs' characteristics that may have affected their effectiveness, based on broader categories of the persuasive communication theory (source, channel, and message). However, each of these characteristics could only be evaluated in a limited number of included studies. This prevented any conclusion on the relative importance of these potential effect modifiers to improve professional practice, and calls for more research on the characteristics of PEMs that truly lead to a change in behaviour.
What's new
| Date | Event | Description |
|---|---|---|
| 8 July 2020 | New citation required and conclusions have changed | New citations. Conclusions of the review have changed and new meta‐analyses are presented. |
| 6 February 2019 | New search has been performed | Searches updated. Thirty‐nine new studies identified and included in the review. |
History
Protocol first published: Issue 3, 2003 Review first published: Issue 3, 2008
| Date | Event | Description |
|---|---|---|
| 6 March 2015 | Amended | Standard median effect size range corrected in the summary of findings table |
| 2 April 2013 | Amended | Edits to contact details |
| 10 September 2012 | New search has been performed | Review has been updated |
| 10 September 2012 | New citation required but conclusions have not changed | New authors, now has 45 studies. |
| 16 June 2011 | Amended | Minor edits |
| 18 February 2009 | Amended | Minor edits |
| 12 November 2008 | Amended | Minor changes |
| 23 April 2008 | Amended | Converted to new review format. |
Notes
This review replaces the review that was withdrawn by Freemantle and colleagues (Freemantle 1997) and is an update of the reviews by Farmer and colleagues (Farmer 2008) and Giguere and colleagues (Giguere 2012). The protocol was published by Farmer and colleagues in 2003 (Farmer 2003).
Acknowledgements
We would like to recognise the contribution of Dr. Frederic Wolfe, who passed away on July 23, 2017, to the 1997, 2008 and 2012 versions of this review.
We would like to acknowledge the contributions of many people who helped during the review process: Julia Worswick (JW) and Sharlini Yogasingam (SY) who conducted the search for new studies; Émilie Fortier‐Brochu (EFB), Audrey Michaud (AM), JW and SY who helped with study selection. Sébastien Tchoubi, Élisabeth Canitrot, Jasmine Sawadogo, Ella Diendéré, Serigne Abib Gaye, Codjo Giraud Ulrich Ekanmian, Mamane Abdoulaye Samri, Johanie Lépine, Michael Zahradnik, Albert Formanek (AF) and Patrice Alain Gerard Ngangue (PAGN) who helped with data extraction; AF and PAGN who contributed to 'Risk of bias' evaluations; Béatriz Valera (BV) who helped with the GRADE assessment; and Katherine Hastings for her writing assistance.
From the previous version, we would also like to acknowledge the help of Dr Robby Nieuwlaat for translation of articles. We would like to acknowledge the help from the librarians at the Centre Hospitalier Saint‐François d'Assise, Ms. Michelle Petitclerc and Mrs. Jacinte Biron. We would also like to acknowledge the authors from previous versions of the review: StephaneTurcotte, Michelle Fiander, Agnes Grudniewicz, Sun Makosso‐Kallyth, Anna P Farmer, Lisa Bero, Nick Freemantle, Andy Oxman, Lucile Turcot, Emma Harvey, and Jessie McGowan. We would like to thank the peer reviewers, and EPOC editors who provided input. Thank you to Dr. Craig Ramsay for helpful comments on the statistical analysis of the ITS studies.
A special thank you is extended to the primary study authors who responded to our requests for more information: Dr. Ariel Izcovich, Dr. Elham Rahme, Dr. Andy McEwen, Dr. Regina Kunz, Dr. Baiju Shah, Dr. Vinita Dubey, Dr. Marcia Weaver, Dr. Barry Graubard, Dr. Sabina Ulbricht, Dr. Chariklia Tziraki, Dr. Barbara A. Dennison, Dr. Francisca Azocar, Dr. Marie‐Dominic Beaulieu, Kim Gans, Dr. Rowland Hazard, Dr. John Holden, Dr. Eileen Kaner, Dr. Thomas Kottke, Dr. Karmeen Kulkarni, Dr. Sumit Majumdar, Dr. James Mason, Dr. Sujivia Ratnaike, Dr. Stephen Soumerai, Dr. Peter Austin, Dr. Francesc Macià, Dr. Franky Buyle, Dr. Gregg Fonarow, Dr Simon Jameson, Dr. Zubair Kabir, Dr Kathleen Bennett, Dr. Amit Garg, Dr. Sumit Majumdar, Dr. Elisabeth Meyer, Dr. Baiju Shah, and Dr. Karl Weiss.
We would like to acknowledge the methodology support that we received from the Health and Social Services Systems, Knowledge Translation and Implementation Component of the Quebec SPOR‐SUPPORT Unit and the editorial support of the Effective Practice and Organisation of Care Group (EPOC) editorial base at the University of Oxford which is funded by the National Institute for Health Research, via Cochrane Infrastructure funding to EPOC. The views and opinions expressed therein are those of the authors and do not necessarily reflect those of the Systematic Reviews Programme, NIHR, NHS or the Department of Health.
Appendices
Appendix 1. Search strategies
Medline (OVID)
Search date: 6 February 2019
No. Search terms Results
1 (guideline? and (impact or influence)).ti. (1,369)
2 (effect* and guideline?).ti. (1,538)
3 (impact and bulletin?).ti. (11)
4 (impact and publication?).ti. (233)
5 (impact and publication?).ti. (233)
6 (guideline and (notification or notify*)).ti. (6)
7 (publication and evidence).ti. (92)
8 (guideline? and disseminat*).ti. (226)
9 drug utilization/ and publication.ti,ab. (132)
10 education, dental, continuing/ or education, medical, continuing/ or education, nursing, continuing/ or education, pharmacy, continuing/ (50,521)
11 10 and patient education as topic/ (1,135)
12 *physician's practice patterns/ and *practice guidelines as topic/ (1,653)
13 *family practice/ and *practice guidelines as topic/ (528)
14 *primary health care/ and *practice guidelines as topic/ (613)
15 publication.ti. and physician's practice patterns/ (56)
16 (publication and (influenc* or impact or chang* or prescribing or physician? behavio?r?)).ti. (311)
17 publication.ti. and practice guidelines as topic/ (132)
18 or/1‐9,11‐17 (7,355)
19 print* education*.ti,ab. (193)
20 ((print or printed) adj2 intervention?).ti,ab. (152)
21 ((allied health* or counsel?or? or doctor? or nurse or nurses or physician? or physiotherapist? or therapist? or dentist? or pharmacist? or health* worker? or health* staff) adj2 (pamphlet? or booklet? or poster? or brochure? or written material? or printed or print)).ti,ab. (169)
22 paper‐based education*.ti,ab. (11)
23 (postal adj4 guideline?).ti,ab. (23)
24 (spiral bound or bound copy or bound copies).ti,ab. (21)
25 or/19‐24 [kw screen without filters] (558)
26 education, dental, continuing/ or education, medical, continuing/ or education, nursing, continuing/ or education, pharmacy, continuing/ (50,521)
27 (continuing adj (medical or nursing or pharma* or dental* or physician? or doctor? or surg*) adj2 education*).ti,ab. (5,813)
28 (continuing education* adj2 (medical or nursing or pharma* or dental* or physician? or doctor? or surg*)).ti,ab. (891)
29 cme.ti,ab. (5,907)
30 or/26‐29 [cme] (57,133)
31 education, professional/ or education, continuing/ or education, professional, retraining/ (12,361)
32 ((train* or educat*) adj2 (clinical competenc* or practitioner? or practice? or general practi* or family doctor?)).ti,ab. (16,722)
33 education department, hospital/ (213)
34 (continuing adj2 education*).ti,ab. (18,304)
35 (professional adj2 (development* or education* or retrain* or skill? enhanc* or (skill? adj2 improv*) or training or upgrade? or upgrading)).ti,ab. (16,239)
36 (professional adj2 (education* or training)).ti,ab. (8,187)
37 or/31‐36 [ce general/professional dev general] (58,903)
38 exp physicians/ or exp nurses/ or "internship and residency"/ or preceptorship/ or clinical competence/ (312,339)
39 (exp allied health personnel/ not animal technicians/) or (exp health occupations/ not exp veterinary medicine/) (1,622,103)
40 exp medical staff/ or exp nursing staff/ or pharmacists/ or laboratory personnel/ or exp dentists/ or exp dental staff/ (122,550)
41 exp health facility administrators/ (11,269)
42 (counsel?or? or dental aide or dental aides or dental hygienist? or dentist? or dietetic? or dietician? or doctor? or general practitioner? or health* professional? or hospitalist? or medical aide? or medical aides or medical technician? or nurse or nurses or nutritionist? or orthodontist? or pediatric* or paediatric* or pharmacist? or physician? or physiotherapist? or psychiatrist? or psychiatric? aide or psychiatric aides or psychologist? or practitioner? or rheumatologist? or surgeon? or therapist?).ti. (493,415)
43 (internship? or intern? or resident? or residency or residencies).ti. (43,921)
44 or/38‐43 [health professionals] (2,140,446)
45 ((print or printed or paper) adj2 (display? or document? or education* material? or format? or portfolio or material? or media or medium? or workshop? material?)).ti,ab. (4,971)
46 ((print or printed) adj5 (format or formats)).ti,ab. (239)
47 (printed adj4 (diagram? or text)).ti,ab. (175)
48 (paper adj5 format?).ti,ab. (645)
49 (book? or booklet? or brochure? or bulletin? or handout? or hand‐out? or "hard copy" or hardcopy or "hard copies" or hardcopies or monograph* or paper‐based or "paper copy" or "paper copies" or print‐based or pamphlet? or poster?).ti,ab. (55,003)
50 (written material? or written teaching or written learning).ti,ab. (1,075)
51 (mail* adj2 (information or guideline? or publication? or protocol? or practice guideline or therap* guideline? or prescrib* guideline or article or articles or research or result? or study or studies or journal? or copy or copies)).ti,ab. (1,026)
52 exp books/ or manuals as topic/ or reference books/ or textbooks as topic/ or broadsides as topic/ or pamphlets/ (26,882)
53 posters as topic/ (204)
54 or/45‐53 [print material kw & mesh] (84,215)
55 guideline adherence/ (29,356)
56 ((guideline? or best practice? or evidence or ebm) adj2 (adher* or apply* or application or disseminat* or implement* or introduc* or publication or release or uptake)).ti,ab. (23,530)
57 ((publication or published) adj2 (guideline? or protocol?)).ti,ab. (8,693)
58 or/55‐57 [gl adherence] (56,686)
59 guidelines as topic/ or practice guidelines as topic/ (145,228)
60 exp evidence‐based practice/ (82,993)
61 (evidence based adj2 (practice? or practitioner? or medicine or medical or treatment? or therap* or nurse or nurses or nursing or dentist* or healthcare or care)).ti,ab. (37,403)
62 (applied learning or knowledge transfer* or knowledge translation).ti,ab. (3,552)
63 or/60‐62 [ebm/kt] (105,979)
64 exp patient care management/ or comprehensive health care/ or critical pathways/ or "delivery of health care"/ or "delivery of health care, integrated"/ or health care reform/ or dentist's practice patterns/ or disease management/ or medication reconciliation/ or medication therapy management/ or nurse's practice patterns/ or patient care team/ or nursing, team/ or patient‐centered care/ or quality of health care/ (761,931)
65 randomized controlled trial.pt. (475,791)
66 controlled clinical trial.pt. (92,898)
67 multicenter study.pt. (245,065)
68 pragmatic clinical trial.pt. (962)
69 (randomis* or randomiz* or randomly).ti,ab. (811,825)
70 groups.ab. (1,878,790)
71 (trial or multicenter or multi center or multicentre or multi centre).ti. (229,477)
72 (intervention? or effect? or impact? or controlled or control group? or (before adj5 after) or (pre adj5 post) or ((pretest or pre test) and (posttest or post test)) or quasiexperiment* or quasi experiment* or pseudo experiment* or pseudoexperiment* or evaluat* or time series or time point? or repeated measur*).ti,ab. (8,818,739)
73 non‐randomized controlled trials as topic/ (453)
74 interrupted time series analysis/ (530)
75 controlled before‐after studies/ (374)
76 or/65‐75 (9,837,196)
77 exp animals/ (22,078,536)
78 humans/ (17,533,967)
79 77 not (77 and 78) (4,544,569)
80 review.pt. (2,477,794)
81 meta analysis.pt. (96,963)
82 news.pt. (193,378)
83 comment.pt. (752,349)
84 editorial.pt. (481,492)
85 cochrane database of systematic reviews.jn. (14,067)
86 comment on.cm. (752,291)
87 (systematic review or literature review).ti. (126,021)
88 or/79‐87 (8,140,857)
89 76 not 88 (6,904,971)
90 (30 or 58 or 59 or 63 or (64 and 44) or (37 and 44)) and 54 (6,816)
91 89 and 90 (2,822)
92 25 or 91 (3,315)
93 18 and 89 (3,626)
94 92 or 93 (6,848)
95 (2018* or 2019*).dt,dp,ed,ep,yr. (2,265,555)
96 94 and 95 (724)
Embase (OVID)
Search date: 6 February 2019
No. Search terms Results
1 print* education*.ti,ab. (240)
2 ((print or printed) adj2 intervention?).ti,ab. (167)
3 ((allied health* or counsel?or? or doctor? or nurse or nurses or physician? or physiotherapist? or therapist? or dentist? or pharmacist? or health* worker? or health* staff) adj2 (pamphlet? or booklet? or poster? or brochure? or written material? or printed or print)).ti,ab. (258)
4 paper‐based education*.ti,ab. (14)
5 (postal adj4 guideline?).ti,ab. (50)
6 or/1‐5 (716)
7 (continuing adj (medical or nursing or pharma* or dental* or physician? or doctor? or surg*) adj2 education*).ti,ab. (7,379)
8 (continuing education* adj2 (medical or nursing or pharma* or dental* or physician? or doctor? or surg*)).ti,ab. (963)
9 cme.ti,ab. (10,562)
10 or/7‐9 (16,886)
11 *vocational education/ (4,468)
12 continuing education/ (30,339)
13 ((train* or educat*) adj2 (clinical competenc* or practitioner? or practice? or general practi* or family doctor?)).ti,ab. (20,527)
14 (continuing adj2 education*).ti,ab. (21,846)
15 (professional adj2 (development* or education* or retrain* or skill? enhanc* or (skill? adj2 improv*) or training or upgrade? or upgrading)).ti,ab. (20,385)
16 (professional adj2 (education* or training)).ti,ab. (10,273)
17 or/11‐16 (86,476)
18 *residency education/ or *clinical competence/ (33,743)
19 exp *physician/ or exp *paramedical personnel/ or exp *dentistry/ or exp *preventive dentistry/ or *dental surgery/ or *medical staff/ (436,742)
20 exp *nursing discipline/ or *nursing/ or exp *nurse/ (198,972)
21 *optometry/ or *podiatry/ or *medical psychology/ or *serology/ (10,730)
22 *psychiatry/ or *child psychiatry/ (56,997)
23 (counsel?or? or dental aide or dental aides or dental hygienist? or dentist? or dietetic? or dietician? or doctor? or general practitioner? or health* professional? or hospitalist? or medical aide? or medical aides or medical technician? or nurse or nurses or nutritionist? or orthodontist? or pediatric* or paediatric* or pharmacist? or physician? or physiotherapist? or psychiatrist? or psychiatric? aide or psychiatric aides or psychologist? or practitioner? or rheumatologist? or surgeon? or therapist?).ti. (563,136)
24 (internship? or intern? or resident? or residency or residencies).ti. (52,381)
25 or/18‐24 (1,074,085)
26 ((print or printed or paper) adj2 (display? or document? or education* material? or format? or portfolio or material? or media or medium? or workshop? material?)).ti,ab. (6,247)
27 ((print or printed) adj5 (format or formats)).ti,ab. (342)
28 (printed adj4 (diagram? or text)).ti,ab. (197)
29 (paper adj5 format?).ti,ab. (925)
30 (book? or booklet? or brochure? or bulletin? or handout? or hand‐out? or "hard copy" or hardcopy or "hard copies" or hardcopies or monograph* or paper‐based or "paper copy" or "paper copies" or print‐based or pamphlet? or poster?).ti,ab. (78,210)
31 (written material? or written teaching or written learning).ti,ab. (1,507)
32 (mail* adj2 (information or guideline? or publication? or protocol? or practice guideline or therap* guideline? or prescrib* guideline or article or articles or research or result? or study or studies or journal? or copy or copies)).ti,ab. (2,178)
33 *medical illustration/ (1,663)
34 *book/ (6,147)
35 or/26‐34 (94,118)
36 ((guideline? or best practice? or evidence or ebm) adj2 (adher* or apply* or application or disseminat* or implement* or introduc* or publication or release or uptake)).ti,ab. (35,866)
37 ((publication or published) adj2 (guideline? or protocol?)).ti,ab. (14,150)
38 or/36‐37 (48,627)
39 exp *evidence based practice/ (75,171)
40 (evidence based adj2 (practice? or practitioner? or medicine or medical or treatment? or therap* or nurse or nurses or nursing or dentist* or healthcare or care)).ti,ab. (48,204)
41 (applied learning or knowledge transfer* or knowledge translation).ti,ab. (4,728)
42 or/39‐41 (114,578)
43 *patient care/ (62,727)
44 exp *nursing assessment/ (12,033)
45 *patient care planning/ or *primary health care/ or *progressive patient care/ or *health care delivery/ or *integrated health care system/ or *health care policy/ or *disease management/ or *managed care/ or *medication therapy management/ or *patient selection/ or *health care quality/ or *rapid response team/ or *clinical pathways/ (247,339)
46 or/43‐45 (314,218)
47 (impact and guideline?).ti. (1,843)
48 (effect* and guideline?).ti. (2,040)
49 (impact and bulletin?).ti. (20)
50 (impact and publication?).ti. (293)
51 (impact and disseminat*).ti. (188)
52 (guideline and (notification or notify*)).ti. (7)
53 (publication and evidence).ti. (104)
54 (guideline? and disseminat*).ti. (258)
55 (publication and (influenc* or impact or chang* or prescribing or physician? behavio?r?)).ti. (381)
56 *drug utilization/ and publication.ti,ab. (32)
57 *clinical practice/ and *practice guidelines/ (1,739)
58 publication.ti. and *clinical practice/ (26)
59 publication.ti. and *practice guidelines/ (206)
60 *general practice/ and *practice guidelines/ (431)
61 *primary health care/ and *practice guidelines/ (314)
62 (guideline? and (impact or influence)).ti. (2,128)
63 or/47‐62 (7,638)
64 randomized controlled trial/ (535,024)
65 controlled clinical trial/ (460,263)
66 quasi experimental study/ (5,320)
67 pretest posttest control group design/ (367)
68 time series analysis/ (22,330)
69 experimental design/ (16,480)
70 multicenter study/ (206,737)
71 (randomis* or randomiz* or randomly).ti,ab. (1,130,340)
72 groups.ab. (2,577,276)
73 (trial or multicentre or multicenter or multi centre or multi center).ti. (318,120)
74 (intervention? or effect? or impact? or controlled or control group? or (before adj5 after) or (pre adj5 post) or ((pretest or pre test) and (posttest or post test)) or quasiexperiment* or quasi experiment* or pseudo experiment* or pseudoexperiment* or evaluat* or time series or time point? or repeated measur*).ti,ab. (11,140,123)
75 or/64‐74 (12,434,986)
76 (systematic review or literature review).ti. (150,479)
77 "cochrane database of systematic reviews".jn. (13,098)
78 exp animals/ or exp invertebrate/ or animal experiment/ or animal model/ or animal tissue/ or animal cell/ or nonhuman/ (25,460,512)
79 human/ or normal human/ or human cell/ (19,398,295)
80 78 not (78 and 79) (6,115,213)
81 76 or 77 or 80 (6,277,399)
82 75 not 81 (9,546,533)
83 10 or (17 and 25) or 38 or 42 or (25 and 46) (243,348)
84 35 and 82 and 83 (1,982)
85 63 and 82 (5,081)
86 6 or 84 or 85 (7,677)
87 limit 86 to yr="2018 ‐Current" (639)
Cochrane Library: Central Register of Controlled Trials, CDSR, DARE, NHS EED, HTA, MTH (OVID)
Search date: 6 February 2019
No. Search terms Results
#1 (print* next education*):ti or (print* next education*):ab (96)
#2 ((print or printed) near/2 intervention):ti,ab (114)
#3 ((allied next health* or counsellor or counselor or doctor or nurse or nurses or physician or physiotherapist or therapist or dentist or pharmacist or health* next worker or health* next staff) near/2 (pamphlet or booklet or poster or brochure or written next material or printed or print)):ti,ab (24)
#4 (paper next based next education*):ti,ab (7)
#5 (postal near/4 guideline):ti,ab (5)
#6 {or #1‐#5} (241)
#7 [mh "education, dental, continuing"] or [mh "education, medical, continuing"] or [mh "education, nursing, continuing"] or [mh "education, pharmacy, continuing"] (1,008)
#8 (continuing next (medical or nursing or pharma* or dental* or physician or doctor or surg*) near/2 education*):ti,ab (285)
#9 ((continuing next education*) near/2 (medical or nursing or pharma* or dental* or physician or doctor or surg*)):ti,ab (14)
#10 cme:ti,ab (386)
#11 {or #7‐#10} (1,420)
#12 [mh "education, professional"] or [mh "education, continuing"] or [mh "education, professional, retraining"] (4,354)
#13 ((train* or educat*) near/2 (clinical next competenc* or practitioner or practice or general next practi* or family next doctor)):ti,ab (801)
#14 [mh "education department, hospital"] (1)
#15 (continuing near/2 education*):ti,ab (490)
#16 (professional near/2 (development* or education* or retrain* or skill next enhanc* or (skill near/2 improv*) or training or upgrade or upgrading)):ti,ab (410)
#17 (professional near/2 (education* or training)):ti,ab (250)
#18 {or #12‐#17} (5,619)
#19 [mh physicians] or [mh nurses] or [mh "internship and residency"] or [mh preceptorship] or [mh "clinical competence"] (7,906)
#20 [mh "allied health personnel"] not [mh "animal technicians"] (1,014)
#21 [mh "health occupations"] not [mh "veterinary medicine"] (19,273)
#22 [mh "medical staff"] or [mh "nursing staff"] or [mh pharmacists] or [mh " laboratory personnel"] or [mh dentists] or [mh "dental staff"] or [mh "health facility administrators"] (4,571)
#23 (counsellor or counselor or dental next aide? or dental next hygienist or dentist or dietetic or dietician or doctor or general next practitioner or health* next professional or hospitalist or medical next aide? or medical next technician or nurse or nurses or nutritionist or orthodontist or pediatric* or paediatric* or pharmacist or physician or physiotherapist or psychiatrist or psychiatric next aide? or psychologist or practitioner or rheumatologist or surgeon or therapist):ti (17,773)
#24 (internship or intern or resident or residency or residencies):ti (541)
#25 {or #19‐#24} (41,961)
#26 ((print or printed or paper) near/2 (display or document or education* or format or portfolio or material or media or medium or workshop)):ti,ab (358)
#27 ((print or printed) near/5 (format or formats)):ti,ab (27)
#28 (printed near/4 (diagram or text)):ti,ab (15)
#29 (paper near/5 format):ti,ab (71)
#30 (book or booklet or brochure or bulletin or handout or hand‐out or "hard copy" or hardcopy or "hard copies" or hardcopies or monograph* or paper‐based or "paper copy" or "paper copies" or print‐based or pamphlet or poster):ti,ab (4,280)
#31 (written next material or written next teaching or written next learning):ti,ab (115)
#32 (mail* near/2 (information or guideline or publication or protocol or practice guideline or therap* guideline or prescrib* guideline or article or articles or research or result or study or studies or journal or copy or copies)):ti,ab (213)
#33 [mh books] or [mh "manuals as topic"] or [mh "reference books"] or [mh " textbooks as topic"] or [mh "broadsides as topic"] or [mh pamphlets] or [mh "posters as topic"] (1,132)
#34 {or #26‐#33} (5,522)
#35 [mh "guideline adherence"] (959)
#36 ((guideline or best next practice or evidence or ebm) near/2 (adher* or apply* or application or disseminat* or implement* or introduc* or publication or release or uptake)):ti,ab (1,591)
#37 ((publication or published) near/2 (guideline or protocol)):ti,ab (520)
#38 {or #35‐#37} (2,895)
#39 [mh "guidelines as topic"] or [mh "practice guidelines as topic"] (1,761)
#40 [mh "evidence‐based practice"] (1,160)
#41 ((evidence next based) near/2 (practice or practitioner or medicine or medical or treatment or therap* or nurse or nurses or nursing or dentist* or healthcare or care)):ti,ab (2,208)
#42 (applied next learning or knowledge next transfer* or knowledge next translation):ti,ab (253)
#43 {or #40‐#42} (3,268)
#44 [mh "patient care management"] or [mh "quality of health care"] (424,775)
#45 #11 or (#18 and #25) or #38 or #39 or #43 or (#25 and #44) (32,558)
#46 #34 and #45 (746)
#47 #6 or #46 (940)
#48 #6 or #46 with Cochrane Library publication date Between Apr 2018 and Feb 2019 (87)
Healthstar (OVID)
Search date: 6 February 2019
1 (guideline? and (impact or influence)).ti. (706)
2 (impact and guideline?).ti. (577)
3 (effect$ and guideline?).ti. (768)
4 (impact and bulletin?).ti. (4)
5 (impact and publication?).ti. (111)
6 (impact and publication?).ti. (111)
7 (guideline and (notification or notify$)).ti. (2)
8 (publication and evidence).ti. (45)
9 (guideline? and disseminat$).ti. (106)
10 drug utilization/ and publication.ti,ab. (98)
11 education, dental, continuing/ or education, medical, continuing/ or education, nursing, continuing/ or education, pharmacy, continuing/ (20180)
12 11 and patient education as topic/ (551)
13 *PHysician's practice patterns/ and *practice guidelines as topic/ (1158)
14 *Family practice/ and *practice guidelines as topic/ (395)
15 *primary health care/ and *practice guidelines as topic/ (403)
16 publication.ti. and physician's practice patterns/ (42)
17 (publication and (influenc$ or impact or chang$ or prescribing or physician? behavio?r?)).ti. (155)
18 publication.ti. and practice guidelines as topic/ (95)
19 or/1‐10,12‐18 (4194)
20 (or/1‐10,12‐18) not "publication bias".ti. [Print‐Ed‐Included‐Studies‐Strategy‐written retrospecitvely to identify Studies included in 2008 Review which were not found by strategies published in 2008 Review] (4167)
21 print$ education$.ti,ab. (85)
22 ((print or printed) adj2 intervention?).ti,ab. (91)
23 ((allied health$ or counsel?or? or doctor? or nurse or nurses or physician? or physiotherapist? or therapist? or dentist? or pharmacist? or health$ worker? or health$ staff) adj2 (pamphlet? or booklet? or poster? or brochure? or written material? or printed or print)).ti,ab. (67)
24 paper‐based education$.ti,ab. (5)
25 (postal adj4 guideline?).ti,ab. (17)
26 (spiral bound or bound copy or bound copies).ti,ab. (5)
27 or/21‐26 [KW screen without filters] (263)
28 education, dental, continuing/ or education, medical, continuing/ or education, nursing, continuing/ or education, pharmacy, continuing/ (20180)
29 (continuing adj (medical or nursing or pharma$ or dental$ or physician? or doctor? or surg$) adj2 education$).ti,ab. (2593)
30 (continuing education$ adj2 (medical or nursing or pharma$ or dental$ or physician? or doctor? or surg$)).ti,ab. (223)
31 CME.ti,ab. (2024)
32 or/28‐31 [CME] (22246)
33 education, professional/ or education, continuing/ or education, professional, retraining/ (6030)
34 ((train$ or educat$) adj2 (clinical competenc$ or practitioner? or practice? or general practi$ or family doctor?)).ti,ab. (7270)
35 Education Department, Hospital/ (39)
36 (continuing adj2 education$).ti,ab. (6446)
37 (professional adj2 (development$ or education$ or retrain$ or skill? enhanc$ or (skill? adj2 improv$) or training or upgrade? or upgrading)).ti,ab. (6939)
38 (professional adj2 (education$ or training)).ti,ab. (3309)
39 or/33‐38 [CE General/Professional Dev General] (24630)
40 exp Physicians/ or exp Nurses/ or "Internship and Residency"/ or Preceptorship/ or Clinical Competence/ (134902)
41 (exp Allied Health Personnel/ not Animal Technicians/) or (exp Health Occupations/ not exp Veterinary Medicine/) (550493)
42 exp Medical Staff/ or exp Nursing Staff/ or Pharmacists/ or Laboratory Personnel/ or exp Dentists/ or exp Dental Staff/ (50947)
43 exp Health Facility Administrators/ (4675)
44 (counsel?or? or dental aide or dental aides or dental hygienist? or dentist? or dietetic? or dietician? or doctor? or general practitioner? or health$ professional? or hospitalist? or medical aide? or medical aides or medical technician? or nurse or nurses or nutritionist? or orthodontist? or pediatric$ or paediatric$ or pharmacist? or physician? or physiotherapist? or psychiatrist? or psychiatric? aide or psychiatric aides or psychologist? or practitioner? or rheumatologist? or surgeon? or therapist?).ti. (166618)
45 (internship? or intern? or resident? or residency or residencies).ti. (16401)
46 or/40‐45 [Health Professionals] (727007)
47 ((print or printed or paper) adj2 (DISPLAY? or document? or education$ material? or format? or portfolio or material? or media or medium? or workshop? material?)).ti,ab. (1987)
48 ((print or printed) adj5 (format or formats)).ti,ab. (98)
49 (printed adj4 (diagram? or text)).ti,ab. (50)
50 (paper adj5 format?).ti,ab. (302)
51 (book? or booklet? or brochure? or bulletin? or handout? or hand‐out? or "hard copy" or hardcopy or "hard copies" or hardcopies or monograph$ or paper‐based or "paper copy" or "paper copies" or print‐based or pamphlet? or poster?).ti,ab. (19066)
52 (written material? or written teaching or written learning).ti,ab. (525)
53 (mail$ adj2 (information or guideline? or publication? or protocol? or practice guideline or therap$ guideline? or prescrib$ guideline or article or articles or research or result? or study or studies or journal? or copy or copies)).ti,ab. (567)
54 exp books/ or manuals as topic/ or reference books/ or textbooks as topic/ or broadsides as topic/ or pamphlets/ (8734)
55 posters as topic/ (122)
56 or/47‐55 [print material KW & MeSH] (28867)
57 Guideline adherence/ (20923)
58 ((guideline? or best practice? or evidence or EBM) adj2 (adher$ or apply$ or application or disseminat$ or implement$ or introduc$ or publication or release or uptake)).ti,ab. (11036)
59 ((publication or published) adj2 (guideline? or protocol?)).ti,ab. (4231)
60 or/57‐58 [GL Adherence] (29661)
61 Guidelines as Topic/ or Practice guidelines as Topic/ (100188)
62 exp Evidence‐based practice/ (61863)
63 (evidence based adj2 (practice? or practitioner? or medicine or medical or treatment? or therap$ or nurse or nurses or nursing or dentist$ or healthcare or care)).ti,ab. (21191)
64 (applied learning or knowledge transfer$ or knowledge translation).ti,ab. (1510)
65 or/62‐64 [EBM/KT] (71339)
66 exp patient care management/ or comprehensive health care/ or critical pathways/ or "delivery of health care"/ or "delivery of health care, integrated"/ or health care reform/ or dentist's practice patterns/ or disease management/ or medication reconciliation/ or medication therapy management/ or nurse's practice patterns/ or patient care team/ or nursing, team/ or patient‐centered care/ or "quality of health care".mp. [mp=title, original title, abstract, name of substance word, subject heading word] (409800)
67 (randomized controlled trial or controlled clinical trial).pt. or randomized.ab. or placebo.ab. or clinical trials as topic.sh. or randomly.ab. or trial.ti. (502713)
68 exp animals/ not humans.sh. (996)
69 67 not 68 [Cochrane RT Filter 6.4.d Sens/Precision Maximizing] (502698)
70 intervention?.ti. or (intervention? adj6 (clinician? or collaborat$ or community or complex or DESIGN$ or doctor? or educational or family doctor? or family physician? or family practitioner? or financial or GP or general practice? or hospital? or impact? or improv$ or individuali?e? or individuali?ing or interdisciplin$ or multicomponent or multi‐component or multidisciplin$ or multi‐disciplin$ or multifacet$ or multi‐facet$ or multimodal$ or multi‐modal$ or personali?e? or personali?ing or pharmacies or pharmacist? or pharmacy or physician? or practitioner? or prescrib$ or prescription? or primary care or professional$ or provider? or regulatory or regulatory or tailor$ or target$ or team$ or usual care)).ab. (116512)
71 (pre‐intervention? or preintervention? or "pre intervention?" or post‐intervention? or postintervention? or "post intervention?").ti,ab. [added 2.4] (8542)
72 (hospital$ or patient?).hw. and (study or studies or care or health$ or practitioner? or provider? or physician? or nurse? or nursing or doctor?).ti,hw. (428091)
73 demonstration project?.ti,ab. (1050)
74 (pre‐post or "pre test$" or pretest$ or posttest$ or "post test$" or (pre adj5 post)).ti,ab. (37589)
75 (pre‐workshop or post‐workshop or (before adj3 workshop) or (after adj3 workshop)).ti,ab. (425)
76 trial.ti. or ((study adj3 aim?) or "our study").ab. (352600)
77 (before adj10 (after or during)).ti,ab. (137289)
78 ("quasi‐experiment$" or quasiexperiment$ or "quasi random$" or quasirandom$ or "quasi control$" or quasicontrol$ or ((quasi$ or experimental) adj3 (method$ or study or trial or design$))).ti,ab,hw. (32940)
79 ("time series" adj2 interrupt$).ti,ab,hw. (958)
80 (time points adj3 (over or multiple or three or four or five or six or seven or eight or nine or ten or eleven or twelve or month$ or hour? or day? or "more than")).ab. (4436)
81 pilot.ti. (24698)
82 Pilot projects/ (55631)
83 (clinical trial or controlled clinical trial or multicenter study).pt. (357812)
84 (multicentre or multicenter or multi‐centre or multi‐center).ti. (19754)
85 random$.ti,ab. or controlled.ti. (415931)
86 (control adj3 (area or cohort? or compare? or condition or design or group? or intervention? or participant? or study)).ab. not (controlled clinical trial or randomized controlled trial).pt. (129239)
87 (control year? or experimental year? or (control period? or experimental period?)).ti,ab. [Added May 30‐2013] (1868)
88 evaluation studies as topic/ or prospective studies/ or retrospective studies/ [Added Jan 2013] (586775)
89 (utili?ation or programme or programmes).ti. [Added Jan 2013] (21776)
90 (during adj5 period).ti,ab. [Added Jan 2013] (117542)
91 ((strategy or strategies) adj2 (improv$ or education$)).ti,ab. [Added Jan 2013] (12346)
92 (purpose adj3 study).ab. (122332)
93 "comment on".cm. or review.pt. or (review not "peer review$").ti. or randomized controlled trial.pt. [Changed Jan 2013] (1695254)
94 (rat or rats or cow or cows or chicken? or horse or horses or mice or mouse or bovine or animal?).ti,hw. or veterinar$.ti,ab,hw. [Edited May 2013] (525379)
95 exp animals/ not humans.sh. (996)
96 (or/70‐92) not (or/93‐95) [EPOC Methods Filter 2.6‐added Evaluation Studies line forward‐‐Jan 20130 Medline] (1487504)
97 32 and 56 [CME & print] (465)
98 (39 and 46 and 56) not 97 [CE & health pro & print] (205)
99 (56 and 60) not (or/97‐98) [print & GL adherence] (486)
100 (56 and 61) not (or/97‐99) [print & GL as topic] (903)
101 (56 and 65) not (or/97‐100) [print and EBM/KT] (614)
102 (56 and 66 and 46) not (or/97‐101) [print & pt care & health pro] (1325)
103 (or/97‐102) not 27 [results before filters] (3944)
104 103 and 69 [RT results] (467)
105 (103 and 96) not 104 [EPOC results] (1336)
106 (2011$ or 2012$ or 2013$ or 2014$ or 2015$).ep,ed,yr. [2011‐2015 Limits] (2001858)
107 104 and 106 [RT 2015] (152)
108 105 and 106 [EPOC 2015] (417)
CINAHL (Ebsco)
Search date: 6 February 2019
No. Search terms Results
S1 TI (guideline? and (impact or influence)) (530)
S2 TI (effect* and guideline?) (608)
S3 TI (impact and bulletin?) (1)
S4 TI (impact and publication?) (38)
S5 guideline and (notification or notify*)) (327)
S6 TI (publication and evidence) (46)
S7 TI (guideline? and disseminat*) (73)
S8 (MH "Drug Utilization") and (TI publication OR AB publication) (62)
S9 (MH "Education, Continuing+") AND (MH "Patient Education+") (613)
S10 (MH "Practice Guidelines") and ((MH "Practice Patterns") OR (MH "Family Practice") OR (MH "Physicians, Family") OR (MH "Primary Health Care")) (4,713)
S11 (MH "Practice Patterns") AND TI publication* (13)
S12 TI (publication and (influenc* or impact or chang* or prescribing or behavior? or behaviour?)) (158)
S13 (MH "Practice Guidelines") AND TI publication* (150)
S14 S1 OR S2 OR S3 OR S4 OR S5 OR S6 OR S7 OR S8 OR S9 OR S10 OR S11 OR S12 OR S13 (7,157)
S15 TI print* education* OR AB print* education* (351)
S16 ( TI ((print or printed) N2 intervention?) ) OR ( AB ((print or printed) N2 intervention?) ) (37)
S17 ( TI ((allied health* or counsel?or? or doctor? or nurse or nurses or physician? or physiotherapist? or therapist? or dentist? or pharmacist? or health* worker? or health* staff) N2 (pamphlet? or booklet? or poster? or brochure? or written material? or printed or print)) ) OR ( AB ((allied health* or counsel?or? or doctor? or nurse or nurses or physician? or physiotherapist? or therapist? or dentist? or pharmacist? or health* worker? or health* staff) N2 (pamphlet? or booklet? or poster? or brochure? or written material? or printed or print)) ) (117)
S18 TI paper‐based education* OR AB paper‐based education* (24)
S19 TI (postal N4 guideline?) OR AB (postal N4 guideline?) (16)
S20 ( TI (spiral bound or bound copy or bound copies) ) OR ( AB (spiral bound or bound copy or bound copies) ) (10)
S21 S15 OR S16 OR S17 OR S18 OR S19 OR S20 (544)
S22 (MH "Education, Continuing+") (29,218)
S23 ( TI (continuing N (medical or nursing or pharma* or dental* or physician? or doctor? or surg*) N2 education*) ) OR ( AB (continuing N (medical or nursing or pharma* or dental* or physician? or doctor? or surg*) N2 education*) ) (10)
S24 ( TI (continuing education* N2 (medical or nursing or pharma* or dental* or physician? or doctor? or surg*)) ) OR ( AB (continuing education* N2 (medical or nursing or pharma* or dental* or physician? or doctor? or surg*)) ) (3,705)
S25 TI cme OR AB cme (4,469)
S26 S22 OR S23 OR S24 OR S25 (34,546)
S27 (MH "Refresher Courses") OR (MH "Education, Continuing") (10,784)
S28 ( TI ((train* or educat*) N2 (clinical competenc* or practitioner? or practice? or general practi* or family doctor?)) ) OR ( AB ((train* or educat*) N2 (clinical competenc* or practitioner? or practice? or general practi* or family doctor?)) ) (5,979)
S29 (MH "Education Department") (193)
S30 TI (continuing N2 education*) OR AB (continuing N2 education*) (13,973)
S31 ( TI (professional N2 (development* or education* or retrain* or skill? enhanc* or (skill? N2 improv*) or training or upgrade? or upgrading)) ) OR ( AB (professional N2 (development* or education* or retrain* or skill? enhanc* or (skill? N2 improv*) or training or upgrade? or upgrading)) ) (19,206)
S32 ( TI (professional N2 (education* or training)) ) OR ( AB (professional N2 (education* or training)) ) (9,292)
S33 S27 OR S28 OR S29 OR S30 OR S31 OR S32 (45,731)
S34 (MH "Health Personnel+") OR (MH "Preceptorship") (478,141)
S35 TI (counsel?or? or dental aide or dental aides or dental hygienist? or dentist? or dietetic? or dietician? or doctor? or general practitioner? or health* professional? or hospitalist? or medical aide? or medical aides or medical technician? or nurse or nurses or nutritionist? or orthodontist? or pediatric* or paediatric* or pharmacist? or physician? or physiotherapist? or psychiatrist? or psychiatric? aide or psychiatric aides or psychologist? or practitioner? or rheumatologist? or surgeon? or therapist?) (267,039)
S36 TI (internship? or intern? or resident? or residency or residencies) (15,106)
S37 S34 OR S35 OR S36 (653,440)
S38 ( TI ((print or printed or paper) N2 (display? or document? or education* material? or format? or portfolio or material? or media or medium? or workshop? material?)) ) OR ( AB ((print or printed or paper) N2 (display? or document? or education* material? or format? or portfolio or material? or media or medium? or workshop? material?)) ) (1,676)
S39 ( TI ((print or printed) N5 (format or formats)) ) OR ( AB ((print or printed) N5 (format or formats)) ) (118)
S40 ( TI (printed N4 (diagram? or text)) ) OR ( AB (printed N4 (diagram? or text)) ) (101)
S41 TI (paper N5 format?) OR AB (paper N5 format?) (80)
S42 ( TI (book? or booklet? or brochure? or bulletin? or handout? or hand‐out? or "hard copy" or hardcopy or "hard copies" or hardcopies or monograph* or paper‐based or "paper copy" or "paper copies" or print‐based or pamphlet? or poster?) ) OR ( AB (book? or booklet? or brochure? or bulletin? or handout? or hand‐out? or "hard copy" or hardcopy or "hard copies" or hardcopies or monograph* or paper‐based or "paper copy" or "paper copies" or print‐based or pamphlet? or poster?) ) (14,865)
S43 ( TI (written material? or written teaching or written learning) ) OR ( AB (written material? or written teaching or written learning) ) (1,001)
S44 ( TI (mail* N2 (information or guideline? or publication? or protocol? or practice guideline or therap* guideline? or prescrib* guideline or article or articles or research or result? or study or studies or journal? or copy or copies)) ) (67)
S45 ( AB (mail* N2 (information or guideline? or publication? or protocol? or practice guideline or therap* guideline? or prescrib* guideline or article or articles or research or result? or study or studies or journal? or copy or copies)) ) (1,025)
S46 (MH "Books+") OR (MH "Literature+") OR (MH "Pamphlets") OR (MH "Reference Tools+") OR (MH "Teaching Materials+") OR (MH "Posters") (146,695)
S47 S38 OR S39 OR S40 OR S41 OR S42 OR S43 OR S44 OR S45 OR S46 (161,342)
S48 (MH "Guideline Adherence") (12,409)
S49 ( TI ((guideline? or best practice? or evidence or ebm) N2 (adher* or apply* or application or disseminat* or implement* or introduc* or publication or release or uptake)) ) OR ( AB ((guideline? or best practice? or evidence or ebm) N2 (adher* or apply* or application or disseminat* or implement* or introduc* or publication or release or uptake)) ) (14,828)
S50 ( TI ((publication or published) N2 (guideline? or protocol?)) ) OR ( AB ((publication or published) N2 (guideline? or protocol?)) ) (3,276)
S51 S48 OR S49 OR S50 (28,314)
S52 (MH "Practice Guidelines") (66,258)
S53 (MH "Professional Practice, Evidence‐Based+") (69,070)
S54 ( TI (evidence based N2 (practice? or practitioner? or medicine or medical or treatment? or therap* or nurse or nurses or nursing or dentist* or healthcare or care)) ) OR ( AB (evidence based N2 (practice? or practitioner? or medicine or medical or treatment? or therap* or nurse or nurses or nursing or dentist* or healthcare or care)) ) (16,770)
S55 ( TI (applied learning or knowledge transfer* or knowledge translation) ) OR ( AB (applied learning or knowledge transfer* or knowledge translation) ) (3,749)
S56 S53 OR S54 OR S55 (80,995)
S57 (MH "Patient Care") OR (MH "Critical Path") OR (MH "Health Care Delivery") OR (MH "Health Care Delivery, Integrated") OR (MH "Health Care Reform") OR (MH "Practice Patterns") OR (MH "Disease Management") OR (MH "Medication Reconciliation") OR (MH "Medication Management") OR (MH "Multidisciplinary Care Team") OR (MH "Patient Centered Care") OR (MH "Team Nursing") OR (MH "Quality of Health Care") (238,838)
S58 (S26 OR S51 OR S52 OR S56 OR (S57 AND S37) OR (S33 AND S37)) AND S47 (8,805)
S59 S58 OR S14 (15,733)
S60 PT randomized controlled trial (87,211)
S61 PT clinical trial (86,249)
S62 PT research (1,957,247)
S63 (MH "Randomized Controlled Trials") (78,843)
S64 (MH "Clinical Trials") (143,143)
S65 (MH "Intervention Trials") (8,065)
S66 (MH "Nonrandomized Trials") (389)
S67 (MH "Experimental Studies") (23,580)
S68 (MH "Pretest‐Posttest Design+") (38,347)
S69 (MH "Quasi‐Experimental Studies+") (12,957)
S70 (MH "Multicenter Studies") (100,140)
S71 (MH "Health Services Research") (12,854)
S72 TI ( randomis* or randomiz* or randomly) OR AB ( randomis* or randomiz* or randomly) (243,613)
S73 TI (trial or effect* or impact* or intervention* or before N5 after or pre N5 post or ((pretest or "pre test") and (posttest or "post test")) or quasiexperiment* or quasi W0 experiment* or pseudo experiment* or pseudoexperiment* or evaluat* or "time series" or time W0 point* or repeated W0 measur*) OR AB (trial or effect* or impact* or intervention* or before N5 after or pre N5 post or ((pretest or "pre test") and (posttest or "post test")) or quasiexperiment* or quasi W0 experiment* or pseudo experiment* or pseudoexperiment* or evaluat* or "time series" or time W0 point* or repeated W0 measur*) (1,645,581)
S74 S60 OR S61 OR S62 OR S63 OR S64 OR S65 OR S66 OR S67 OR S68 OR S69 OR S70 OR S71 OR S72 OR S73 (2,675,849)
S75 S58 AND S74 (6,076)
S76 S21 OR S75 (6,565)
S77 Limiters ‐ Published Date: 20180401‐20190231; Exclude MEDLINE records (201,776)
S78 S76 AND S77 (248)
ERIC (ProQuest)
Search date: 6 February 2019
No. Search terms Results
S1 TI (guideline? and (impact or influence)) (28)
S2 TI (effect* and guideline?) (142)
S3 TI (impact and bulletin?) (27)
S4 TI (impact and publication?) (12)
S5 guideline and (notification or notify*)) (157)
S6 TI (publication and evidence) (24)
S7 TI (guideline? and disseminat*) (10)
S8 TI (publication and (influenc* or impact or chang* or prescribing or behavior? or behaviour?)) (99)
S9 S1 OR S2 OR S3 OR S4 OR S5 OR S6 OR S7 OR S8 (455)
S10 TI print* education* OR AB print* education* (557)
S11 ( TI ((print or printed) N2 intervention?) ) OR ( AB ((print or printed) N2 intervention?) ) (6)
S12 ( TI ((allied health* or counsel?or? or doctor? or nurse or nurses or physician? or physiotherapist? or therapist? or dentist? or pharmacist? or health* worker? or health* staff) N2 (pamphlet? or booklet? or poster? or brochure? or written material? or printed or print)) ) OR ( AB ((allied health* or counsel?or? or doctor? or nurse or nurses or physician? or physiotherapist? or therapist? or dentist? or pharmacist? or health* worker? or health* staff) N2 (pamphlet? or booklet? or poster? or brochure? or written material? or printed or print)) ) (12)
S13 TI paper‐based education* OR AB paper‐based education* (35)
S14 TI (postal N4 guideline?) OR AB (postal N4 guideline?) (2)
S15 ( TI (spiral bound or bound copy or bound copies) ) OR ( AB (spiral bound or bound copy or bound copies) ) (174)
S16 S10 OR S11 OR S12 OR S13 OR S14 OR S15 (783)
S17 ( TI (continuing N (medical or nursing or pharma* or dental* or physician? or doctor? or surg*) N2 education*) ) OR ( AB (continuing N (medical or nursing or pharma* or dental* or physician? or doctor? or surg*) N2 education*) ) (8)
S18 ( TI (continuing education* N2 (medical or nursing or pharma* or dental* or physician? or doctor? or surg*)) ) OR ( AB (continuing education* N2 (medical or nursing or pharma* or dental* or physician? or doctor? or surg*)) ) (815)
S19 TI cme OR AB cme (256)
S20 S17 OR S18 OR S19 (868)
S21 ( TI ((train* or educat*) N2 (clinical competenc* or practitioner? or practice? or general practi* or family doctor?)) ) OR ( AB ((train* or educat*) N2 (clinical competenc* or practitioner? or practice? or general practi* or family doctor?)) ) (12,731)
S22 TI (continuing N2 education*) OR AB (continuing N2 education*) (10,783)
S23 ( TI (professional N2 (development* or education* or retrain* or skill? enhanc* or (skill? N2 improv*) or training or upgrade? or upgrading)) ) OR ( AB (professional N2 (development* or education* or retrain* or skill? enhanc* or (skill? N2 improv*) or training or upgrade? or upgrading)) ) (46,086)
S24 ( TI (professional N2 (education* or training)) ) OR ( AB (professional N2 (education* or training)) ) (15,578)
S25 S21 OR S22 OR S23 OR S24 (66,593)
S26 TI (counsel?or? or dental aide or dental aides or dental hygienist? or dentist? or dietetic? or dietician? or doctor? or general practitioner? or health* professional? or hospitalist? or medical aide? or medical aides or medical technician? or nurse or nurses or nutritionist? or orthodontist? or pediatric* or paediatric* or pharmacist? or physician? or physiotherapist? or psychiatrist? or psychiatric? aide or psychiatric aides or psychologist? or practitioner? or rheumatologist? or surgeon? or therapist?) (8,115)
S27 TI (internship? or intern? or resident? or residency or residencies) (2,178)
S28 S26 OR S27 (10,182)
S29 ( TI ((print or printed or paper) N2 (display? or document? or education* material? or format? or portfolio or material? or media or medium? or workshop? material?)) ) OR ( AB ((print or printed or paper) N2 (display? or document? or education* material? or format? or portfolio or material? or media or medium? or workshop? material?)) ) (4,950)
S30 ( TI ((print or printed) N5 (format or formats)) ) OR ( AB ((print or printed) N5 (format or formats)) ) (324)
S31 ( TI (printed N4 (diagram? or text)) ) OR ( AB (printed N4 (diagram? or text)) ) (328)
S32 TI (paper N5 format?) OR AB (paper N5 format?) (137)
S33 ( TI (book? or booklet? or brochure? or bulletin? or handout? or hand‐out? or "hard copy" or hardcopy or "hard copies" or hardcopies or monograph* or paper‐based or "paper copy" or "paper copies" or print‐based or pamphlet? or poster?) ) OR ( AB (book? or booklet? or brochure? or bulletin? or handout? or hand‐out? or "hard copy" or hardcopy or "hard copies" or hardcopies or monograph* or paper‐based or "paper copy" or "paper copies" or print‐based or pamphlet? or poster?) ) (51,874)
S34 ( TI (written material? or written teaching or written learning) ) OR ( AB (written material? or written teaching or written learning) ) (3,252)
S35 ( TI (mail* N2 (information or guideline? or publication? or protocol? or practice guideline or therap* guideline? or prescrib* guideline or article or articles or research or result? or study or studies or journal? or copy or copies)) ) (48)
S36 ( AB (mail* N2 (information or guideline? or publication? or protocol? or practice guideline or therap* guideline? or prescrib* guideline or article or articles or research or result? or study or studies or journal? or copy or copies)) ) (745)
S37 S29 OR S30 OR S31 OR S32 OR S33 OR S34 OR S35 OR S36 (60,040)
S38 ( TI ((guideline? or best practice? or evidence or ebm) N2 (adher* or apply* or application or disseminat* or implement* or introduc* or publication or release or uptake)) ) OR ( AB ((guideline? or best practice? or evidence or ebm) N2 (adher* or apply* or application or disseminat* or implement* or introduc* or publication or release or uptake)) ) (3,624)
S39 ( TI ((publication or published) N2 (guideline? or protocol?)) ) OR ( AB ((publication or published) N2 (guideline? or protocol?)) ) (328)
S40 S38 OR S39 (3,741)
S41 ( TI (evidence based N2 (practice? or practitioner? or medicine or medical or treatment? or therap* or nurse or nurses or nursing or dentist* or healthcare or care)) ) OR ( AB (evidence based N2 (practice? or practitioner? or medicine or medical or treatment? or therap* or nurse or nurses or nursing or dentist* or healthcare or care)) ) (1,778)
S42 ( TI (applied learning or knowledge transfer* or knowledge translation) ) OR ( AB (applied learning or knowledge transfer* or knowledge translation) ) (4,313)
S43 S41 OR S42 (6,073)
S44 (S20 OR S40 OR S43 OR (S25 AND S28)) AND S37 (342)
S45 S44 OR S9 (795)
S46 TI ( randomis* or randomiz* or randomly) OR AB ( randomis* or randomiz* or randomly) (20,572)
S47 TI (trial or effect* or impact* or intervention* or before N5 after or pre N5 post or ((pretest or "pre test") and (posttest or "post test")) or quasiexperiment* or quasi W0 experiment* or pseudo experiment* or pseudoexperiment* or evaluat* or "time series" or time W0 point* or repeated W0 measur*) OR AB (trial or effect* or impact* or intervention* or before N5 after or pre N5 post or ((pretest or "pre test") and (posttest or "post test")) or quasiexperiment* or quasi W0 experiment* or pseudo experiment* or pseudoexperiment* or evaluat* or "time series" or time W0 point* or repeated W0 measur*) (586,374)
S48 S46 OR S47 (591,492)
S49 S44 AND S48 (173)
S50 S16 OR S49 (954)
S51 Limiters ‐ Date Published: 20180401‐20190231 (8,586)
S52 S50 AND S51 (7)
Appendix 2. Listing of the printed educational material evaluated in each of the included studies
| Study/PEM label(s) | PEM description | Availability |
| Adereti 2018 | Standardised Nursing Care Plans | SNCP is not available |
| Austin 2003/HERS trial report | Publication in peer‐reviewed journal: HERS: Hulley S, Grady D, Bush T, Furberg C, Herrington D, Riggs B, et al. Randomized trial of estrogen plus progestin for secondary prevention of coronary heart disease in postmenopausal women. JAMA 1998;280:605‐13 |
HERS is available |
| Austin 2004A/WHI trial report | Publication in peer‐reviewed journal: Writing Group for the Women’s Health Initiative Investigators. Risks and benefits of estrogen plus progestin in healthy postmenopausal women: principal results from the Women’s Health Initiative randomized controlled trial. JAMA 2002; 288:321‐33 |
WHI is available |
| Austin 2004B/ALLHAT trial report | Publication in peer‐reviewed journal: ALLHAT Officers and Coordinators for the ALLHAT Collaborative Research Group. Major outcomes in high‐risk hypertensive patients randomized to angiotensin‐converting enzyme inhibitor or calcium channel blocker vs. diuretic: the Antihypertensive and Lipid‐Lowering Treatment to Prevent Heart Attack Trial (ALLHAT). JAMA 2002;288:2981‐97 |
ALLHAT is available |
| Austin 2005/REVERSAL, PROVE IT–TIMI22 trials reports | 2 publications in peer‐reviewed journals:
|
REVERSAL, PROVE IT–TIMI22 are available |
| Avorn 1983/FDA Bulletin | Bulletin patterned after the Federal Drug Administration Drug Bulletin describing alternatives to targeted drugs | Not available |
| Azocar 2003/UBH guidelines | US United Behavioral Health (UBH) best practice guidelines for the treatment of major depression | Available |
| Barbaglia 2009/WHI trial report | Publication in peer‐reviewed journal: Writing Group for the Women’s Health Initiative Investigators. Risk and benefits of estrogens plus progestin in healthy postmenopausal women: principal results from the Women’s Health Initiative randomized controlled trial. JAMA 2002;288:321‐33 |
WHI is available |
| Barber 2017 ‐ VHA OXY, FDA FENTA, VHA FENTA, VHA PROPO |
|
Partially in the paper |
| Bearcroft 1994/UK guidelines | Guidelines for referrals for chest radiography for general practitioners | Not available |
| Beaulieu 2004/Guidelines summary | 1 page summary of Quebec provincial guidelines (Canada) for anti‐anginal therapy | Not available |
| Bjornson 1990/VA trial report | Publication in peer‐reviewed journal: Cohn JN, Archibald DG, Ziesche S, Franciosa JA, Harston WE, Tristani FE, et al. Effect of vasodilator therapy on mortality in chronic congestive heart failure. Results of a Veterans Administration cooperative study. N Engl J Med 986;314:1547‐52 |
VA available |
| Black 2002/EHC‐OM | EHC‐OM: National Health Service (NHS). The treatment of persistent glue ear in children. Effective Health Care (Bulletin) November 1992, Number 4 | EHC‐OM is available |
| Buyle 2010/Belgian guidelines | Belgian guidelines for sequential antibiotic therapy (intravenous to oral with fluoroquinolones) published in Pharmacotherapeutic Committee drug letter (October 2003) | Available |
| Chandy 2014 | Guidelines to improve antibiotic use by hospital inpatients in South India. Disseminated in the form of booklets | Not available. |
| Coopersmith 2002/self‐study module | 10‐page self‐study module on risk factors and practice modifications involved in catheter‐related infections for registered nurses | Available |
| Denig 1990/Dutch drug bulletin | Dutch drug bulletin Geneesmiddelenbulletin for physicians and pharmacists | Not available |
| Dickinson 2003 | Letter of recommendation on the identification of patients with somatisation and their appropriate care for the primary care physicians | Not available |
| Dormuth 2004/Canadian drug bulletin | 12 issues of the drug bulletin Therapeutics Letter | Not available |
| Dubey 2006 | The Preventive health Evidence‐based Recommendation Form (PERFORM), comprising the male and female evidence‐based Preventive Care Checklist Forms© based on Canadian Task Force on Preventive Health Care recommendations, and other sources where the Task Force had no up‐to‐date guidelines | Available |
| Evans 1986 | A mailed educational programme for primary care practitioners concerning the management of hypertension, particularly emphasising the problems of inadequate medical prescriptions and low patient compliance. The programme comprised 14 weekly instalments of practice‐oriented information, designed to be read in three to five minutes each, on the diagnosis, workup, therapy, and follow‐up of hypertensive patients, particularly emphasising the problems of inadequate medication prescriptions and low patient compliance. | Not available |
| Fijn 2000/Dutch national recommendations | Dutch national recommendations on antithrombotic prophylaxis of ischaemic heart disease | Not available |
| Fonarow 2009/MIRACL, PROVE‐IT TIMI 22, AHA‐AHA‐NS and ACC‐AHA‐STEMI | 2 publications in peer‐reviewed journals: MIRACL: Schwartz GG, Olsson AG, Ezekowitz MD, Ganz P, Oliver MF, Waters D et al. Effects of atorvastatin on early recurrent ischemic events in acute coronary syndromes: the MIRACL study: a randomized controlled trial. JAMA 2001;285:1711‐8
2 guidelines:
|
MIRACL, PROVE‐IT TIMI 22, AHA‐AHA‐NS, ACC‐AHA‐STEMI are available |
| Fukuda 2009/Japanese guidelines on breast cancer | Japanese evidence‐based clinical practice guidelines for treatment of early‐stage breast cancer | Not available |
| Fukuda 2018/Japanese BPSD guidelines | BPSD: Behavioral and Psychological Symptoms of Dementia. The purpose of the guidelines for initial coping with BPSD was to provide methods of managing BPSD at care faculties soon after the onset of such symptoms. | Japanese BPSD guidelines is not available. |
| Guadagnoli 2004 | Clinical recommendations for the care of newly discharged patients with acute myocardial infaRTion | Available |
| Guay 2007/WHI trial report | Publication in peer‐reviewed journal: Writing Group for the Women’s Health Initiative Investigators. Risk and benefits of estrogens plus progestin in healthy postmenopausal women: principal results from the Women's Health Initiative Randomized Controlled Trial. JAMA 2002;288:321‐33 |
WHI is available |
| Haas 2004/HERS and WHI trials reports | 2 publications in peer‐reviewed journals:
|
HERS, WHI are available |
| Hawley 2018/NICE guidelines on RA | NICE guidelines on rheumatoid arthritis (RA) | NICE guidelines on RA is not available |
| Hersh 2004/HERS, HERS II, WHI trials reports | 3 publications in peer‐reviewed journals:
|
HERS, HERS II, WHI are available |
| Izcovich 2011 | The PEMs consisted of emails sent daily to update participating clinicians on the results of bibliographic searches to help answer medical questions that arose during daily clinical practice. | |
| Jackevicius 2001/4S trial report | Publication in peer‐reviewed journal: Scandinavian Simvastatin Survival Study Group. Randomised trial of cholesterol lowering in 4444 patients with coronary heart disease: the Scandinavian Simvastatin Survival Study (4S). Lancet 1994;344:1383‐9 |
4S Available |
| Jameson 2010/NICE guidelines for orthopaedic surgery | The National Institute for Health and Clinical Excellence's recommendations and guideline on prophylaxis for venous thromboembolism in orthopaedic surgery | Not available |
| Jousimaa 2002/Finnish guidelines | Collection of Finnish clinical practice guidelines for primary and ambulatory care Evidence‐Based Medicine Guidelines (previously Physician's Desk Reference and Database) | Not available |
| Judge 2015 | British Society for Rheumatology (BSR) guidelines on rheumatoid arthritis (RA). Published in peer‐reviewed journal: Luqmani R, Hennell S, Estrach C, Birrell F, Bosworth A, Davenport G et al. British Society for Rheumatology and British Health Professionals in rheumatology guideline for the management of rheumatoid arthritis (the first two years). Rheumatology 2006;45:1167–9 |
BSR guidelines on RA is available. |
| Juurlink 2004/RALES trial report | Publication in peer‐reviewed journal: Pitt B, Zannad F, Remme WJ, Cody R, Castaigne A, Perez A et al. The effect of spironolactone on morbidity and mortality in patients with severe heart failure. N Engl J Med 1999;341:709‐17 |
RALES is available |
| Kabir 2007/LIFE, ALLHAT and VALUE trials reports | 3 publications in peer‐reviewed journals:
|
ALLHAT, VALUE, LIFE are available |
| Kajita 2010/Japanese guidelines on osteoporosis | Japanese evidence‐based guideline Evidence‐based guideline for the prevention of osteoporosis and osteoporotic fractures in community health | Not available |
| Komen 2017/ESC, PN, DTC, FN |
|
PEMs 1 to 4 are available |
| Kottke 1989/Smoking cessation booklet | Smoking cessation booklet Quit‐and‐win | Available |
| Kunz 2007 | Single‐sentence evidence summaries regarding medication for patients with chronic medical problems | Partly available (example available in Kunz 2007, Appendix A, page 5) |
| Lam 2009/4D trial report | Publication in peer‐reviewed journal: Wanner C, Krane V, Marz W, Olschewski M, Mann JFE, Ruf G et al. Atorvastatin in patients with type 2 diabetes mellitus undergoing hemodialysis. N Engl J Med 2005;353:238–48 |
4D is available |
| Lee 2018A/G2011, G2012 |
|
Available |
| Lee 2018B/NICE2007, AAP2011 |
|
Available |
| Li 2017Li 2017/MRSA, MRSA update |
|
Available |
| Luo 2018 | The PEM is entitled "2016 ACC/AHA/HFSA focused update on new pharmacological therapy for heart failure: an update of the 2013 ACCF/AHA guideline for the management of heart failure". This PEM was a report of the American College of Cardiology/American Heart Association; Task Force on Clinical Practice Guidelines and the Heart Failure Society of America; developed in collaboration With the American College of Chest Physicians and International Society for Heart and Lung Transplantation. It was published in peer‐reviewed journal:Journal of the American College of Cardiology Vol. 68, No. 13, 2016. | Available |
| Majumdar 2003/HOPE and RALES trials reports | 2 studies published in peer‐reviewed journals: HOPE study published in:
Randomised Aldactone Evaluation Study (RALES):
|
HOPE and RALES trials publications are available Available |
| Majumdar 2004/WHI trial report | Publication in peer‐reviewed journal: Writing Group for the Women’s Health Initiative Investigators. Risk and benefits of estrogens plus progestin in healthy postmenopausal women: principal results from the Women’s Health Initiative Randomized Controlled Trial. JAMA 2002;288:321‐33 |
WHI is available |
| Marincowitz 2018/SIGN1, 4H, SIGN2 |
|
|
| Markovitz 2017/Formulary, ACC/AHA Guideline |
|
|
| Mason 1998/99/EHC‐D | EHC‐D: National Health Service (NHS). The treatment of depression in primary care. Effective Health Care (Bulletin) March 1993, Number 5 | EHC‐D is available |
| Mason 2001/EHC‐OM | EHC‐OM: National Health Service (NHS). The treatment of persistent glue ear in children. Effective Health Care (Bulletin) November 1992, Number 4 | EHC‐OM is available |
| Matowe 2002/UK Royal College of Radiologists guidelines | Royal College of Radiologists. Making the Best Use of a Department of Radiology: Guidelines for Doctors. London: Royal College of Radiologists, 1998 | Not available |
| McEwen 2002 | The ‘GP desktop resource’ (GDR), is a smoking cessation intervention tool offering guidance for GPs in helping their patients stop smoking. It also includes tear‐off advice and information sheets for smoking patients. The GDR has been designed to increase the frequency and quality of smoking cessation advice given by GPs. | Not available |
| Meyer 2007/German guidelines for the ICU | Guidelines on empirical antibiotic treatment in the Intensive Care Unit (ICU) | Not available |
| Mohammadi 2015 | Educational pamphlet based on GPs’ prescription writing errors. The pamphlet has been prepared according to the most prevalent prescription writing problems identified from a checklist designed on the basis of identified errors to assess prescriptions. The conception of the pamphlet was achieved under the supervision of a pharmacologist and a clinical pharmacologist. | Not available |
| Naimer 2017 | 2012 Ontario cervical screening guidelines summary; is a 2‐page checklist. | is available |
| Nicholas 2009 | Toolkit promoting the use of BMI‐for‐age percentiles to screen youths aged 2 to 20 years for obesity and consisting of the following: • BMI calculator • sex‐specific BMI‐for‐age percentile growth charts • laminated office chart summarising steps to calculate, plot, and interpret BMI • printed recommendations of the American Academy of Pediatrics to prevent paediatric overweight • additional professional resources, including growth chart information, links to training modules, and links to the Bright Futures in Practice, a collection of patient and family questionnaires on nutrition | Partly available (BMI calculator, printed recommendations of the American Academy of Pediatrics, growth chart info, links to the Brights Futures in Practice) |
| Oakeshott 1994/UK Royal College of Radiologists guidelines | Royal College of Radiologists. Making the Best Use of a Department of Radiology: Guidelines for Doctors. London: Royal College of Radiologists, 1990 | Not available |
| Ouldali 2017 | This PEM is a 28‐page full guideline document published in a peer‐reviewed journal, as Azria R, Barry B, Bingen E, Cavallo JD, Chidiac C, Francois M et al. Systematic antibiotherapy in routine practice for upper respiratory tract infections in adults and children. Médecine et Maladies Infectieuses 42 (2012) 460–487 | Is available |
| Perria 2007/Italian guidelines | Italian evidence‐based guidelines for the management of non‐complicated type 2 diabetes mellitus | Not available |
| Rahme 2005 | A laminated sheet representing a decision tree used as a continuing medical education intervention to increase general practitioners’ ability to prescribe adequate pharmacological treatment for patients with osteoarthritis according to guidelines | Available |
| Rigobon 2019 | This PEM is a 227‐page full guideline document published in a peer‐reviewed journal, by Canadian Diabetes Association Clinical Practice Guidelines Expert Committee. Canadian Diabetes Association 2013 Clinical Practice Guidelines for the prevention and management of diabetes in Canada. Can J Diabetes 2013;37(suppl 1):S1‐S212. | Is available |
| Roberts 2007/NICE guidelines for primary hip replacement | National Institute for Health and Clinical Excellence (NICE). Guidelines on the Selection of Prostheses for Primary Hip Replacement. London: NHS, April 2000 | Available |
| Roifman 2017/Oct2005, Jun2009, Feb2014 |
|
|
| Sakai 2017 | Wilson W, Kathryn A. Taubert MG, Lockhart PB, Baddour LM, Levison M, et al. Prevention of infective endocarditis, Guidelines from the American Heart Association. Circulation. 2007;116:1736‐54 | Available |
| Salzler 2017/CMSG, CREST | 1. CMSG: A 50‐page document called Decision Memo for Carotid Artery Stenting (CAG‐00085R), developed and addressed as a memo by the Centers for Medicare and Medicaid Services (CMS) to Administrative File: CAG # 00085R, following publication of an original RT and and original studies not RTs, that showed carotid endarterectomy may be performed with less risk of stroke and death rates than carotid artery stenting 2. CREST: Brott TG, Hobson II RW,* Howard G. Stenting versus endarterectomy for treatment of carotid‐artery stenosis. N Engl J Med. 2010 July 1; 363(1): 11–23 |
Both PEMs are available. |
| Santerre 1996/ACOG guidelines | American College of Obstetricians and Gynecologists (ACOG) clinical management guidelines for vaginal birth after cesarean delivery (VBAC) | Not available |
| Shah 2008 | Publication in the New England Journal of Medicine suggesting an increased risk of myocardial infaRTion associated with rosiglitazone compared with active comparator or placebo | |
| Shah 2014 | Educational toolkit to improve management of cardiovascular risk factors and outcomes of cardiovascular disease in people with diabetes. The toolkit consists of a collection of printed educational materials, packaged in a brightly colored box with CDA branding. | Available |
| Stafford 2004/ALLHAT trial report | Publication in peer‐reviewed journal: ALLHAT Officers and Coordinators for the ALLHAT Collaborative Research Group. Major outcomes in high‐risk hypertensive patients randomized to angiotensin‐converting enzyme inhibitor or calcium channel blocker vs. diuretic: the Antihypertensive and Lipid‐Lowering Treatment to Prevent Heart Attack Trial (ALLHAT). JAMA 2002;288:2981‐97 |
ALLHAT is available |
| Steffensen 1997 | A set of local guidelines for anticoagulant therapy, including brief information on background, individual risk estimates, and suggestions for paraclinical investigations, all on one page. The guidelines comprised a supplementary page containing practical suggestions on to how to initiate oral anticoagulation in general practice and information about how to prepare and mail blood samples to the laboratory for monitoring of the international normalised ratio (INR). | Not available |
| Stocks 2017/MHRA2004, NICE2006, MHRA2009, CHALL |
|
All PEMs are available, except NICE 2006 |
| Tsuji 2009/Guidelines for Physician Depression | Depression diagnosis and treatment guide for primary care physicians | Not available |
| Tziraki 2000 | A manual to guide primary care practices in structuring their office environment and routine visits so as to enhance nutrition screening, advice/referral, and follow‐up for cancer prevention. | Available |
| Ulbricht 2014 | Coloured booklet of 54 pages addressing problematic psychotropic drug use, and targeting the management of prescription drug abuse and prescription drug dependence. The booklet focused more particularly on the following drug groups: sedatives, hypnotics, analgesics and psychostimulants. | Not available |
| Wang 2005/ADA and ATP III trials reports | ADA: American Diabetes Association (ADA) guidelines published in January 1998 advocated an LDL cholesterol goal under 100 mg/dL for patients with diabetes Publication in peer‐reviewed journal: ATP III: Expert Panel on Detection, Evaluation, and Treatment of High Blood Cholesterol in Adults: Executive summary of the third report of the National Cholesterol Education Program (NCEP) Expert Panel on Detection, Evaluation, and Treatment of High Blood Cholesterol in Adults (Adult Treatment Panel III). JAMA 2001;285:2486–97 |
ATP III is available |
| Watson 2001/Guidelines for Musculoskeletal Disorder | Guidelines for the use of oral Non‐Steroidal Anti‐inflammatory drugs (NSAIDs) in the management of musculoskeletal disorders | Available: Watson M. The Development, Implementation And Evaluation Of Prescribing Guidelines In General Practice. 1998; PhD Thesis Algorithm |
| Weaver 2016 | Printed version of the national guidelines on sexually transmitted infections (STI), South African National Department of Health (updated in 2008) + printed training modules available at https://edgh.uw.edu/series/sexually-transmitted-infections |
Available |
| Weiner 2017 | Ohio Guidelines for Emergency and Acute Care Facility Opioid and Other Controlled Substances (OOCS) Prescribing | Available |
| Weiss 2011 | Eleven 2‐page graphic user‐friendly guidelines providing clinical information and antibiotic recommendations | Available |
| Zwarenstein 2014 | Two types of PEM:
|
Available |
| Zwarenstein 2016 | PEM to promote the choice of thiazides as the first‐line treatment for individuals newly diagnosed with hypertension | Available |
Characteristics of studies
Characteristics of included studies [ordered by study ID]
Adereti 2018.
| Study characteristics | ||
| Methods | Study design: CBA | |
| Participants | Nurses (including interns) Clinical speciality: nursing care Level of training: fully trained Settings/country: inpatient/hospital setting/Nigeria Type of comparison: PEM only vs. single intervention
|
|
| Interventions | The intervention strategy for the study was the training of nurses on the use of electronic and paper SNCPs. The nurses were divided into two groups for the purpose of the training. The first group was the electronic SNCPs group while the second was the paper‐based SNCPs group. The two groups of nurses were trained using the SNLs educational package. The educational package was developed by the authors and given to a group of nursing and education experts for content validity. This package consists of four learning modules which are: Module 1: An overview of the nursing process; Module 2: Standardised Nursing Languages, Nursing Diagnoses (NANDA‐I), Nursing Outcomes Classification (NOC), and Nursing Interventions Classification (NIC); Module 3: Standardised Nursing Care Plans; Module 4: Benefits of EHRs and practical sessions on the use of electronic SNCPs. Each group attended the training for three consecutive days in a week for a total of 10 hours and 10 minutes to cover the contents of the module. The electronic group was trained to use the electronic SNCPs while the paper‐based group was trained to use the paper SNCPs. The training was modified based on pre‐intervention knowledge evaluation to meet an individual nurse’s need. At the end of the training, the electronic SNCPs template was installed into a computer in the electronic ward provided for the purpose of the study. The modified nursing process booklet containing Gordon’s functional health pattern assessment framework (Gordon 1994) for nursing assessment and the paper SNCPs templates were made available for use in the paper‐based ward. The nurses were monitored to ensure appropriate use of the SNCPs. Monthly clinical updates were held to ensure knowledge update and effective implementation. Case scenarios prepared by the nurses were used for the monthly update. The intervention phase lasted 6 months. Paper‐based standardised nursing care plans (SNCPs) was the PEM. |
|
| Outcomes | One process outcome: quality of nurses' documentation | |
| Notes | Funding: Information on funding was not available. | |
| Risk of bias | ||
| Bias | Authors' judgement | Support for judgement |
| Random sequence generation (selection bias) | High risk | Quote, pg. 3: "Using quasi‐experimental design, two wards were grouped into electronic and paper‐based wards." COMMENT: This was a CBA study. No random component was used in allocation. |
| Allocation concealment (selection bias) | High risk | COMMENT: This was a CBA study. No random component was used in allocation. |
| Baseline characteristics similar (selection bias) | Unclear risk | The authors just described the characteristics; no comparison was done (Table 1, p.4). |
| Baseline outcome similar Outcome 1 (outcome description in table above) | High risk | Important differences (Table 3. p.5) |
| Incomplete outcome data (attrition bias) Outcome 1 | Unclear risk | No information was provided to assess this risk. |
| Blinding of outcome assessment (detection bias) Outcome 1 | Unclear risk | No information was provided to assess this risk. |
| Contamination protection (contamination bias) | Unclear risk | No information was provided to assess this risk. |
| Selective reporting (reporting bias) Outcome 1 | Low risk | COMMENT: Relevant outcomes in the methods section were reported in the results. |
| Other bias | Unclear risk | No information was provided to assess this risk. |
Austin 2003.
| Study characteristics | ||
| Methods | Study design: ITS | |
| Participants | Physicians Clinical speciality: not clear Level of training: fully trained Setting/country: not clear/Canada |
|
| Interventions | Two PEMs were studied, however only 1 respected our inclusion criteria for ITS studies, namely that more than 3 points be available before and after the intervention. That PEM was the HERS study published in 1998, which demonstrated that the risks associated with hormone therapy outweighed the benefits for women on a continuous oestrogen and progestin regimen. | |
| Outcomes | Quarterly data used 2 healthcare professionals' practice outcomes (prescribing):
|
|
| Notes | Funding: pg. 3242: Funding/Support: The Institute for Clinical Evaluative Sciences is funded in part by an operating grant from the Ontario Ministry of Health and Long‐term Care. | |
| Risk of bias | ||
| Bias | Authors' judgement | Support for judgement |
| Intervention independent of other changes ‐ ITS | Unclear risk | No information was provided to assess this risk. |
| Shape of Intervention effect pre‐specified ‐ ITS | Unclear risk | No information was provided to assess this risk. |
| Intervention unlikely to affect data collection ‐ ITS | Low risk | The intervention (publication of the WHI study in 2002) did not affect either the source or method of data collection. |
| Blinding of outcome assessors (detection bias) ‐ ITS All outcomes | Low risk | The outcome was objective. |
| Incomplete outcome data (attrition bias) ‐ ITS All outcomes | Low risk | Quote, pg. 3241: "we studied claims for ERT to Ontario's universal Drug Benefit program for seniors (ODB), which tracks medication use by all 1.3 million residents of Ontario older than 65 years". |
| Selective reporting (reporting bias) ‐ ITS | Low risk | All relevant outcomes in the methods section were reported in the results section. |
| Other bias ‐ ITS | Low risk | There was no evidence of other risks of bias. |
Austin 2004A.
| Study characteristics | ||
| Methods | Study design: ITS | |
| Participants | Physicians; Clinical specialty: Not clear; Level of training: Fully trained; Setting/Country: Not clear/Canada |
|
| Interventions | The PEM was the Women’s Health Initiative (WHI) trial, published 17 July 2002, which concluded that overall health risks exceeded benefits from the use of combined oestrogen plus progestin among healthy postmenopausal women. | |
| Outcomes | Quarterly data used 2 healthcare professionals' practice outcomes (prescribing):
|
|
| Notes | Funding: pg. 192: The Institute for Clinical Evaluative Sciences is supported in part by a grant from the Ontario Ministry of Health and Long Term Care. The opinions, results and conclusions are those of the authors and no endorsement by the Ministry of Health and Long‐Term Care or by the Institute for Clinical Evaluative Sciences is intended or should be inferred. Dr. Austin is supported in part by a New Investigator award from the Canadian Institutes of Health Research (Institute for Health Services and Policy Research). | |
| Risk of bias | ||
| Bias | Authors' judgement | Support for judgement |
| Intervention independent of other changes ‐ ITS | Low risk | Quote, pg. 193: "our study demonstrated a significant increase in incident clonidine use exceeding secular trends among elderly postmenopausal women". |
| Shape of Intervention effect pre‐specified ‐ ITS | High risk | COMMENT: a rational explanation for the shape of intervention effects was not provided by the authors. |
| Intervention unlikely to affect data collection ‐ ITS | Low risk | Quote, pg. 191: "Retrospective, population‐based administrative database design" COMMENT: the intervention itself is unlikely to affect data collection. |
| Blinding of outcome assessors (detection bias) ‐ ITS All outcomes | Low risk | The outcome was objective. |
| Incomplete outcome data (attrition bias) ‐ ITS All outcomes | Low risk | Quote, pg. 192: "we studied incident claims for clonidine to Ontario's universal Drug Benefit program for seniors (ODB), which tracks medication use by all 1.3 million residents of Ontario 65 years of age and older". COMMENT: data were collected pre‐ and post‐intervention from the same province‐wide data base. |
| Selective reporting (reporting bias) ‐ ITS | Low risk | All relevant outcomes in the methods section were reported in the results section. |
| Other bias ‐ ITS | Low risk | There was no evidence of other risks of bias. |
Austin 2004B.
| Study characteristics | ||
| Methods | Study design: ITS | |
| Participants | Physicians Clinical speciality: not clear Level of training: fully trained Setting/country: not clear/Canada |
|
| Interventions | The PEM was the ALLHAT, published 18 December 2002, which concluded that thiazide‐type diuretics should be the first‐step antihypertensive therapy, compared with either calcium channel blockers or ACE inhibitors. | |
| Outcomes | 4 healthcare professionals' practice outcomes (prescribing):
|
|
| Notes | Funding: pg. 45: Funding/Support: The Institute for Clinical Evaluative Sciences is supported in part by a grant from the Ontario Ministry of Health and Long Term Care. Dr Austin is supported in part by a New Investigator award from the Institute of Health Services and Policy Research of the Canadian Institutes of Health Research. | |
| Risk of bias | ||
| Bias | Authors' judgement | Support for judgement |
| Intervention independent of other changes ‐ ITS | Unclear risk | No information was provided to assess this risk. |
| Shape of Intervention effect pre‐specified ‐ ITS | Unclear risk | No information was provided to assess this risk. |
| Intervention unlikely to affect data collection ‐ ITS | Low risk | The intervention (publication of the ALLHAT study in 2002) did not affect either the source or method of data collection. |
| Blinding of outcome assessors (detection bias) ‐ ITS All outcomes | Low risk | The outcome was objective. |
| Incomplete outcome data (attrition bias) ‐ ITS All outcomes | Low risk | Quote, pg. 44: "we studied claims for antihypertensive agents that were submitted to the Ontario Drug Benefit (ODB) program between January 1, 1992, and April 30, 2003. The ODB program tracks prescriptions dispensed to all 1.3 million residents of Ontario older than 65 years of antihypertensive agents following publication of the ALLHAT trial". |
| Selective reporting (reporting bias) ‐ ITS | Low risk | All relevant outcomes in the methods section were reported in the results section. |
| Other bias ‐ ITS | Low risk | There was no evidence of other risks of bias. |
Austin 2005.
| Study characteristics | ||
| Methods | Study design: ITS | |
| Participants | Physicians Clinical speciality: not clear Level of training: fully trained Setting/country: not clear/Canada |
|
| Interventions | Two PEMs were studied in this report: the REVERSAL trial, published 3 March 2004, which demonstrated that for patients with CHD, intensive lipid‐lowering therapy reduced the progression of coronary atherosclerosis compared with moderate therapy. One month later, the PROVE IT–TIMI22 trial (published 8 April 2004) demonstrated that among patients who have recently had an ACS, an intensive lipid‐lowering statin regimen provided greater protection against death or major cardiovascular events than did a standard regimen. In both trials, standard therapy consisted of 40 mg/day of pravastatin, whereas intensive therapy consisted of 80 mg/day of atorvastatin. We compared the data before the 2 publications to the data after the 2 publications. | |
| Outcomes | 2 healthcare professionals' practice outcomes (prescribing):
|
|
| Notes | We looked at the combined effect of the 2 PEMs because of a lack of data to look at them separately. In this case, the 2 PEMs studied had similar characteristics, and we considered them as a whole (i.e. 1 PEM), despite a gap between the pre‐intervention period, that ended in October 2003, and the post‐intervention period, which started in April 2004. That six‐month time lapse was not taken into account in the analysis. Funding: pg. 1297: The Institute for Clinical Evaluative Sciences is supported in part by a grant from the Ontario Ministry of Health and Long‐Term Care. The corresponding author (Peter C. Austin) is supported in part by a New Investigator award from the Canadian Institutes of Health Research (CIHR). One co‐author (Muhammad M. Mamdani) is supported by a New Investigator award from the New Emerging Teams of the CIHR. |
|
| Risk of bias | ||
| Bias | Authors' judgement | Support for judgement |
| Intervention independent of other changes ‐ ITS | Unclear risk | Quote, p. 1300: "we were unable to account for temporal influences beyond the publication of the results of the trials. In particular, we were unable to account for changes in drug company promotion patterns." Quote, p. 1300: "because of the study design and the relatively low monthly number of incident statin users, we were unable to definitively determine whether the trends that we observed were a result of an increase in the number of incident statin users who were being placed on high‐dose atorvastatin or whether they were because of prevalent statin users’ changing therapy". |
| Shape of Intervention effect pre‐specified ‐ ITS | Unclear risk | No information was provided to assess this risk. |
| Intervention unlikely to affect data collection ‐ ITS | Low risk | Quote pg. 1297: "we studied claims for statins to Ontario's universal Drug Benefit program for seniors (ODB) between June 1, 1997 (the month atorvastatin was added to the ODB formulary), and September 30, 2004. The ODB tracks medication use by all 1.4 million residents of Ontario older than 65 years". COMMENT: data source and method of collection unchanged throughout study |
| Blinding of outcome assessors (detection bias) ‐ ITS All outcomes | Low risk | The outcome was objective. |
| Incomplete outcome data (attrition bias) ‐ ITS All outcomes | Low risk | The authors used the complete database of all prescriptions in Ontario, so there were no missing data. |
| Selective reporting (reporting bias) ‐ ITS | Low risk | All relevant outcomes in the methods section were reported in the results section. |
| Other bias ‐ ITS | Low risk | There was no evidence of other risks of bias. |
Avorn 1983.
| Study characteristics | ||
| Methods | Study design: RT Unit of allocation: physicians Stratification by: geographic location Type of comparison: PEM only vs. nothing:
Groups considered in review: A and B |
|
| Participants | Physicians Clinical speciality: not clear Level of training: fully trained Setting/country: not clear/US |
|
| Interventions | The print‐only group received three issues of a drug newsletter and six four‐colour "unadvertisements", which advertised against using a drug. Each contained a large illustration and headline on its front side along with several key facts about the targeted drug or drug group. On the reverse side, the messages were elaborated with clinical findings, charts, and graphs from the scientific literature, along with recommended prescribing alternatives. | |
| Outcomes | 1 healthcare professionals' practice outcome Outcome 1: mean number of units prescribed per physician (all 3 drugs) |
|
| Notes | Funding: Information on funding was not available. | |
| Risk of bias | ||
| Bias | Authors' judgement | Support for judgement |
| Random sequence generation (selection bias) | Unclear risk | Quote, pg. 1460: "control and experimental interventions (described above) were then allocated randomly within each block". COMMENT: method of randomisation was not specified. |
| Allocation concealment (selection bias) | Low risk | Quote, pg. 1460: "control and experimental interventions (described above) were then allocated randomly within each block". |
| Baseline characteristics similar (selection bias) | Unclear risk | Quote, pg. 1460: "the physicians in each of the study groups were comparable before the intervention in terms of the amount of the target drugs they prescribed through Medicaid, their type of specialty and their board certification". COMMENT: there were no data tables provided, neither were raw data provided in the text. |
| Baseline outcome similar Outcome 1 (outcome description in table above) | Low risk | Quote, pg. 1460: "the model thus controlled for differences in pre‐intervention prescribing levels among individual physicians as well as for prescribing trends within the control group". |
| Incomplete outcome data (attrition bias) Outcome 1 | Low risk | While the authors did not give specific group‐by‐group dropout information, quote pg. 1460: "the dropout rates for each cause were found to be approximately equally divided among the three groups", total dropouts were 5% overall (see dropout rates: pg. 1460, right column, first paragraph). |
| Blinding of outcome assessment (detection bias) Outcome 1 | Low risk | The outcome was objective. |
| Contamination protection (contamination bias) | Low risk | Quote, pg. 1460: "If a small town contained more than one physician from our sample, all physicians in that town were randomized as a cluster to prevent cross‐contamination of information". |
| Selective reporting (reporting bias) Outcome 1 | Low risk | All relevant outcomes in the methods section were reported in the results section. |
| Other bias | Low risk | There was no evidence of other risks of bias. |
Azocar 2003.
| Study characteristics | ||
| Methods | Study design: RT Unit of allocation: physicians Type of comparison: PEM only vs. nothing
Groups considered in review: A and B |
|
| Participants | Psychologists, psychiatrists, Master's‐level therapists Clinical speciality: psychiatry and psychology Level of training: fully trained Setting/country: not clear/US |
|
| Interventions | The PEM consisted of the UBH best practice guidelines for the treatment of major depression, compiled from guidelines from both the American Psychiatric Association and the Agency for Health Care Policy and Research, as well as current research. The UBH guidelines consist of a 1‐page quick reference and an 8‐page reference booklet, and recommend basic steps in the assessment and treatment of major depression. The PEM was mailed to the intervention group of providers (n = 132), specifically targeting patients recently referred with a diagnosis of major depression. | |
| Outcomes | 4 healthcare professionals' practice outcomes:
|
|
| Notes | Funding: Information on funding was not available. | |
| Risk of bias | ||
| Bias | Authors' judgement | Support for judgement |
| Random sequence generation (selection bias) | Unclear risk | Quote (2001 article), pg. 1015: "simple randomization was used". |
| Allocation concealment (selection bias) | Unclear risk | Quote (2001 article), pg. 1015: "simple randomization was used". |
| Baseline characteristics similar (selection bias) | Low risk | Quote (2001 article), pg. 1015: "the type of license was controlled for in all group comparisons because it was somewhat confounded by group assignment". |
| Baseline outcome similar Outcome 1 (outcome description in table above) | Unclear risk | No information was provided. |
| Incomplete outcome data (attrition bias) Outcome 1 | Unclear risk | Quote (2003 article), pg. 115: "in addition, patient noncompliance with treatment recommendations and patient dropout was not measured, yet they are factors that can significantly influence treatment length and efficiency. Furthermore, services provided but not billed to UBH such as medication management by primary care physicians could not be accounted for". COMMENT: Not enough information was provided on dropout rates in each group and on reasons for dropping out. |
| Blinding of outcome assessment (detection bias) Outcome 1 | Low risk | Quote (2003 article), pg. 113: "guideline adherence was measured objectively using submitted claims and treatment plans provided by the clinicians". |
| Contamination protection (contamination bias) | Unclear risk | Quote (2003 article), pg. 1015: "simple randomization was used to give each clinician an equal chance of being assigned to each of the three groups…" COMMENT: professionals may have been allocated within a clinic or practice and it is possible that communication between intervention and control professionals could have occurred. |
| Selective reporting (reporting bias) Outcome 1 | Low risk | All relevant outcomes in the methods section were reported in the results section. |
| Other bias | High risk | Quote (2003 article), pg. 115: "the small number of sessions delivered by study clinicians could have been due to the overrepresentation of psychiatrists in the sample and their delivering primarily monthly medication management services, rather than weekly psychotherapy", and "Furthermore, services provided but not billed to UBH such as medication management by primary care physicians could not be accounted for". |
Barbaglia 2009.
| Study characteristics | ||
| Methods | Study design: ITS | |
| Participants | Physicians Clinical speciality: not clear Level of training: fully trained Setting/country: outpatient (e.g. ambulatory care provided by hospitals/specialists)/Spain |
|
| Interventions | The PEM was the WHI trial, published on 17 July 2002, which concluded that overall health risks exceeded benefits from use of combined oestrogen plus progestin among healthy postmenopausal women. | |
| Outcomes | 4 healthcare professionals' practice outcomes:
Prevalence was measured annually. |
|
| Notes | Funding: Financial disclosure/conflicts of interest: None reported | |
| Risk of bias | ||
| Bias | Authors' judgement | Support for judgement |
| Intervention independent of other changes ‐ ITS | Unclear risk | No information was provided. |
| Shape of Intervention effect pre‐specified ‐ ITS | Low risk | COMMENT: the authors described how previous studies had shown decreases in HT use based on pharmacy data. They proposed a study with direct reporting of HT use and a longer follow‐up period to better assess this trend. |
| Intervention unlikely to affect data collection ‐ ITS | Low risk | Data were collected during a breast screening programme that was not affected by the release of the trial. |
| Blinding of outcome assessors (detection bias) ‐ ITS All outcomes | Unclear risk | COMMENT: patients included in the study were interviewed at a breast cancer screening programme. The highly publicised nature of the WHI study suggests the possibility that the outcome assessor (patient) would be aware of the intervention. |
| Incomplete outcome data (attrition bias) ‐ ITS All outcomes | Low risk | COMMENT: specific data on loss to follow‐up was not given for pre‐post‐intervention or by age group. However, a very small percentage was lost. Quote, pg. 1062: "we excluded 1,467 women (2.8%) from the analysis because of their inconsistencies in successive answers about HT use as well as 42 women (0.1%) who refused to complete the questionnaire". |
| Selective reporting (reporting bias) ‐ ITS | Low risk | All relevant outcomes in the methods section were reported in results section. |
| Other bias ‐ ITS | High risk | The primary outcome was not objective (self report). |
Barber 2017.
| Study characteristics | ||
| Methods | Study design: ITS | |
| Participants | VHA (Veterans Health Administration) physician providers (including residents) Clinical speciality: general practice/family medicine Level of training: fully trained Settings/country: general practice/United States of America |
|
| Interventions | The four PEMs consisted of three Veterans Health Administration (VHA) directives and one Food and Drug Administration (FDA) directives on prescribing opioid analgesics:
|
|
| Outcomes | Four process outcomes: (1) Proportion of new oxycodone CR prescriptions that were preceded within the past 60 days by prescription for morphine or methadone (2) Proportion of new fentanyl prescriptions prescribed to patients who were prescribed another opioid whose day’s supply overlapped the start of fentanyl (3) Proportion of new propoxyphene prescriptions (4) Proportion of new propoxyphene prescriptions for which dose was less than 390 mg per day for propoxyphene HCL and 600 mg for propoxyphene napsylate |
|
| Notes | Funding: pg. 46: This work was supported by a grant from the CDC’s National Center for Injury Prevention and Control (grant no. R21CE001605, “Unintentional Poisoning from Prescription Drug Overdoses among Veterans”). | |
| Risk of bias | ||
| Bias | Authors' judgement | Support for judgement |
| Intervention independent of other changes ‐ ITS | High risk | Quote, pg. 45: "Finally, we assessed only the published directives; given the change in prescribing behavior over time, it is apparent that other mechanisms for changing provider behavior were at play that we were not measuring and that are important to understand." |
| Shape of Intervention effect pre‐specified ‐ ITS | Low risk |
Quotes, pg. 41: (by outcome) (1) outcome: trend of the proportion of new oxycodone CR prescriptions that were preceded within the past 60 days by prescription for morphine or methadone: Quote: "see fig1" (2) outcome : trend of the proportion of new fentanyl prescriptions prescribed to patients who were (versus were not) prescribed another opioid whose day’s supply overlapped the start of fentanyl: Quote: "see fig2" (3) outcome : trend of the proportion of new fentanyl prescriptions prescribed to patients who were (versus were not) prescribed another opioid whose day’s supply overlapped the start of fentanyl ‐ exclusion criteria specified: Quote: "see fig2" (4) outcome: trend of the proportion of new propoxyphene prescriptions for which each of the following is true: (1) patient has no current history (in past 365 days) of diagnosis of depression (ICD codes: 296.2x, 296.3x, 293.83, 300.4x, 311.x), alcohol abuse (291.x, 303.x, 305.00, 305.01, 305.02, 305.03), intentional self‐harm (E950.x–E959.x), no current or past history of diagnosis of drug abuse (292.x, 304.x, 305.2x–305.9x), renal or hepatic impairment (585.x, 586.x, 570.x, 571.x, 573.x, 070.x, 303. x, V113.x, 291.x, 357.5x, 535.3x, 425.5x, 265.2x, E860.0x), or seizures (345.x or 780.3x) : Quote: "see fig3" (5) outcome: trend of the proportion of new propoxyphene prescriptions for which dose was less than 390 mg per day for propoxyphene HCL and 600 mg for propoxyphene napsylate: Quote: "see fig4" |
| Intervention unlikely to affect data collection ‐ ITS | Unclear risk | No information was provided to assess this risk. |
| Blinding of outcome assessors (detection bias) ‐ ITS All outcomes | Unclear risk | No information was provided to assess this risk. |
| Incomplete outcome data (attrition bias) ‐ ITS All outcomes | Unclear risk | No information was provided to assess this risk. |
| Selective reporting (reporting bias) ‐ ITS | High risk | Quote, pg. 45: "Analysis may have missed some patients’ previous opioid prescriptions." COMMENT: All opioids were not considered in the study. |
| Other bias ‐ ITS | High risk | Quote, pg. 45: Some limitations existed: "Analysis may have missed some patients’ previous opioid prescriptions…." |
Bearcroft 1994.
| Study characteristics | ||
| Methods | Study design: C‐RT Unit of allocation: GP practices Type of comparison: PEM only vs. nothing:
|
|
| Participants | Physicians Clinical speciality: general practice/family medicine Level of training: fully trained Setting/country: general practice/UK |
|
| Interventions | The PEM consisted of a mailed package including guidelines for chest radiography referrals that were advisory only, as well as relevant background information. These guidelines were developed following a previous study involving the prospective analysis of 2017 consecutive chest radiography referrals. The presenting indications were compared with the subsequent radiological findings, and those indications with a particularly low yield were identified. The guidelines, therefore, were specifically relevant to local practice, and highlighted those groups of patients in whom, based on the previous study, significant abnormalities were uncommon. They were advisory only, and included a general reminder that a good clinical history, together with a presumptive diagnosis, would allow a more helpful, accurate, and patient‐specific report. | |
| Outcomes | Four healthcare professionals' practice outcomes:
|
|
| Notes | Funding: Information on funding was not available. | |
| Risk of bias | ||
| Bias | Authors' judgement | Support for judgement |
| Random sequence generation (selection bias) | Low risk | Quote, p. 56: "GP practices were allocated using a random number table into either the study or control group". |
| Allocation concealment (selection bias) | Low risk | COMMENT: the unit of allocation was by GP practice and allocation was performed on all units at the start of the study. |
| Baseline characteristics similar (selection bias) | High risk | No baseline characteristics were reported. |
| Baseline outcome similar Outcome 1 (outcome description in table above) | Unclear risk | No information was provided to assess this risk. |
| Incomplete outcome data (attrition bias) Outcome 1 | Unclear risk | This was not specified: while it was implied by it being a prospective analysis of all GP requests for chest radiography, it was not specified whether any of the records were missing after baseline. |
| Blinding of outcome assessment (detection bias) Outcome 1 | Unclear risk | While an attempt was made to blind the outcome assessors, quote, pg. 56: "the reporter was unaware from which group of GPs the request originated", this was not complete, quote, pg. 56: "the majority of the examinations performed were then reported by one of two radiologists (PWPB and JS)", and no quantification of this "majority" was provided. |
| Contamination protection (contamination bias) | High risk | Quote, pg. 58: "in addition, there may have been crossfertilization between study and control groups as GPs meet professionally and socially. Such an effect would be conservative, leading to a reduction in the overall difference". |
| Selective reporting (reporting bias) Outcome 1 | Low risk | All relevant outcomes in the methods section were reported in the results section. |
| Other bias | Low risk | There was evidence of potential unit of analysis error. |
Beaulieu 2004.
| Study characteristics | ||
| Methods | Study design: RT Unit of allocation: physicians Type of comparison: PEM only vs. nothing
Groups considered in review: A and B |
|
| Participants | Physicians Clinical speciality: general practice/family medicine, internal medicine, cardiology Level of training: fully trained Setting/country: mixed/Canada |
|
| Interventions | The PEM consisted of a 1‐page summary (developed by the Collège des Médecins du Québec) of existing provincial guidelines for anti‐anginal therapy. The summary incorporated 3 key messages targeting the most problematic prescribing practices identified in an earlier cross‐sectional study, namely low prescribing rates for antiplatelet and hypolipaemic drugs, and for β‐blockers in patients without apparent major contraindications. The key recommendations in the summary were (i) to write a prescription for acetylsalicylic acid (aspirin) for patients with stable angina; (ii) to control serum cholesterol, with a target value for LDL cholesterol < 2.6 mmol/L; and (iii) to favour β‐blockers as the first choice for anti‐angina medication. Data on prescribing rates for the 3 targeted medication classes by physicians practicing in the same regions as the participating physicians were also included in the 1‐page summary. | |
| Outcomes | 2 healthcare professionals' practice outcomes:
|
|
| Notes | Funding: pg. 30: This project was funded by the Health Transition Fund, Health Canada. The corresponding author (M.‐D. Beaulieu) received financial support from Aventis Pharma in 2000 to attend conferences to present preliminary results of a RT to evaluate the effectiveness of a workshop to modify physicians’ performances of periodic health examinations in adults. She also received a research grant from this company in 1998 to complete that study, which was also funded by the Medical Research Council of Canada. Another co‐author (J. Brophy) receives financial support from le Fonds de Recherche en Santé du Québec (FRSQ). | |
| Risk of bias | ||
| Bias | Authors' judgement | Support for judgement |
| Random sequence generation (selection bias) | Low risk | Quote, pg. 22: "the physicians identified in our previous study were randomly assigned, using computer‐generated random numbers, to one of three groups". |
| Allocation concealment (selection bias) | Low risk | COMMENT: the unit of allocation was by physician and allocation was performed on all units at the start of the study. |
| Baseline characteristics similar (selection bias) | High risk | TABLE 1, pg. 24: "there was no significant difference in the distribution of the sexes and medical training amongst the study groups. There was a significant difference in the distribution of professional experience and mean number of patients in the database according to the physician's training amongst the groups". |
| Baseline outcome similar Outcome 1 (outcome description in table above) | Unclear risk | No information was provided to assess this risk. |
| Incomplete outcome data (attrition bias) Outcome 1 | Unclear risk | Quote, pg. 23: "of the 3293 physicians in our initial study, 967 (29.4%) were not in the database in 1999, hence were considered lost to follow‐up. Thus 2326 (70.6%) were available for the current study (Figure 1). Since our database was anonymous, it was impossible to track down what happened to those physicians". |
| Blinding of outcome assessment (detection bias) Outcome 1 | Low risk | The outcome was objective. |
| Contamination protection (contamination bias) | High risk | Quote, pg. 30: "contamination might have occurred between the study groups, either directly (physicians in the intervention groups sharing information with physicians in the control groups) or indirectly (uptake of the guideline messages through the communication channels of various stakeholders and CME activities). Such contamination is indicated by our survey of a subsample of the physicians. 24 In this study, 90% of respondents, including physicians in the control group, were aware of the guidelines, and 75% had participated in at least one CME activity on the topic during the previous 6 months". |
| Selective reporting (reporting bias) Outcome 1 | Low risk | All relevant outcomes in the methods section were reported in the results section. |
| Other bias | Low risk | There was no evidence of other risks of bias. |
Bjornson 1990.
| Study characteristics | ||
| Methods | Study design: RT Unit of allocation: physicians Type of comparison: PEM only vs. nothing
|
|
| Participants | Physicians Clinical speciality: general practice/family medicine, internal medicine, cardiology Level of training: fully trained Setting/country: mixed/US |
|
| Interventions | The PEM consisted of a mailed package that contained (1) a covering letter and questionnaire from the Drug‐Use Review coordinator, (2) the New England Journal of Medicine article (12 June 1976), which showed that patients who had the vasodilators hydralazine hydrochloride and isosorbide dinitrate added to their drug therapy had a lower mortality than those who had digoxin and diuretics; and (3) a drug history profile of a congestive heart failure patient based on a computer match of heart failure and the less effective therapy described in the VA study. The primary objective was to evaluate the Drug‐Use Review programme as an agent of change in physician prescribing practices after results of a RT were published. | |
| Outcomes | 2 healthcare professionals' practice outcomes:
|
|
| Notes | Funding: Information on funding was not available. | |
| Risk of bias | ||
| Bias | Authors' judgement | Support for judgement |
| Random sequence generation (selection bias) | Unclear risk | No information was provided to assess this risk. |
| Allocation concealment (selection bias) | Unclear risk | No information was provided to assess this risk. |
| Baseline characteristics similar (selection bias) | Low risk | Quote, pg. 1543: "the physicians in the two groups were similar in terms of board certification, medical specialty, type and location of practice, sex ratio, medical school attended, and number of years of practice. The CHF patients represented by the two groups were well balanced in terms of age, sex ratio, and nursing home residency". |
| Baseline outcome similar Outcome 1 (outcome description in table above) | Unclear risk | No information was provided to assess this risk. |
| Incomplete outcome data (attrition bias) Outcome 1 | Unclear risk | Incomplete outcome data were only provided for the intervention group. |
| Blinding of outcome assessment (detection bias) Outcome 1 | Low risk | The outcome was objective. |
| Contamination protection (contamination bias) | High risk | Quote, p. 1543: "ninety‐five (67.4%) respondents in the intervention group indicated they were already aware of the VA study with 77 (54.6%) citing the New England Journal of Medicine article as the principal source of their knowledge (Table 1)". COMMENT: thus, perhaps the control group physicians were also aware of the study. Additionally, since the randomisation was not clustered by practice, physicians in the intervention group could have shared information with their colleagues in the control group. |
| Selective reporting (reporting bias) Outcome 1 | Low risk | All relevant outcomes in the methods section were reported in the results section. |
| Other bias | Unclear risk | COMMENT: there was no information provided regarding from where the outcome data were being recorded. It may have come from Medicaid, a similar computer‐based record, or physician surveys. |
Black 2002.
| Study characteristics | ||
| Methods | Study design: ITS | |
| Participants | Not clear Clinical speciality: not clear Level of training: fully trained Setting/country: not clear/UK |
|
| Interventions | The PEM consisted of an NHS Effective Health Care bulletin (November 1992) on the treatment of glue ear in children (EHC‐OM bulletin). The bulletin reviewed the research evidence available at the time and recognised the benefits of surgery for children with severe glue ear (otitis media with effusion), but cautioned against overuse of surgery in children with milder forms of the condition that might resolve without any intervention. The stated primary aim of this paper was to ascertain whether or not the passive dissemination of national guidelines to typical service providers (district general hospitals as well as teaching hospitals) had any impact on clinical practice. | |
| Outcomes | 1 healthcare professionals' practice outcome: surgery rate for glue ear (mean number of surgeries per 10,000 children aged under 10 years for 13 health districts) | |
| Notes | Funding: Information on funding was not available. | |
| Risk of bias | ||
| Bias | Authors' judgement | Support for judgement |
| Intervention independent of other changes ‐ ITS | Low risk | COMMENT: the authors presented 5 possible alternative reasons that could contribute to the observed outcome and provided compelling arguments that these factors may have contributed, but that the intervention was effective. Reasons considered: statistical artefact, supply factors, demand factors, organisational changes in the NHS and broadly publicised adverse publicity |
| Shape of Intervention effect pre‐specified ‐ ITS | Low risk | COMMENT: the authors stated that prior to the PEM, the rate of the surgery (primary outcome) was already declining, and that to demonstrate that the guidelines were effective: quote, pg. 121: "it would be necessary to show an acceleration in the decline. The primary aim of this paper is to ascertain whether or not the passive dissemination of national guidelines to typical service providers (district general hospitals as well as teaching hospitals) had any impact on clinical practice. Studies of such interventions in other areas have reported either no clinically significant effect or only a modest impact. If the guidelines were shown to have had an effect on this occasion, our secondary aim was to establish why this was so". |
| Intervention unlikely to affect data collection ‐ ITS | Low risk | The intervention (publication of the Effective Health Care bulletin on childhood surgery for glue ear ‐ 1992) did not affect either the source or method of data collection. |
| Blinding of outcome assessors (detection bias) ‐ ITS All outcomes | Low risk | The outcome was objective. |
| Incomplete outcome data (attrition bias) ‐ ITS All outcomes | Low risk | Quote, pg. 121‐122: "adjustments were made for shortfalls in the clinical coding in otolaryngology, which never exceeded a few percent in any year. It was assumed that failure to code procedures was not influenced by the procedure carried out. Intervention rates for surgery for OME were therefore adjusted according to the overall shortfall for the specialty". COMMENT: the authors did not provide numbers to support "a few percent"; however, it seems reasonable to infer that it was less than 10%. |
| Selective reporting (reporting bias) ‐ ITS | Low risk | All relevant outcomes in the methods section were reported in results section. |
| Other bias ‐ ITS | Low risk | There was no evidence of other risks of bias. |
Buyle 2010.
| Study characteristics | ||
| Methods | Study design: ITS | |
| Participants | Physicians Clinical speciality: not clear Level of training: fully trained Setting/country: hospital/inpatient/Belgium |
|
| Interventions | The PEM consisted of guidelines for sequential antibiotic therapy ‐ intravenous (IV) to per oral (PO) with fluoroquinolones ‐ published and disseminated in the local drug letter (October 2003), the official letter of the Pharmacotherapeutic Committee. This intervention was oriented towards all physicians (approximately 650) in the hospital. | |
| Outcomes | 1 healthcare professionals' practice outcome: usage of IV versus total fluoroquinolone. Usage was calculated on a monthly basis. | |
| Notes | Funding: None | |
| Risk of bias | ||
| Bias | Authors' judgement | Support for judgement |
| Intervention independent of other changes ‐ ITS | Unclear risk | No information was provided to assess this risk. |
| Shape of Intervention effect pre‐specified ‐ ITS | Low risk | COMMENT: the authors described the suitability of fluoroquinolones for IV to PO antibiotic switches and suggested that sequential therapy use would increase after implementation (which would be reflected by a decrease in the proportion of IV antibiotic out of total antibiotic use (IV + PO)). |
| Intervention unlikely to affect data collection ‐ ITS | Low risk | The intervention (publication/dissemination of guideline in the local drug letter in October 2003) did not affect either the source or method of data collection. |
| Blinding of outcome assessors (detection bias) ‐ ITS All outcomes | Low risk | The outcome was objective. |
| Incomplete outcome data (attrition bias) ‐ ITS All outcomes | Low risk | COMMENT: the reasons for loss to follow‐up were similar. The number lost was low and similarly distributed between groups (2/36 from control group; 5/45 in total from the 2 intervention groups). |
| Selective reporting (reporting bias) ‐ ITS | Low risk | All relevant outcomes in the methods section were reported in results section. |
| Other bias ‐ ITS | High risk | Quote, pg. 408‐409: "the intravenous/per oral ratio may be an indicator for implementing sequential therapy but could be biased by confounding factors. An example of a possible confounding factor is the length of stay of the patients. Patients who are switched to an oral therapy could be discharged earlier as the oral therapy can easily be continued at home. In this case the IV/PO ratio will increase as we only look at the consumption in the hospital". |
Chandy 2014.
| Study characteristics | ||
| Methods | Study design: ITS | |
| Participants | Physicians Clinical specialty: Unclear Level of training: Fully‐trained Setting/country: Tertiary care teaching hospital/South India |
|
| Interventions | The PEM in this study consisted of guidelines used to improve rational antibiotic use by hospital inpatients in South India. The guidelines were developed by the Antibiotic Policy Committee, with active participation of clinical departments and other stakeholders such as the pharmacy and microbiology department. They were passively disseminated in the form of booklets. | |
| Outcomes | 1 healthcare professionals' practice outcome: Outcome 1: Average monthly overall antibiotic defined daily doses (DDD) normalised for 100 beds/J01 |
|
| Notes | Funding: Information on funding was not available. | |
| Risk of bias | ||
| Bias | Authors' judgement | Support for judgement |
| Intervention independent of other changes ‐ ITS | High risk | QUOTE p.8: "The observed trends could have been influenced by other factors due to changes in the hospital over the decade. These factors include bed capacity, number of doctors, introduction of new laboratory tests and automation, antibiotic use audits and role of other health professionals such as clinical pharmacists." |
| Shape of Intervention effect pre‐specified ‐ ITS | Unclear risk | The point of intervention or a rational explanation for the shape of the intervention effect was not given by the authors. |
| Intervention unlikely to affect data collection ‐ ITS | Low risk | Quote: "Antibiotic use in inpatients was calculated using the hospital pharmacy computer system. Consumption was calculated as DDD (Defined Daily Doses) normalized for 100 bed days [15]". (p.2) Quote: "Inpatients do not receive antibiotics from sources outside the hospital during their hospital stay and hence all antibiotic use within the hospital was captured comprehensively" (p. 2). |
| Blinding of outcome assessors (detection bias) ‐ ITS All outcomes | Low risk | They used an objective outcome. QUOTE p. 2: "DDD per 100 bed days is an important indicator of inpatient antibiotic use and an objective measure of assessing changes in use due to interventions." |
| Incomplete outcome data (attrition bias) ‐ ITS All outcomes | Low risk | The authors used the hospital pharmacy computer system for their analyses, so there were no missing data. |
| Selective reporting (reporting bias) ‐ ITS | Low risk | All relevant outcomes in the methods section were reported in the results section. |
| Other bias ‐ ITS | Low risk | There was no evidence of other risks of bias. |
Coopersmith 2002.
| Study characteristics | ||
| Methods | Study design: ITS | |
| Participants | Physicians, nurses, critical care fellows Clinical speciality: not clear Level of training: fully trained Setting/country: hospital/inpatient/US |
|
| Interventions | The PEM consisted of a 10‐page self‐study module on risk factors and practice modifications involved in catheter‐related infections. The intervention was primarily targeted at registered nurses, and provided actions to address specific risk factors. The stated purpose of the study was to determine whether an education initiative aimed at improving central venous catheter insertion and care could decrease the rate of primary bloodstream infections. | |
| Outcomes | 1 healthcare professionals' practice outcome: monthly rate per 1000 central venous catheter days of catheter‐related bloodstream infections | |
| Notes | Funding: Information on funding was not available. | |
| Risk of bias | ||
| Bias | Authors' judgement | Support for judgement |
| Intervention independent of other changes ‐ ITS | Unclear risk | No information was provided to assess this risk. |
| Shape of Intervention effect pre‐specified ‐ ITS | Low risk | Quote, pg. 59: "to determine whether a focused education initiative in a surgical/burn/trauma ICU could decrease the primary bloodstream infection rate" |
| Intervention unlikely to affect data collection ‐ ITS | Low risk | The intervention (10‐page self‐study module about catheter‐related bloodstream infections) did not affect either the source or method of data collection. |
| Blinding of outcome assessors (detection bias) ‐ ITS All outcomes | Low risk | The outcome was objective. |
| Incomplete outcome data (attrition bias) ‐ ITS All outcomes | Low risk | Quote, pg. 60: "all patients admitted to the ICU between January 1, 1998, and June 30, 1999, were followed prospectively by an infection control team and surveyed for bloodstream infections". COMMENT: while this implied complete data follow‐up, this was not specified. |
| Selective reporting (reporting bias) ‐ ITS | Low risk | All relevant outcomes in the methods section were reported in results section. |
| Other bias ‐ ITS | High risk | Quote, pg. 63: "in a pre‐ and post‐observational, non‐randomised study, the ICU staff is not blinded to either the presence of or the recipients of the intervention. This raises the possibility of staff behaviour changes based upon the widespread knowledge of the measured outcome". |
Denig 1990.
| Study characteristics | ||
| Methods | Study design: RT Unit of allocation: physicians Stratification by: village or town Type of comparison: PEM only vs. nothing:
|
|
| Participants | Physicians Clinical speciality: general practice/family medicine Level of training: fully trained Setting/country: general practice/The Netherlands |
|
| Interventions | The PEM consisted of a bulletin that looked like a regular issue of the monthly Geneesmiddelenbulletin distributed by the Dutch government to all physicians and pharmacists. The bulletin used for the evaluation concerned the use of antispasmodic drugs for 2 kinds of spasms commonly seen in general practice: IBS and renal colic. The bulletin advised against (a) fixed combinations of antispasmodics with chlordiazepoxide, (b) PO/rectal butylscopolamine, and (c) fixed combinations of antispasmodics with metamizole. Recommended for renal colic were (d) diclofenac preparations. The objective was to evaluate the effects of a direct mailed drug bulletin on drug choice and prescribing practice in physicians. | |
| Outcomes | 2 healthcare professionals' practice outcomes:
|
|
| Notes | Funding: Information on funding was not available. | |
| Risk of bias | ||
| Bias | Authors' judgement | Support for judgement |
| Random sequence generation (selection bias) | Low risk | Quote from correspondence with author: "The allocation was conducted by using envelopes drawn by a person who was not involved in the research project". |
| Allocation concealment (selection bias) | Unclear risk | No information was provided to assess this risk. |
| Baseline characteristics similar (selection bias) | Low risk | Quote, pg. 6: "the physicians participating in this study were similar to their colleagues in The Netherlands with regard to years in practice, size of practice, percentage of elderly patients, and sex distribution of patients (table 5.1). Moreover, there were no significant differences in these characteristics between the control and intervention groups of the study (t‐tests; P > 0.05)". |
| Baseline outcome similar Outcome 1 (outcome description in table above) | Low risk | Quote, pg. 7: "...before the intervention, the study groups did not differ significantly in terms of knowledge, perceived drug utility, or stated prescription. Nor did a significant difference occur in actual prescribing between the intervention and control groups (Tables 5.2‐5.5). The physicians in both study groups who were interviewed, however, prescribed fewer antispasmodics in general as well as fewer undesirable antispasmodics than the physicians who did not agree to be interviewed but permitted the use of their prescribing data". |
| Incomplete outcome data (attrition bias) Outcome 1 | Unclear risk | Reasons were provided for the 25 withdrawal/ineligible participants who agreed to join, but did not form part of the group analysed, but there was no indication of the distribution between control and intervention. |
| Blinding of outcome assessment (detection bias) Outcome 1 | Low risk | The outcome was objective. |
| Contamination protection (contamination bias) | Unclear risk | Quote, pg. 3: "physicians living in the same village or town were stratified into the control or intervention groups." From this quote it is UNCLEAR if a clustered approach was used to randomise participants. |
| Selective reporting (reporting bias) Outcome 1 | Low risk | All relevant outcomes in the methods section were reported in the results section. |
| Other bias | Low risk | There was no evidence of other risks of bias. |
Dickinson 2003.
| Study characteristics | ||
| Methods | Study design: RT Unit of allocation: Patients Stratification by criteria of somatization disorders Type of comparison: PEM only vs. usual care. We considered groups A and B in this review:
|
|
| Participants | Physicians Clinical specialty: General practice/family medicine Level of training: Fully trained Setting/country: Famiy practice/US |
|
| Interventions | The PEM was a letter of recommendation on the identification of patients with somatisation and their appropriate care for primary care physicians. Key components of the letter included notification that the patient met criteria for somatisation; reassurance regarding the non‐lethal course of somatisation; recommendations that the patient be regularly scheduled for brief appointments with the primary care physician and that urgent appointments be avoided as much as possible; recommendation that the physician look closely for signs of disease rather than taking the patient's symptoms at face value; suggestion that hospitalisations, surgery, or diagnostic procedures be avoided unless indicated by physical abnormalities; recommendation that the physician view the symptoms as part of an unconscious process rather than telling the patient that the problem is "all in your head".. | |
| Outcomes | 2 patient health outcomes: Outcome 1: Emotional functioning subscale (MCS) subscale of the functional status (SF‐36) scale Outcome 2: Physical functioning (PCS) subscale of the functional status (SF‐36) Scale |
|
| Notes | Funding: Information on funding was not available. | |
| Risk of bias | ||
| Bias | Authors' judgement | Support for judgement |
| Random sequence generation (selection bias) | Unclear risk | The authors did not mention the method used for randomisation. |
| Allocation concealment (selection bias) | Unclear risk | No information was provided to assess this risk. |
| Baseline characteristics similar (selection bias) | Low risk | The experimental groups seemed to be comparable at baseline (Table 1). QUOTE (p. 232): "There were no significant differences between patients assigned lo the intervention groups and usual care at baseline with respect to age, race, sex, social class, physical comorbidity, psychiatric comorbidity, or physical or emotional functioning for the total sample of somatizing patients or within any of the 3 diagnostic categories". |
| Baseline outcome similar Outcome 1 (outcome description in table above) | Low risk | QUOTE (p. 232): "There were no significant differences between patients assigned lo the intervention groups and usual care at baseline with respect to [...] emotional functioning for the total sample of somatizing patients or within any of the 3 diagnostic categories". |
| Incomplete outcome data (attrition bias) Outcome 1 | Low risk | QUOTE (p. 232): "Follow‐up rates were 80.5% at 12 months and 60.5% at 24 months. Analysis of missing versus non missing subjects, performed at I2 and 24 months for the entire sample of 188 somatizers, indicated no significant differences on baseline sociodemographic or clinical covariates (Table 2). Although there was a tendency for 24‐month dropouts to have slightly lower baseline MCS scores, the assumption of "missing at random" (ignorable missingness) was not violated." |
| Blinding of outcome assessment (detection bias) Outcome 1 | Low risk | Quote: "Follow‐up assessments of functional status were carried out by telephone interviewers unaware of the intervention condition at 12 and 24 months" (Instruments and measures' section). |
| Contamination protection (contamination bias) | High risk | Quote: "Controlled, single‐crossover trial, patients were randomized to have their primary care physician receive the CR letter either immediately following enrollment or 12 months after enrollment". Comment: It is possible that communication between intervention and control professionals could have occurred. |
| Selective reporting (reporting bias) Outcome 1 | Low risk | Outcome reporting consistent with methods |
| Other bias | Low risk | There was no evidence of other risk of biases. |
Dormuth 2004.
| Study characteristics | ||
| Methods | Study design: C‐RT Unit of allocation: health areas Stratification by: number of physicians per area Type of comparison: PEM only vs. nothing
|
|
| Participants | Physicians Clinical speciality: general practice/family medicine Level of training: fully trained Setting/country: not clear/Canada |
|
| Interventions | The PEM consisted of 12 issues of Therapeutics Letter distributed between October 1994 and December 1997. Therapeutics Letter is a 2‐ to 4‐page colour‐printed bulletin mailed to most practicing physicians in British Columbia. It is published by the Therapeutics Initiative of the University of British Columbia. The letters included were those that had a clear message which could be predicted to result in a change in prescribing behaviour. | |
| Outcomes | 12 healthcare professionals' practice outcomes:
|
|
| Notes | ES not computable
No intervention: increase of 10% in the number of patients with prescriptions
PEM: decrease of 15% in the number of patients with prescriptions Funding: pg. 1060: Therapeutics Initiative, which is based in the Department of Pharmacology and Therapeutics, University of British Columbia, is funded by a 5‐year renewable grant from the British Columbia Ministry of Health Services. |
|
| Risk of bias | ||
| Bias | Authors' judgement | Support for judgement |
| Random sequence generation (selection bias) | Low risk | Quote, p. 1058: "one local health area in each pair was randomly selected and assigned (blindly by M.M. using the RAND function on Excel) to be in the control group". |
| Allocation concealment (selection bias) | Low risk | Quote, p. 1058: "one local health area in each pair was randomly selected and assigned (blindly by M.M. using the RAND function in Excel) to be in the control group". |
| Baseline characteristics similar (selection bias) | Low risk | Quote, p. 1059: "characteristics of the intervention and control physicians in 1991 are displayed in Table 2. The physicians and their patient populations were well balanced for these characteristics." TABLE 2, pg. 1058: "shows physician characteristics in 1994. Characteristics measured are percentage of general practitioners, mean age in years, percentage of men, mean number of visits from patients aged 66 years or more, mean age in years of patients aged 66 years or more and percentage of men/women/sex unknown of patients aged 66 years or more". COMMENT: the baseline characteristics of the intervention and control groups were reported and similar. |
| Baseline outcome similar Outcome 1 (outcome description in table above) | Low risk | Based on the large total number of prescriptions, baseline outcomes for the number of newly treated patients were similar across groups. |
| Incomplete outcome data (attrition bias) Outcome 1 | Unclear risk | Quote, p. 1058: "no requests to be excluded were received". COMMENT: the study did not specifically report on all physicians randomised by area at the beginning of the study that remained in the prescribing database throughout the study. Perhaps physicians retired, moved to a new area, or died. |
| Blinding of outcome assessment (detection bias) Outcome 1 | Low risk | The outcome was objective. |
| Contamination protection (contamination bias) | Low risk | Quote, pg. 1058: "the intervention and control groups were created by grouping an approximate 10% sample of prescribing physicians in 24 local health areas in a paired, cluster randomized design into 12 pairs based on the number of physicians in each area." such that all physicians within 1 local health area would be clustered. |
| Selective reporting (reporting bias) Outcome 1 | Low risk | All relevant outcomes in the methods section were reported in the results section. |
| Other bias | Low risk | There was no evidence of other risks of bias. |
Dubey 2006.
| Study characteristics | ||
| Methods | Study design: C‐RT Unit of allocation: Practices Stratification by clinic size Type of comparison: PEM only vs. nothing. We considered the groups A and B in this review:
|
|
| Participants | Physicians Clinical specialty: Family physicians Level of training: Unclear Setting/country: Academic family practices/Canada |
|
| Interventions | The PEM used in the article was an evidence‐based Preventive Care Checklist Form©, with male and female versions, developed using the Canadian Task Force on Preventive Health Care Recommendations and other sources where the Task Force had no up‐to‐date guidelines. Grade A (good evidence to include) or B (fair evidence to include) recommendations were delineated by bold and italics text, respectively. Non‐evidence‐based but practice‐relevant components including functional inquiry and general physical examination were added. Male and female forms were photocopied on blue and pink paper respectively. An explanation sheet detailing the recommendations accompanied the form. Pilot testing had been previously conducted on 10 unaffiliated family physicians. | |
| Outcomes | 1 healthcare professionals' practice outcome: Outcome 1: Percentage of up‐to‐date preventive health services delivered per patient between the two groups (rates of the thirteen preventive maneouvers) |
|
| Notes | Funding: Information on funding was not available. | |
| Risk of bias | ||
| Bias | Authors' judgement | Support for judgement |
| Random sequence generation (selection bias) | Low risk | Quote: "Clinics were randomized using a random number table" (p.3, methods). |
| Allocation concealment (selection bias) | Unclear risk | QUOTE (p.3): "Stratified randomization by clinic size was used since two of the four clinics are large and the other two smaller and community‐based. Clinics were randomized using a random number table. CONSORT guidelines for cluster randomized controlled trials were adhered to." Comment: The statement about the CONSORT guidelines was too vague. |
| Baseline characteristics similar (selection bias) | Low risk | QUOTE (p.4): "Compared with the control arm, the intervention arm had a higher proportion of female patients, less comorbidity, fewer patients with a mental health diagnosis and physicians were somewhat older, in practice longer and had more health check‐ups per patient visit. Baseline data on education, occupation, income, language and ethnicity were not included because of poor chart documentation." Comment: At baseline, groups were different but the authors used an appropriate statistical tool to control for confounding variables: Adjusted odds ratios were calculated in a separate model for each maneouver using Poisson regression with log link, controlling for cluster randomisation, pre‐intervention rate of the maneouver for that group, the number of years in practice of the physician, average proportion of patients seen per half‐day, average number of visits per patient, Charlson comorbidity scale, and mental health diagnosis. The Charlson comorbidity scale and mental health diagnosis together were used as a proxy of patient complexity and comorbidity in this ambulatory care setting. |
| Baseline outcome similar Outcome 1 (outcome description in table above) | Low risk | Quote: "Before the intervention, each patient received on average 51.8% of maneouvers in the control group and 51.4% in the intervention group (P = 0.81)" (p. 6, results). |
| Incomplete outcome data (attrition bias) Outcome 1 | Low risk | Comment: Reasons behind the absence of some charts were unclear but each group had less than 10% of missing data for outcome assessment (Figure I, pg. 5). |
| Blinding of outcome assessment (detection bias) Outcome 1 | Low risk | Quote: "Chart abstractors were graduate students in epidemiology, trained using standard methods. Abstractors were blinded in the period before the intervention. The presence of the form precluded blinding in the post‐intervention period. |
| Contamination protection (contamination bias) | Low risk | Randomisation at practice level and... QUOTE (pg. 3): "In the intervention clinics, physicians, nurses and clerical staff were informed at staff meetings, by email and in person that Preventive Care Checklist Forms© were available. They were not aware that the forms were part of a study or if the forms were to be evaluated." |
| Selective reporting (reporting bias) Outcome 1 | Low risk | Outcome reporting consistent with methods |
| Other bias | Low risk | There was no evidence of other risk of bias. |
Evans 1986.
| Study characteristics | ||
| Methods | Study design: C‐RT Unit of allocation: Practices Stratification by solo or group practice Type of comparison: PEM only vs. nothing. We considered the groups A and B in this review:
|
|
| Participants | Physicians Clinical specialty: General practice/family medicine Level of training: Unclear Setting/country: Family practices/Canada |
|
| Interventions | The PEM evaluated consisted of a mailed continuing education programme for primary care practitioners concerning the management of hypertension. It comprised 14 weekly instalments of practice‐oriented information, which were designed to be read in three to five minutes each. They covered the diagnosis, workup, therapy, and follow‐up of hypertensive patients, and emphasised the problems of inadequate medication prescriptions and low patient adherence. Practical, behaviour‐oriented strategies for overcoming these problems were outlined. In addition to didactic materials, the package contained office aids, including workup and management charts, chart stickers to increase the visibility of hypertension surveillance and the success of antihypertensive care, and a follow‐up appointment system to encourage detection and recall of patients who missed clinic appointments. The PEM was developed according to 8 principles:
|
|
| Outcomes | 3 patient health outcomes + 8 healthcare professionals' practice outcomes: Outcome 1: Patient compliance with medication by pills count Outcome 2: Control of hypertension: % of patients with minimum DBP < 99 mm Hg (Table 3) Outcome 3: Control of hypertension HDFP criteria (Table 3), (% of patients on hypertension detection and follow‐up programme) Outcome 4: Percentage of patients with mean DBP < 90 mm Hg Outome 5: Mean systolic pressure (mm Hg) change (decrease) by practices Outcome 6: Mean diastolic pressure (mm Hg) change (decrease) by practices Outcome 7: Effect of the intervention on physicians practices (% of patients with blood pressure check) Outcome 8: Percentage of patients on BP medication Outcome 9: Effect of the intervention on physicians practices (% of patients told blood pressure elevated) Outcome 10: Effect of the intervention on physicians practices (mean number of tablets/day prescribed) Outcome 11: Knowledge score of hypertension through multiple‐choice questionnaire |
|
| Notes | Funding: pg.858: Institutional, professional, organisational, and charity funds were received in support of this work. "No benefits in any form have been or will be received from a commercial party related directly or indirectly to the subject of this manuscript." | |
| Risk of bias | ||
| Bias | Authors' judgement | Support for judgement |
| Random sequence generation (selection bias) | Unclear risk | QUOTE (p. 501): “The study was conducted in two parts: a population blood pressure survey and a randomized trial (Figure). […] Hypertensive patients were recruited through a household survey of homes selected by random process such that each eligible adult in the two communities had an equal probability of being selected.” |
| Allocation concealment (selection bias) | Unclear risk | QUOTE (p. 501): “Within each city, physicians were stratified according to solo or group practice, then randomly allocated within these strata to the study or control group, keeping practice groups together.” |
| Baseline characteristics similar (selection bias) | Unclear risk | Comment: Information was provided in the text but no table was provided. QUOTE (p. 502): “The study and control group physicians were well matched, with no statistically significant differences on baseline characteristics, including years since graduation, graduation from Canadian or foreign medical schools, postgraduate training, number of physicians per practice, and number of participating patients per physician.” |
| Baseline outcome similar Outcome 1 (outcome description in table above) | Unclear risk | Comment: Insufficient information to make assessment QUOTE (p. 501): “Blood pressures were measured by standard mercury sphygmomanometers on initial screening visits and Hawksley's random‐zero mercury sphygmomanometers' thereafter. A blood pressure was taken at the beginning of the visit to familiarize the subject with the procedure, and at the end of the interview, after at least five minutes' rest, three readings (each separated by at least 30 sec.) were taken with the subject in the sitting position. First‐ and fifth‐phase Korotkoff's sounds were used for systolic and diastolic pressure, respectively.” |
| Incomplete outcome data (attrition bias) Outcome 1 | Low risk | QUOTE (p. 502‐3): “Of 107 eligible patients who were referred to study group physicians, five (4.7%) were lost to follow‐up while ten (11%) of 91 control patients were lost. Reasons for loss to follow up include moving from the region (five), death (one), and refusal at the time of follow‐up (nine). The patients who completed the study were comparable on key baseline features, including age, gender, education, employment, previous knowledge of hypertension, and previous and current antihypertensive therapy. […] There were also no statistically significant differences in comparing baseline features of patients who did and did not complete the study.” |
| Blinding of outcome assessment (detection bias) Outcome 1 | Low risk | Comment: Objective method to assess compliance QUOTE (p. 502): “At the end of the study, after a telephone call on the intended day of the visit, patients were visited on only one occasion; it was felt that the visit could affect subsequent medication compliance, altering the validity of further follow‐up assessments. A questionnaire was administered and medication compliance was assessed by pill counts, using a method employed in a previous study.” |
| Contamination protection (contamination bias) | Low risk | QUOTE pg.501: "To reduce the possibility of "contamination" (with members of the control group receiving part or all of the intervention), physician practice groups were the units of randomization." |
| Selective reporting (reporting bias) Outcome 1 | Low risk | Comment: Outcome reporting consistent with methods |
| Other bias | Low risk | There was no evidence of other source of bias. |
Fijn 2000.
| Study characteristics | ||
| Methods | Study design: ITS | |
| Participants | Physicians Clinical speciality: general practice/family medicine Level of training: fully trained Setting/country: not clear/The Netherlands |
|
| Interventions | The PEM consisted of revised, independent Dutch national recommendations on antithrombotic prophylaxis of IHD that were introduced in 1996. Two peer‐reviewed clinical practice guidelines were issued: one by the Dutch Institute for Healthcare Improvement, a national scientific authority representing hospital specialists, and one by the Dutch Scientific Society of General Practitioners. At the same time, identical recommendations were presented by the Dutch Drug Bulletin Institute and the Health Insurance Fund Council. All of these recommend additional prophylactic antithrombotic therapy, preferably thrombocyte aggregation inhibitors, to existing rescue or maintenance therapy, or both, for acute and chronic IHD. | |
| Outcomes | 1 healthcare professionals' practice outcome: proportion of patients newly prescribed antithrombotic therapy after having a diagnosis of Ischaemic heart disease | |
| Notes | We could not recover any data from this study. Funding: Information on funding was not available. |
|
| Risk of bias | ||
| Bias | Authors' judgement | Support for judgement |
| Intervention independent of other changes ‐ ITS | Unclear risk | No information was provided to assess this risk. |
| Shape of Intervention effect pre‐specified ‐ ITS | Unclear risk | Quote, pg. 740: "All of these recommend additional prophylactic antithrombotic therapy, preferably thrombocyte aggregation inhibitors, to existing rescue and/or maintenance therapy for acute and chronic IHD." "this research will evaluate antithrombotic prescribing in newly diagnosed IHD patients in general practice". |
| Intervention unlikely to affect data collection ‐ ITS | Low risk | The intervention did not affect the source (community pharmacies in the InterAction working group) or the method of data collection. |
| Blinding of outcome assessors (detection bias) ‐ ITS All outcomes | Low risk | The outcome was objective. |
| Incomplete outcome data (attrition bias) ‐ ITS All outcomes | Low risk | The complete databases from 10 pharmacies were used. |
| Selective reporting (reporting bias) ‐ ITS | Low risk | All relevant outcomes in the methods section were reported in the results section. |
| Other bias ‐ ITS | Low risk | There was no evidence of other risks of bias. |
Fonarow 2009.
| Study characteristics | ||
| Methods | Study design: ITS | |
| Participants | Physicians Clinical speciality: not clear Level of training: fully trained Setting/country: hospital/inpatient/US |
|
| Interventions | The 4 PEMs consisted of 2 published studies and 2 guidelines: 1) 4 April 2001 publication on the effects of statins on early event reduction in ACS (MIRACL); 2) 22 March 2002, AHA/ACC Unstable Angina/Non‐STEMI guidelines recommending lipid‐lowering therapy before discharge in UA/non‐STEMI patients (ACC‐AHA‐NS); 3) 8 March 2004, publication on the superiority of high‐dose statins = in ACS compared to standard‐dose statins (PROVE IT‐TIMI 22); and 4) 4 August 2004, AHA/ACC STEMI guidelines recommending lipid‐lowering therapy before discharge in patients with STEMI (ACC‐AHA‐STEMI) | |
| Outcomes | 3 healthcare professionals' practice outcomes:
|
|
| Notes | Model fit was questionable for the following outcomes: ‐ Rate (%) of lipid lowering agent use pre and post‐PROVE IT‐TIMI 22 ‐ Rate (%) of lipid lowering agent use pre and post‐ACC AHA STEMI guideline Funding: pg. 185: This research was supported by a grant provided by Pfizer. Genentech Inc. provided access to the NRMI data. None of the above sponsors had any role in the design and conduct of the study, the management, analysis and interpretation of the data, or the preparation and revision of the manuscript. Both Genentech and Pfizer were allowed to review the manuscript before submission. |
|
| Risk of bias | ||
| Bias | Authors' judgement | Support for judgement |
| Intervention independent of other changes ‐ ITS | Unclear risk | No information was provided to assess this risk. |
| Shape of Intervention effect pre‐specified ‐ ITS | Unclear risk | Quote, pg. 186: "it has not been well studied to what extent utilization of lipid lowering medications in patients with AMI has changed in response to more recent published clinical trial evidence and updates to national guidelines. In this study, the National Registry for Myocardial Infarction (NRMI) 3, 4, and 5 was used to examine national trends in the use of lipid‐lowering medications at discharge in patients hospitalized for AMI from 1998 to 2006". |
| Intervention unlikely to affect data collection ‐ ITS | Low risk | The interventions (MIRACL, ACC/AHA NSTEMI guideline, PROVE IT‐TIMI 22, ACC/AHA STEMI guideline) did not affect either the source or method of data collection. |
| Blinding of outcome assessors (detection bias) ‐ ITS All outcomes | Low risk | Outcome was objective. |
| Incomplete outcome data (attrition bias) ‐ ITS All outcomes | Low risk | National registries were used all along the study. |
| Selective reporting (reporting bias) ‐ ITS | Low risk | All relevant outcomes in the methods section were reported in the results section. |
| Other bias ‐ ITS | Low risk | There was no evidence of other risks of bias. |
Fukuda 2009.
| Study characteristics | ||
| Methods | Study design: ITS | |
| Participants | Physicians Clinical speciality: surgery Level of training: fully trained Setting/country: hospital/inpatient/Japan |
|
| Interventions | The PEM consisted of evidence‐based clinical practice guidelines published in July 1999 for treatment of early‐stage breast cancer in Japanese women. The guidelines recommended breast‐conserving surgery followed by radiotherapy for the majority of women with Stage I or II breast cancer. | |
| Outcomes | One healthcare professionals' practice outcome: rate of use of breast‐conserving surgery (adjusted odds ratios of receiving breast‐conserving surgery in patients with breast cancer) | |
| Notes | We could not recover any data from this study. Funding: pg. 377: The work described in this article was funded in part by the Health Sciences Research Grants for the Research on Policy Planning and Evaluation from the Ministry of Health, Labor and Welfare of Japan and the Grant‐in‐aid for Scientific Research A from the Ministry of Education, Culture, Sports, Science and Technology of Japan. |
|
| Risk of bias | ||
| Bias | Authors' judgement | Support for judgement |
| Intervention independent of other changes ‐ ITS | Low risk | Quote, pg. 373: "because of language barriers, several large clinical trials published in Western countries seemed to have less impact on knowledge of the effectiveness of BCS in Japan compared with the impact in English‐speaking countries. Before the publication of the Japanese guideline, therefore, it was possible that Japanese women might be unaware of this treatment choice". COMMENT: the authors made an argument that a language barrier (Japanese/English) may result in limited passive dissemination from other countries. |
| Shape of Intervention effect pre‐specified ‐ ITS | Unclear risk | No information was provided to assess this risk. |
| Intervention unlikely to affect data collection ‐ ITS | Low risk | The intervention (evidence‐based clinical practice guidelines) did not affect either the source or method of data collection. |
| Blinding of outcome assessors (detection bias) ‐ ITS All outcomes | Low risk | The outcome was objective. |
| Incomplete outcome data (attrition bias) ‐ ITS All outcomes | Low risk | The complete database of 10 teaching hospitals in Japan was used for the study. |
| Selective reporting (reporting bias) ‐ ITS | Low risk | All relevant outcomes in the methods section were reported in the results section. |
| Other bias ‐ ITS | Low risk | There was no evidence of other risks of bias. |
Fukuda 2018.
| Study characteristics | ||
| Methods | Study design: C‐RT
Unity of allocation: other (residential aged care facilities)
Allocation stratified by: other (18 facilities participated in this research, including six group homes, eight long‐term care health facilities and four nursing homes. Group allocation was by quasi‐randomisation, with facilities being allocated to the intervention group and the control group in turn for every institutional subclassification). Type of comparison: 2 study groups: PEMs vs. no intervention Group A: Standard care without the intervention (control group) Group B: Educational programme using printed educational material (Guidelines for Initial Coping with behavioural and psychological symptoms of dementia or BPSD) Follow up: 1 month |
|
| Participants | Allied health professionals (including interns): staff of residential aged care facilities without medical specialists and/or registered nurses Clinical speciality: no speciality, staff of residential aged care facilities Level of training: fully trained Settings/country: residential aged care facilities/Japan |
|
| Interventions | The intervention was an educational programme using PEM (Guidelines for Initial Coping with BPSD) for the care staff at baseline. The programme was divided into two sections. Section 1 was composed of a 30‐min educational lecture providing an overview and covering the basic principles of BPSD. Section 2 consisted of a thorough, 90‐min explanation of the proper way to use the Guidelines when BPSD occurred at a care facility. All staff members working at the facilities in the intervention group were invited to participate. An appropriate number of copies of the Guidelines was provided to each facility based on the number of staff members participating. Trainers thoroughly introduced the method of using the Guidelines to the care staff. The Guidelines were edited by the research team and published in 2012 in Japanese. All 11 authors of this book were medical specialists or registered nurses. The Guidelines covered 27 representative symptoms of BPSD, including hallucination, delusion, agitation, violent behavior, wandering, pica, depression and insomnia, item by item. Each author was in charge of addressing several symptoms in the Guidelines. Every author was required to present evidence of as high a quality as possible regarding the areas of which they were in charge. The manuscripts were assembled and revised by the main editor. The Guidelines were designed to be easily used by staff working at care facilities. The factors that could form the background of each symptom were summarised in a table. A flow chart was prepared to illustrate each specific coping method. | |
| Outcomes | One caregiver outcome: distress induced by behavioural and psychological symptoms of dementia | |
| Notes | Funding: pg. 493:This work was funded by the Research Funding for Longevity Sciences from the National Center for Geriatrics & Gerontology (Obu, Aichi, Japan) number: 25‐1, 2013 to H Hatori. | |
| Risk of bias | ||
| Bias | Authors' judgement | Support for judgement |
| Random sequence generation (selection bias) | High risk | Quote, pg. 488: "cluster quasi randomized, clinically controlled comparative trial" COMMENT: The authors mentioned using quasi‐randomisation, but the randomisation process was not described. |
| Allocation concealment (selection bias) | High risk | Quote, pg. 488: "Group allocation was by quasi‐randomization, with facilities being allocated to the intervention group and the control group in turn for every institutional subclassification." |
| Baseline characteristics similar (selection bias) | Low risk | Quote, pg. 491: "There were no significant differences between the intervention group and control group with regard to age, sex, length of service." COMMENT: No comments |
| Baseline outcome similar Outcome 1 (outcome description in table above) | Low risk | Quote, pg. 491: "There were no significant differences between the intervention group and control group with regard to (…) total NPI‐Q score". COMMENT: No comments |
| Incomplete outcome data (attrition bias) Outcome 1 | Low risk | Quote, pg. 490: "From baseline to end‐point, there were 29 missing data points (14%) in the intervention group and 14 (7.5%) in the control group. The rate of missing data in the intervention group was higher than that in the control group, although the difference was not statistically significant (χ2‐test; P = 0.05)." COMMENT: Missing data were unlikely to bias the results: the difference was not statistically significant between the groups and regarding the effectiveness analysis, an intention‐to‐treat approach at the individual level was carried out with the imputation of missing data for primary outcomes. |
| Blinding of outcome assessment (detection bias) Outcome 1 | Unclear risk | No information was provided to assess this risk. |
| Contamination protection (contamination bias) | Unclear risk | Quote, pg. 488: "The facilities were selected from two prefectures 330 km apart from each other (Aichi and Okayama prefectures)." |
| Selective reporting (reporting bias) Outcome 1 | Low risk | COMMENT: Relevant outcomes in the method were reported in the the results. |
| Other bias | Unclear risk | COMMENT: Possible evidence of other bias as the authors did not take into account the clusters in the analyses |
Guadagnoli 2004.
| Study characteristics | ||
| Methods | Study design: RT Unit of allocation: Physicians Type of comparison: PEM only vs. nothing. We considered the groups A and B in this review:
|
|
| Participants | Physicians Clinical specialty: General practice/family medicine Level of training: Fully‐trained Setting/country: Family practices/US |
|
| Interventions | The PEM consisted of a letter sent to the primary care physician following the patient’s discharge from the hospital, in addition to a condition‐specific card that listed each treatment recommendation, the clinical rationale, and associated references. The letter, which was signed by the Associate Medical Director of the health plan or by a cardiology specialist from each hospital associated with the quality improvement organisation, mentioned the patient by name, indicated that the patient was recently discharged from the hospital with a diagnosis of myocardial infarction or heart failure, and suggested that the physician follow any recommendations that were applicable to the patient. From health plans and clinical and health services, researchers selected the recommendations deemed most useful for quality improvement. | |
| Outcomes | 16 healthcare professionals' practice outcomes: Outcome 1: Conformance with guideline recommendations regarding acute myocardial infarction ‐ Proportion of patients who were prescribed ACE inhibitors Outcome 2: Conformance with guideline recommendations regarding acute myocardial infarction ‐ Proportion of patients who were prescribed beta‐blockers Outcome 3: Conformance with guideline recommendations regarding acute myocardial infarction ‐ Proportion of patients who were prescribed daily aspirin Outcome 4: Conformance with guideline recommendations regarding acute myocardial infarction ‐ Proportion of patients who were tested for cholesterol Outcome 5: Conformance with guideline recommendations regarding acute myocardial infarction ‐ Proportion of patients for whom left ventricular ejection fraction was determined Outcome 6: Conformance with guideline recommendations regarding acute myocardial infarction ‐ Proportion of patients assessed for depression Outcome 7: Conformance with guideline recommendations regarding acute myocardial infarction ‐ Proportion of patients who received advice for smoking cessation Outcome 8: Conformance with guideline recommendations regarding heart failure ‐ Proportion of patients who were prescribed ACE inhibitors Outcome 9: Conformance with guideline recommendations regarding heart failure ‐ Proportion of patients who were prescribed target ACE inhibitors Outcome 10: Conformance with guideline recommendations regarding heart failure ‐ Proportion of patients who were prescribed beta‐blockers Outcome 11: Conformance with guideline recommendations regarding heart failure ‐ Proportion of patients for whom left ventricular ejection was determined Outcome 12: Conformance with guideline recommendations regarding heart failure ‐ Proportion of patients for whom serum potassium levels were measured Outcome 13: Conformance with guideline recommendations regarding heart failure ‐ Proportion of patients for whom serum creatinine levels were measured Outcome 14: Conformance with guideline recommendations regarding heart failure ‐ Proportion of patients whose weight was assessed Outcome 15: Conformance with guideline recommendations regarding heart failure ‐ Proportion of patients assessed for peripheral oedema Outcome 16: Conformance with guideline recommendations regarding heart failure ‐ Proportion of patients advised to restrict salt intake |
|
| Notes | Funding: Information on funding was not available. | |
| Risk of bias | ||
| Bias | Authors' judgement | Support for judgement |
| Random sequence generation (selection bias) | Low risk | QUOTE (p. 372): "We used a computerized random‐number generator to assign each physician to either the intervention or control arm". |
| Allocation concealment (selection bias) | High risk | Comment: It was unclear if investigators/assessors were aware of the allocation. Authors mentioned that they had the list of participants with their assigned group but were the lists placed in a sealed envelope or somehow inaccessible to assessors? Wouldn't the authors have mentioned it if the allocation was concealed in this situation? QUOTE (p. 372): "Prior to the start of the study, each site provided a list of potential primary care physicians to the investigators. We used a computerized random‐number generator to assign each physician to either the intervention or control arm and returned the list of physicians with their group assignment to each site." |
| Baseline characteristics similar (selection bias) | Low risk | Most relevant factors examined were equally distributed in both groups. But the authors mentioned a particular factor not equally distributed between groups. The extent of the influence of this factor on results is UNCLEAR. QUOTE (p. 375): “For both conditions, patients cared for by physicians assigned to the intervention group were similar to those cared for by physicians assigned to the control group in terms of age, sex, race, or treatment by a cardiologist (Table 3).” BUT… “For patients with myocardial infarction, those assigned to physicians in the intervention group were less likely to have second‐ or third‐degree heart block (P = 0.01) or a recent gastrointestinal bleed (P = 0.03) than those assigned to physicians in the control group.” Nevertheless… “Patients with heart failure assigned to the intervention or control physician groups had similar clinical characteristics.” AND STATISTICAL ADJUSTEMENTS WERE DONE (p. 371) "After adjusting for demographic and clinical characteristics of patients, and the number of eligible measures per patient..." |
| Baseline outcome similar Outcome 1 (outcome description in table above) | Low risk | Comment: Appropriate statistical adjustments were done. QUOTE (p. 371): "After adjusting for demographic and clinical characteristics of patients, and the number of eligible measures per patient..." |
| Incomplete outcome data (attrition bias) Outcome 1 | Unclear risk | Comment: Potential eligible participants not included Quote: “Of the 619 patients with myocardial infarction, 110 were excluded for the following reasons: [...] unable to obtain medical chart from the primary care physician (n = 76), and unable to determine age (n = 3)”. Comment: We are not sure if all included participants were considered for this outcome. |
| Blinding of outcome assessment (detection bias) Outcome 1 | Low risk | The outcome was objective. |
| Contamination protection (contamination bias) | Unclear risk | Comment: No information to assess whether or not contamination was possible was provided. |
| Selective reporting (reporting bias) Outcome 1 | Low risk | Outcome reporting consistent with methods |
| Other bias | Unclear risk | There was no evidence of other source of bias. |
Guay 2007.
| Study characteristics | ||
| Methods | Study design: ITS | |
| Participants | Physicians Clinical speciality: not clear Level of training: fully trained Setting/country: outpatient (e.g. ambulatory care provided by hospitals/specialists)/Canada |
|
| Interventions | The PEM was the WHI trial published on 17 July 2002, which concluded that overall health risks exceeded benefits from use of combined oestrogen plus progestin among healthy postmenopausal women. | |
| Outcomes | 1 healthcare professionals' practice outcome: total number of HRT prescriptions dispensed per month | |
| Notes | Funding: pg. 26: The corresponding author (Sylvie Perreault) and one co‐author (Danielle Pilon) were research scholars receiving financial support from the Fonds de la Recherche en Santé du Québec. | |
| Risk of bias | ||
| Bias | Authors' judgement | Support for judgement |
| Intervention independent of other changes ‐ ITS | Unclear risk | No information was provided to assess this risk. |
| Shape of Intervention effect pre‐specified ‐ ITS | Low risk | Quote, pg. 18: "from this perspective, the aim of our study is to evaluate the impact of the publication of the WHI study in the Quebecers population, and to estimate if the use of HRT did indeed change in accordance with the new guidelines". |
| Intervention unlikely to affect data collection ‐ ITS | Low risk | The intervention (WHI study) did not affect either the source or method of data collection. |
| Blinding of outcome assessors (detection bias) ‐ ITS All outcomes | Low risk | The outcome was objective. |
| Incomplete outcome data (attrition bias) ‐ ITS All outcomes | Low risk | The authors provided a thorough description of the proportions of patients removed from analysis by inclusion and exclusion criteria. There was a 10% difference between loss to follow‐up in the pre‐WHI cohort (39% loss) and the post‐WHI cohort (49%), and the reasons for loss were similar. The cohorts were considerably different in absolute size, but this was attributable to the large difference in the time‐frame (16,560 patients, 3 years in pre‐WHI vs. 2067 women in 9 months post‐WHI). |
| Selective reporting (reporting bias) ‐ ITS | Low risk | All relevant outcomes in the methods section were reported in the results section. |
| Other bias ‐ ITS | Low risk | There was no evidence of other risks of bias. |
Haas 2004.
| Study characteristics | ||
| Methods | Study design: ITS | |
| Participants | Physicians Clinical speciality: not clear Level of training: fully trained Setting/country: outpatient (e.g. ambulatory care provided by hospitals/specialists)/US |
|
| Interventions | 2 PEMs were studied in this report: 1) the HERS published in 1998, and 2) the WHI published on 17 July 2002. These clinical trials demonstrated that the risks associated with hormone therapy outweighed the benefits for women on continuous oestrogen and progestin regimens. | |
| Outcomes | 2 healthcare professionals' practice outcomes:
|
|
| Notes | Funding: pg. 187: Grant Support: By a National Cancer Institute–funded Breast Cancer Surveillance Consortium cooperative agreement (U01CA63740) | |
| Risk of bias | ||
| Bias | Authors' judgement | Support for judgement |
| Intervention independent of other changes ‐ ITS | Unclear risk | No information was provided to assess this risk. |
| Shape of Intervention effect pre‐specified ‐ ITS | Low risk | Quote, pg. 184: "we designed our analysis to examine whether the use of hormone therapy has changed among postmenopausal women as a result of the publication of the results from HERS and the WHI. We were also interested in examining whether patterns of use differ by patient characteristics. Because HERS examined the outcomes of older women, we hypothesized that there would be earlier and more substantial declines in hormone therapy use among this group. We also expected that there would be variation in use by race or ethnicity because white women may have better access to new information. Finally, because the WHI study results were specific to women taking continuous estrogen plus progestin, we hypothesized that hormone use would be more stable among women who had had hysterectomies because such women typically take only estrogen and may believe that the findings do not apply to them". |
| Intervention unlikely to affect data collection ‐ ITS | Low risk | The interventions (HERS study; WHI study) did not affect either the source or method of data collection. |
| Blinding of outcome assessors (detection bias) ‐ ITS All outcomes | Low risk | The outcome was objective. |
| Incomplete outcome data (attrition bias) ‐ ITS All outcomes | Low risk | The San Francisco mammography registry was used. |
| Selective reporting (reporting bias) ‐ ITS | Low risk | All relevant outcomes in the methods section were reported in the results section. |
| Other bias ‐ ITS | Low risk | There was no evidence of other risks of bias. |
Hawley 2018.
| Study characteristics | ||
| Methods | Study design: ITS | |
| Participants | Physicians (including residents) Clinical speciality: rheumatology Level of training: fully trained Settings/country: outpatient setting (ambulatory care provided by hospitals/specialists)/England and Wales |
|
| Interventions | The PEM consisted of the publication of the NICE technology appraisal (TA) 36 in March 2002. This provided guidance on the use of TNFi (etanercept and infliximab) for the treatment of RA, and stated that these therapies were recommended options for the treatment of adults with severe RA (Disease Activity Score (DAS) > 5.1) who had already failed to respond to two conventional synthetic disease modifying anti‐rheumatic drug (csDMARD) therapies. | |
| Outcomes | Two patient outcomes: (1) 5‐year incidence rate of total hip replacement after incident RA diagnosis (2) 5‐year incidence rate of total knee replacement after incident RA diagnosis |
|
| Notes | The PEM purpose was prescription of drugs for arthritis, but in the paper, authors evaluated the number of knee and hip surgical operations (this looked like an indirect measurement of the PEM effect). Funding: pg. 8: The corresponding author (Daniel Prieto‐Alhambra) was funded by a National Institute for Health Research Clinician Scientist award (CS‐2013‐13‐012). This article presents independent research funded by the National Institute for Health Research (NIHR). |
|
| Risk of bias | ||
| Bias | Authors' judgement | Support for judgement |
| Intervention independent of other changes ‐ ITS | High risk | Quote, pg. 7: "Furthermore, in evaluating the impact of NICE guidance on biologics, we cannot rule out other factors such as prescription rates of csDMARDs having markedly increased within this population, which may have contributed to a reduced need for joint replacement.. Improvement in non‐therapeutic aspects of RA management and increased awareness may likewise have played a role, as may have a gradually declining disease severity or changes in smoking prevalence or BMI, although we consider these reasons insufficient to explain the relatively sudden inflection observed in the TKR trend following NICE recommendations". |
| Shape of Intervention effect pre‐specified ‐ ITS | High risk | COMMENT: retrospective |
| Intervention unlikely to affect data collection ‐ ITS | Low risk | Quote, pg. 3: "We used primary care health data from the Clinical Practice Research Datalink (CPRD) for the period Apr 1995 to Sept 2014". COMMENT: retrospective |
| Blinding of outcome assessors (detection bias) ‐ ITS All outcomes | Unclear risk | No information was provided to assess this risk. |
| Incomplete outcome data (attrition bias) ‐ ITS All outcomes | Unclear risk | No information was provided to assess this risk. |
| Selective reporting (reporting bias) ‐ ITS | Low risk | COMMENT: all relevant outcomes in the methods section were reported in the results section. |
| Other bias ‐ ITS | Unclear risk | No information was provided to assess this risk. |
Hersh 2004.
| Study characteristics | ||
| Methods | Study design: ITS | |
| Participants | Physicians Clinical speciality: not clear Level of training: fully trained Setting/country: not clear/US |
|
| Interventions | 3 PEMs were studied in this report: 1) the HERS (August 1998), 2) the HERS follow‐up (HERS II ‐ July 2002), and 3) the WHI (17 July 2002). HERS and HERS II concluded that postmenopausal hormone therapy with combination PO oestrogen/progestin offered no cardiovascular disease benefit among women with established disease. The oestrogen plus progestin trial of the WHI demonstrated that hormone therapy with an oestrogen/progestin combination caused increased risk of breast cancer and cardiovascular disease in postmenopausal women. | |
| Outcomes | 1 healthcare professionals' practice outcome: total number of prescriptions per year (before and after the publication of HERS ‐ August 1998) | |
| Notes | We planned to look at the combined effect of the 3 PEMs because of a lack of data to look at them separately. In this case, the 2 PEMs studied had similar characteristics, and we considered them as a whole (i.e. 1 PEM). In the end, we could not recover any data from this study. Funding: pg. 53: This study was supported by an institutional National Research Service Award (5T32‐HL07034) funded by the National Heart, Lung, and Blood Institute and by a research grant from Agency for Healthcare Research and Quality (R01‐HS013405). Role of the Sponsor: None of the funding agencies played a role in the design and conduct of the study, analysis and interpretation of the data, or the preparation and approval of the manuscript. |
|
| Risk of bias | ||
| Bias | Authors' judgement | Support for judgement |
| Intervention independent of other changes ‐ ITS | Unclear risk | No information was provided to assess this risk. |
| Shape of Intervention effect pre‐specified ‐ ITS | Unclear risk | Quote, pg. 48: "national trends in hormone therapy use since 1995 have not been reported, and the impact of recent evidence on hormone therapy prescriptions in subsequent months is unknown. Our objective was to describe these trends using national data on hormone therapy prescriptions and patient visits to physicians during which hormone therapy was prescribed". |
| Intervention unlikely to affect data collection ‐ ITS | Low risk | The interventions (HERS study; HERS II; WHI study) did not affect either the source or method of data collection. |
| Blinding of outcome assessors (detection bias) ‐ ITS All outcomes | Low risk | The outcome was objective. |
| Incomplete outcome data (attrition bias) ‐ ITS All outcomes | Low risk | Data came from 2 nationally representative databases. |
| Selective reporting (reporting bias) ‐ ITS | Low risk | All relevant outcomes in the methods section were reported in the results section. |
| Other bias ‐ ITS | Low risk | There was no evidence of other risks of bias. |
Izcovich 2011.
| Study characteristics | ||
| Methods | Study design: RT Unit of allocation: Physicians Type of comparison: PEM only vs. nothing. We considered the groups A and B in this review:
|
|
| Participants | Physicians Clinical specialty: General internal medicine Level of training: Mixed Setting/country: General internal medicine ward of the hospital/Argentina |
|
| Interventions | The PEM consisted of bibliographic information (search‐based material) to help answer medical questions that arise during daily clinical practice and assist physicians in improving clinically important outcomes in hospitalised patients. Questions that arose during morning rounds were identified. Bibliographic research was conducted to answer the questions that emerged during consultation with patients assigned to the intervention group. A physician specialised in internal medicine and trained in evidence‐based medicine identified medical questions that arose during morning reports. Such questions were either explicitly formulated by staff or resident physicians or inferred by the physician responsible for collecting them. Questions were collected using the PICOT structure (Population/Problem, Intervention, Comparison, Outcome, Type of design that would answer the question) in order to gather key words for the literature search. In some cases, questions were answered immediately by someone who was present in the session, using electronic resources such as UpToDate. Those questions were excluded from this study. The same physician who collected the questions also searched the literature for evidence. The literature search was carried out once the morning report was over, and it was considered finished within 12 hours. The sources used comprised the Cochrane Library, PubMed and Lilacs. Emails were sent daily, from Monday to Thursday, and they included a brief summary of the literature found to address each of the questions answered that day, a critical appraisal of the papers based on the User’s Guides and the papers themselves attached in PDF format. | |
| Outcomes | 2 patient health outcomes: Outcome 1: Combined outcome consisting in the proportion of death or transfer to an ICU (intensive care unit) Outcome 2: Proportion of readmissions during the course of the study 1 healthcare professionals' practice outcome: Outcome 3: Average length of stay |
|
| Notes | Funding: Information on funding was not available. | |
| Risk of bias | ||
| Bias | Authors' judgement | Support for judgement |
| Random sequence generation (selection bias) | Low risk | QUOTE (p. 131): “From March 2010 through August 2010, all patients admitted to the general internal medicine ward of the Hospital Aleman de Buenos Aires were randomly assigned to an intervention (search‐supported) group or a control group in a 1:1 ratio by flipping a coin at the time of admission.” |
| Allocation concealment (selection bias) | Low risk | All the patients were randomised before knowing if their care would then generate a question or not. |
| Baseline characteristics similar (selection bias) | Low risk | QUOTE (p. 132): "Baseline characteristics were similar in both arms (table 1)." |
| Baseline outcome similar Outcome 1 (outcome description in table above) | Unclear risk | The information about baseline outcomes measure was not reported. |
| Incomplete outcome data (attrition bias) Outcome 1 | Low risk | Information not provided in text but the N at baseline was the same as the N post‐intervention. |
| Blinding of outcome assessment (detection bias) Outcome 1 | Low risk | The outcome was objective. |
| Contamination protection (contamination bias) | High risk | Randomisation at patient level. QUOTE (p. 131): “all patients admitted to the general internal medicine ward of the Hospital Aleman de Buenos Aires were randomly assigned to an intervention (search‐supported) group or a control group” AND all physicians were made aware of the intervention. QUOTE (p. 132): “The literature found was sent by e‐mail to the whole medical team, including those physicians directly responsible for the care of the patient who had prompted the question. Emails were sent daily, from Monday to Thursday, and they included a brief summary of the literature found to address each of the questions answered that day…” |
| Selective reporting (reporting bias) Outcome 1 | Low risk | Outcome reporting consistent with methods |
| Other bias | Low risk | There was no evidence of other source of bias. |
Jackevicius 2001.
| Study characteristics | ||
| Methods | Study design: ITS | |
| Participants | Physicians Clinical speciality: internal medicine, cardiology, not specified Level of training: fully trained Setting/country: hospital/inpatient/Canada |
|
| Interventions | The PEM consisted of the 4S, published in 1994, which demonstrated that lipid lowering with simvastatin resulted in a clear and substantial decrease in total mortality and in fewer CHD events and less cardiovascular mortality when used in patients with CHD (history of angina or myocardial infarction) who also had high LDL‐cholesterol levels. | |
| Outcomes | 1 healthcare professionals' practice outcome: prescription for statin (all statins) | |
| Notes | Funding: pg. 183: One co‐author (Lawrence Leiter) has received research funding from and has been a speaker for Merck Canada, Montreal, Quebec, the manufacturer of simvastatin. | |
| Risk of bias | ||
| Bias | Authors' judgement | Support for judgement |
| Intervention independent of other changes ‐ ITS | High risk | Quote, pg. 187: "it is impossible to separate the effects of the publication of 4S, the subsequent continuing education efforts, and the effects of marketing by the pharmaceutical industry. Therefore, the results of this study show the effects of the combined efforts among many different parties to promote appropriate medication prescribing with lipid‐lowering therapy in patients after AMI". |
| Shape of Intervention effect pre‐specified ‐ ITS | Unclear risk | Quote, pg. 183: "the use of statins in patients after AMI represents a proven innovation that is not complex to use, that has been endorsed by professional societies and practice guidelines, and that has been aggressively marketed by drug manufacturers. Analysis of the use of statins may provide us with information on the extent to which it is possible to change prescribing behaviour in a large population when strong clinical evidence and practice guidelines are combined with aggressive marketing". |
| Intervention unlikely to affect data collection ‐ ITS | Low risk | The intervention (4S) did not affect either the source or method of data collection. |
| Blinding of outcome assessors (detection bias) ‐ ITS All outcomes | Low risk | The outcome was objective. |
| Incomplete outcome data (attrition bias) ‐ ITS All outcomes | Low risk | Quote, pg. 184: "all Ontario residents 65 years or older are covered under a comprehensive drug benefit plan. Each time a prescription is filled, a claim is submitted to the provincial government that contains the patient health insurance number and a unique drug identifier. The Ontario Myocardial Infarction Database provides data on all elderly patients treated for AMI in any Ontario hospital and records any prescriptions filled after hospital discharge". |
| Selective reporting (reporting bias) ‐ ITS | Low risk | All relevant outcomes in the methods section were reported in the results section. |
| Other bias ‐ ITS | Low risk | There was no evidence of other risks of bias. |
Jameson 2010.
| Study characteristics | ||
| Methods | Study design: ITS | |
| Participants | Surgeons Clinical speciality: orthopaedic surgery Level of training: fully trained Setting/country: hospital/inpatient/UK |
|
| Interventions | The PEM consisted of a guideline on prophylaxis against venous thromboembolism produced by NICE in April 2007. The recommendations were that all orthopaedic inpatients be offered an LMWH for the duration of their stay in hospital, while high‐risk patients, including all patients over the age of 60, should continue treatment for 4 weeks after discharge. | |
| Outcomes | 1 healthcare professionals' practice outcome: use of LMWH following a lower limb arthroplasty 2 patient health outcomes:
|
|
| Notes | Model fit was questionable for the following outcome: ‐ Percentage of patients following a lower limb arthroplasty receiving LMWH Funding: pg. 129: One co‐author (A. Bottle) was principally funded by Dr Foster Intelligence, a private healthcare information company, through a research grant for the Unit. No benefits in any form have been received or will be received from a commercial party related directly or indirectly to the subject of this article. |
|
| Risk of bias | ||
| Bias | Authors' judgement | Support for judgement |
| Intervention independent of other changes ‐ ITS | Unclear risk | No information was provided. |
| Shape of Intervention effect pre‐specified ‐ ITS | Unclear risk | Quote, pg. 124: "the early effect of the NICE guidelines has yet to be reported. This paper aims to examine their impact on the use of LMWH in patients undergoing arthroplasty of the lower limb in England and Wales, and to analyze the effect on the national rates of complications relating to venous thromboembolic prophylaxis". |
| Intervention unlikely to affect data collection ‐ ITS | Low risk | The intervention (NICE guidelines on prophylaxis against venous thromboembolism) did not affect either the source or method of data collection. |
| Blinding of outcome assessors (detection bias) ‐ ITS All outcomes | Low risk | The outcome was objective. |
| Incomplete outcome data (attrition bias) ‐ ITS All outcomes | Low risk | COMMENT: an exclusion criterion was described as "missing date of operation" in patient records and while the number and distribution between pre‐ and post‐guideline periods was not given, it is likely to be small and evenly distributed. |
| Selective reporting (reporting bias) ‐ ITS | Low risk | All relevant outcomes in the methods section were reported in the results section. |
| Other bias ‐ ITS | Low risk | There was no evidence of other risks of bias. |
Jousimaa 2002.
| Study characteristics | ||
| Methods | Study design: C‐RT Unit of allocation: physician Type of comparison: PEM only vs. single intervention
|
|
| Participants | Physicians Clinical speciality: general practice/family medicine Level of training: newly qualified physicians in their last 2‐year training period (during which they work independently and are responsible for their own clinical decisions) Setting/country: general practice/Finland |
|
| Interventions | The PEM studied in this report was the Physician's Desk Reference and Database (now re‐named Evidence‐Based Medicine Guidelines), a collection of Finnish clinical practice guidelines. The over 1100 guidelines were written by GPs in cooperation with experts from other specialities. | |
| Outcomes | 9 healthcare professionals' practice outcomes:
|
|
| Notes | Funding: pg. 586: This study was supported by grants from the Finnish Cultural Foundation, Saastamoinen Foundation, and Finnish Medical Society Duodecim. The 10 laptop microcomputers needed in the study were provided by the MSD Pharmaceutical Company and Duodecim. The Health Services Research Unit is funded by the Chief Scientist Office of the Scottish Executive Department of Health. | |
| Risk of bias | ||
| Bias | Authors' judgement | Support for judgement |
| Random sequence generation (selection bias) | Low risk | Quote, pg. 588: "students agreeing to participate in the study were randomized centrally using computer‐generated numbers to receive either computerized or textbook‐based guidelines". |
| Allocation concealment (selection bias) | Low risk | Quote, pg. 588: "students agreeing to participate in the study were randomized centrally using computer‐generated numbers to receive either computerized or textbook‐based guidelines". |
| Baseline characteristics similar (selection bias) | Low risk | Quote, pg. 589: "the baseline characteristics of both study groups were similar (Table 1)". COMMENT: the baseline characteristics of the intervention and control groups were reported and similar. |
| Baseline outcome similar Outcome 1 (outcome description in table above) | Unclear risk | No information was provided to assess this risk. |
| Incomplete outcome data (attrition bias) Outcome 1 | Low risk | The reasons for losses in the study were similar and the proportions were similar, 6/72 = 8.3% in intervention and 3/67 = 4.5% in control group. |
| Blinding of outcome assessment (detection bias) Outcome 1 | Low risk | Quote, pg. 589: "the anonymous patient records were then evaluated by one author (JJ, experienced primary care physician) blinded to the study group (computer or textbook, information searching or non‐information searching consultation)". COMMENT: the authors stated explicitly that the primary outcome variables were assessed blindly. |
| Contamination protection (contamination bias) | Unclear risk | COMMENT: professionals were possibly allocated within a clinic or practice and it is possible that communication between intervention and control professionals could have occurred. |
| Selective reporting (reporting bias) Outcome 1 | Low risk | All relevant outcomes in the methods section were reported in the results section. |
| Other bias | Low risk | No evidence of other risks of bias |
Judge 2015.
| Study characteristics | ||
| Methods | Study design: ITS | |
| Participants | Physicians (including residents) Clinical speciality: rheumatology Level of training: fully trained Settings/country: outpatient setting (ambulatory care provided by hospitals/specialists)/United Kingdom |
|
| Interventions | The exposure (intervention) was the publication of British Society for Rheumatology (BSR) guidelines in July 2006. The guideline provides practical evidence‐based advice on recommended interventions in RA. The objective is to provide a framework of care for managing RA, including control of synovitis, symptom control, self‐management, physical functioning, psychosocial functioning and screening/monitoring. The primary target of this guidance is health professionals and managers; however, it is also relevant to patients with RA. The guidance is limited to the first 2 yrs of RA. | |
| Outcomes | Four process outcomes: (1) Proportion of prescriptions of methotrexate (MTX) within 3 months of RA diagnosis date (2) Proportion of prescriptions of methotrexate (MTX) within 12 months of RA diagnosis date (3) Proportion of prescriptions of any disease‐modifying antirheumatic drugs (DMARD) within 3 months of RA diagnosis date (4) Proportion of prescriptions of any disease‐modifying antirheumatic drugs (DMARD) within 12 months of RA diagnosis date. |
|
| Notes | Funding: pg. 2247‐2248: This work was supported by Roche‐Chugai who provided sponsorship towards the project and provided access to the CPRD data. Funding sources had no influence on the study design, interpretation of results or decision to submit the article. | |
| Risk of bias | ||
| Bias | Authors' judgement | Support for judgement |
| Intervention independent of other changes ‐ ITS | High risk | Quote, pg. 2247: "There are many possible explanations for the overall increasing trend in the use of DMARDS for early RA over the study period, including the publication of national and international guidelines, the influence of medical education through attendance at conferences and lectures, the availability of better diagnostic tools for early diagnosis and the increased availability of DMARD therapies." COMMENT: No comment |
| Shape of Intervention effect pre‐specified ‐ ITS | High risk | COMMENT: retrospective |
| Intervention unlikely to affect data collection ‐ ITS | Low risk | Quote, pg. 2245: "We obtained data from the CPRD. … A first‐ever clinical or referral record of RA occurring from 1995 until the end of 2010 was identified using Read codes." COMMENT: retrospective |
| Blinding of outcome assessors (detection bias) ‐ ITS All outcomes | Unclear risk | No information was provided to assess this risk. |
| Incomplete outcome data (attrition bias) ‐ ITS All outcomes | Unclear risk | No information was provided to assess this risk. |
| Selective reporting (reporting bias) ‐ ITS | Low risk | Quote, pg. 2245: "See results section" COMMENT: all relevant outcomes in the methods section were reported in the results section. |
| Other bias ‐ ITS | Unclear risk | No evidence of other risks of bias |
Juurlink 2004.
| Study characteristics | ||
| Methods | Study design: ITS | |
| Participants | Physicians Clinical speciality: not clear Level of training: fully trained Setting/country: mixed/Canada |
|
| Interventions | The PEM consisted of the RALES published in September 1999, which demonstrated that treatment with spironolactone substantially reduced morbidity and mortality in patients with severe heart failure. | |
| Outcomes | 1 healthcare professionals' practice outcome: rate of spironolactone prescription for patients with heart failure 2 patient health outcomes:
|
|
| Notes | Funding: pg. 550: Supported by a grant from the University of Toronto Dean’s Fund; by a New Investigator award from the Canadian Institutes of Health Research (CIHR) and by the University of Toronto Drug Safety Research Group (to Dr. Juurlink); by New Investigator awards from the CIHR (to Drs. Mamdani and Austin); by a fellowship award from the CIHR and the Heart and Stroke Foundation of Canada (to Dr. Lee); by a Senior Scientist award from the CIHR (to Dr. Laupacis); and by a Career Scientist award from the Ontario Ministry of Health, a grant from the CIHR, and a Canada Research Chair in Medical Decision Sciences (to Dr. Redelmeier) | |
| Risk of bias | ||
| Bias | Authors' judgement | Support for judgement |
| Intervention independent of other changes ‐ ITS | Unclear risk | No information was provided to assess this risk. |
| Shape of Intervention effect pre‐specified ‐ ITS | Unclear risk | No information was provided to assess this risk. |
| Intervention unlikely to affect data collection ‐ ITS | Low risk | The intervention (RALES) did not affect either the source or method of data collection. |
| Blinding of outcome assessors (detection bias) ‐ ITS All outcomes | Low risk | The outcome was objective. |
| Incomplete outcome data (attrition bias) ‐ ITS All outcomes | Low risk | Quote, pg. 544: "we examined the computerized prescription records of the Ontario Drug Benefit Program, which records prescription drugs dispensed to all Ontario residents 65 years of age or older. The overall error rate in this database is less than 1 percent. Hospitalization records were obtained from the Canadian Institute for Health Information Discharge Abstract Database, which contains a record of all hospitalizations, including up to 16 diagnoses for each admission. Although the accuracy of coding in this database has not been established for all diagnoses, one recent study showed a positive predictive value of 90 to 96 percent for the diagnosis of heart failure." COMMENT: the authors established that the databases used as sources were accurate and complete. |
| Selective reporting (reporting bias) ‐ ITS | Low risk | All relevant outcomes in the methods section were reported in the results section. |
| Other bias ‐ ITS | High risk | Quote, pg. 550: "indeed, many of the patients hospitalized for hyperkalemia may have died of another illness. The diagnostic coding for hyperkalemia has not been validated; moreover, many patients hospitalized for hyperkalemia may have also had volume contraction or renal insufficiency related to spironolactone therapy. In addition, we were unable to identify adverse outcomes that occurred before admission". |
Kabir 2007.
| Study characteristics | ||
| Methods | Study design: ITS | |
| Participants | Physicians Clinical speciality: not clear Level of training: fully trained Setting/country: not clear/Ireland |
|
| Interventions | 3 PEMs were studied in this report: 1) the LIFE (2002), 2) the ALLHAT (18 December 2002), and 3) the VALUE (2004). The LIFE study showed that for a similar level of BP reduction, losartan reduced events more than atenolol, a β‐adrenoceptor blocker. The ALLHAT trial confirmed that thiazides (chlorthalidone) controlled systolic BP as well as and, in elected subgroups, better than both ACE inhibitors (lisinopril) and calcium channel blockers (amlodipine). However, the VALUE trial showed that the amlodipine‐based regimen significantly reduced BP further than valsartan, especially in the early period. Another feature common to all studies was the demonstration of the need for polypharmacy to achieve BP control. | |
| Outcomes | 7 healthcare professionals' practice outcomes:
|
|
| Notes | Funding: Information on funding was not available. | |
| Risk of bias | ||
| Bias | Authors' judgement | Support for judgement |
| Intervention independent of other changes ‐ ITS | Unclear risk | No information was provided to assess this risk. |
| Shape of Intervention effect pre‐specified ‐ ITS | Unclear risk | No information was provided to assess this risk. |
| Intervention unlikely to affect data collection ‐ ITS | Low risk | The interventions (LIFE, ALLHAT, and VALUE studies) did not affect either the source or method of data collection. |
| Blinding of outcome assessors (detection bias) ‐ ITS All outcomes | Low risk | The outcome was objective. |
| Incomplete outcome data (attrition bias) ‐ ITS All outcomes | Low risk | Data were collected from a regional database. |
| Selective reporting (reporting bias) ‐ ITS | Low risk | All relevant outcomes in the methods section were reported in the results section. |
| Other bias ‐ ITS | Low risk | There was no evidence of other risks of bias. |
Kajita 2010.
| Study characteristics | ||
| Methods | Study design: C‐RC Unit of allocation: municipal health centres Type of comparison: PEM only vs. nothing:
|
|
| Participants | Nurses, public health nurses, and allied health professionals in the field of community health Clinical speciality: community health Level of training: fully trained Setting/country: community‐based (e.g. community health centre, public health department)/Japan |
|
| Interventions | The intervention was the distribution of an evidence‐based guideline. The guideline was entitled "Evidence‐based guideline for the prevention of osteoporosis and osteoporotic fractures in community health", a purely evidence‐based practice guideline for the prevention of osteoporosis written in Japanese and published in October 2004. This guideline was developed and formatted in accordance with recommendations for evidence‐based guidelines, as per formal assessment procedures specified in the Japanese version of the AGREE instrument. | |
| Outcomes | 46 healthcare professionals' practice outcomes, including implementation rate of evidence‐based health education items for osteoporosis prevention (see Table 3 for a complete list) | |
| Notes | Funding: pg. S101: The study was supported by Health and Labour Sciences Research Grants (2006‐2007) from The Japanese Ministry of Health, Labour and Welfare. | |
| Risk of bias | ||
| Bias | Authors' judgement | Support for judgement |
| Random sequence generation (selection bias) | Low risk | Quote, pg. 2: "after the pre‐intervention assessment, the 100 centers were randomly allocated in a 1:1 ratio to the intervention and control group by a minimization method that defined region and city/town as stratification factors". |
| Allocation concealment (selection bias) | Low risk | Quote, pg. 2: "the allocation was performed by the controller of the trial (M. I.), who was not involved in the assessment as an evaluator". |
| Baseline characteristics similar (selection bias) | Low risk | Quote, pg. 4: "there were no significant differences between the intervention and control groups in municipality type, population, population aging rate, number of permanent health center staff, or the qualifications of the staff (physicians, public health nurses, nurses, dieticians, physical therapists, and clerks). There was no significant difference between the intervention and control groups in the implementation rate for osteoporosis screening or any type of health education or counseling before the intervention". |
| Baseline outcome similar Outcome 1 (outcome description in table above) | Low risk | Quote, pg. 4: "there was no significant difference in the overall score for the implementation status of evidence‐based health education items, as recommended by the guideline, between the intervention (median, 10; first and third quartiles: 3, 17) and control (median, 9; first and third quartiles: 1.5, 18.5) groups in the pre‐intervention assessment. The Table shows the implementation status of each health education item in these groups". |
| Incomplete outcome data (attrition bias) Outcome 1 | Low risk | Quote, pg. 4: "all 100 municipal health centers completed the preintervention assessment. Of these, 3 centers declined to participate in the trial and 1 center was absorbed into another municipality (Figure 1). We performed the post‐intervention assessments for the remaining 96 centers (48 in the intervention group and 48 in the control group; 96% follow‐up rate)". |
| Blinding of outcome assessment (detection bias) Outcome 1 | Low risk | Quote, pg. 3: "the post‐intervention assessment was performed 1 year after the distribution of the guideline under blinded conditions in which the evaluators were unaware of the allocation". |
| Contamination protection (contamination bias) | Low risk | COMMENT: the unit of allocation was by institution (health centre). |
| Selective reporting (reporting bias) Outcome 1 | Low risk | All relevant outcomes in the methods section were reported in the results section. |
| Other bias | High risk | Quote, pg. 9: "the study did not use a double‐blind design because it was not possible to use a placebo guideline. Instead, we offered to reimburse the control centers for the cost for materials needed to revise their health education programs. Although only 3 centers claimed reimbursement, our offer may have increased the use of information other than the guideline in the control group and may have improved the evidence‐based status of the programs of the control centers, thereby decreasing the magnitude of differences in the outcome measures between the groups". |
Komen 2017.
| Study characteristics | ||
| Methods | Study design: ITS | |
| Participants | Physicians (including residents) Clinical speciality: cardiology Level of training: fully trained Settings/country: outpatient setting (ambulatory care provided by hospitals/specialists)/Sweden (Stockholm) |
|
| Interventions | The four PEMs consisted of guidelines and regional recommendations: 1) European Society of Cardiology (ESC) guidelines (August 2012), 2) preliminary national (PN) guidelines (December 2013), 3) regional Drug and Therapeutics Committee (DTC) recommendations (January 2015), and 4) final national (FN) guidelines (October 2015). | |
| Outcomes | One process outcome was extracted: proportion of newly initiated patients on novel oral anticoagulants (NOACs) each month | |
| Notes | Funding: pg. 650: The study was funded by Stockholm County Council and Karolinska Institutet. | |
| Risk of bias | ||
| Bias | Authors' judgement | Support for judgement |
| Intervention independent of other changes ‐ ITS | High risk | Quote, pg. 648: "the interventions took place close together in time, and the effect of one intervention may have influenced another, as was the case with the European guidelines and the reimbursement of dabigatran and rivaroxaban. Therefore, it was difficult to tell which intervention was most important for the early increase in NOAC initiations". COMMENT: No comment |
| Shape of Intervention effect pre‐specified ‐ ITS | High risk | COMMENT: retrospective |
| Intervention unlikely to affect data collection ‐ ITS | Low risk | Quote, pg. 644: "We conducted a retrospective, population‐based study using the administrative health registers of the Swedish capital region of Stockholm County, the Stockholm Healthcare Analysis Database". |
| Blinding of outcome assessors (detection bias) ‐ ITS All outcomes | Unclear risk | No information was provided to assess this risk. |
| Incomplete outcome data (attrition bias) ‐ ITS All outcomes | Unclear risk | Quote, pg. 649: "Firstly, the study relied on the diagnoses recorded in healthcare records, which might have been missing in some cases. This might have led to an underestimation of the total number of patients diagnosed with AF. However, as the proportions of patients initiated with each treatment were used for the main analyses, it is unlikely that this underestimation caused any bias in the results." COMMENT: The missing data were not specified in the paper. |
| Selective reporting (reporting bias) ‐ ITS | High risk | See tables 1 and 2 |
| Other bias ‐ ITS | Low risk | There was no evidence of other risks of bias. |
Kottke 1989.
| Study characteristics | ||
| Methods | Study design: RCT Unit of allocation: physicians Type of comparison: PEM only vs. nothing. We considered the groups A and B in this review:
|
|
| Participants | Physicians Clinical speciality: general practice/family medicine Level of training: fully trained Setting/country: general practice/US |
|
| Interventions | The PEM studied in this report was a smoking cessation manual entitled "Quit‐and‐Win" that could be used as an instructor's manual, as a self‐help guide, or as one part of a comprehensive intervention. The physicians were advised to give a copy to any patient who smoked. They were told that their supply of "Quit‐and‐Win" booklets would be replenished as required. | |
| Outcomes | 5 healthcare professionals' practice outcomes:
5 patient health outcomes:
|
|
| Notes | 2 separate PEM analysis for all 10 points:
Funding: pg. 2106: This study was supported in part by National Institutes of Health grant CA38361, National Institute of Drug Abuse grant DA04066, and a National Institute of Drug Abuse Research Scientist Award, DA00109 (Dr Hughes). |
|
| Risk of bias | ||
| Bias | Authors' judgement | Support for judgement |
| Random sequence generation (selection bias) | Low risk | Quote from correspondence with the author: "I believe that we assigned the physicians using a computer random generator". |
| Allocation concealment (selection bias) | Unclear risk | No information was provided to assess this risk. |
| Baseline characteristics similar (selection bias) | Low risk | TABLE 1 and quote, pg. 2103: "neither the mean age of the physicians, the size of the clinics nor the patient load…differed significantly among the three groups". COMMENT: even if professionals were well balanced, patients did not have all baseline characteristics similar. |
| Baseline outcome similar Outcome 1 (outcome description in table above) | Unclear risk | Outcomes were not collected at baseline. |
| Incomplete outcome data (attrition bias) Outcome 1 | Low risk | The proportion of patient‐smokers was similar between groups, and the percentage reached at 1 year for follow‐up was similar. Quote, pg. 2103: "patients who either could not be contacted or refused to be interviewed were assumed to be continuing to smoke and were assumed not to have made any cessation attempts". |
| Blinding of outcome assessment (detection bias) Outcome 1 | High risk | This was a self‐report assessment by patients who were not blinded. |
| Contamination protection (contamination bias) | Low risk | Quote, pg. 2102: "to prevent contamination from having physicians of the same practice in different trial groups, all physicians in the same practice were either moved to the most intense level of intervention to which any of them had been originally randomized or, if not yet randomized at the time this problem was discovered, added to the group to which their partner(s) had been randomized". |
| Selective reporting (reporting bias) Outcome 1 | Low risk | All relevant outcomes in the methods section were reported in the results section. |
| Other bias | High risk | COMMENT: the primary outcome measure was the 102‐question questionnaire for patients, making this outcome measure susceptible to LOW validity. |
Kunz 2007.
| Study characteristics | ||
| Methods | Study design: C‐RCT Unit of allocation: Practices Type of comparison: PEM only vs. nothing:
|
|
| Participants | Physicians Clinical specialty: General practice/family medicine Level of training: Unclear Setting/country:Family practice/Germany |
|
| Interventions | The PEM studied was a collection of one‐sentence evidence summaries regarding medication for patients with chronic medical problems that were appended to consultants’ letters to primary care practitioners. The authors of the summaries identified medical conditions that are frequently encountered in hospital care, that require long‐term drug treatment, and for which high‐quality randomised controlled trials, or meta analysis of such trials, have unequivocally established benefits greater than risks, costs, and inconvenience. The authors generated single‐sentence evidence summaries for each condition/medication pair. Primary care practitioners received only one evidence summary per letter; if several summaries were applicable, the doctor received the most relevant one. The rate of discontinuation of recommended medication, the primary study end point, was lower in the intervention group than in the control group. | |
| Outcomes | 1 healthcare professionals' practice outcome: Outcome 1: Non‐adherence to discharge medication, measured as the proportion of patients for who medications were discontinued |
|
| Notes | Funding: Information on funding was not available. | |
| Risk of bias | ||
| Bias | Authors' judgement | Support for judgement |
| Random sequence generation (selection bias) | Low risk | QUOTE (p. 457): "Existing practices were randomised using a computer generated random list before establishing the practitioners’ willingness to participate." |
| Allocation concealment (selection bias) | Low risk | QUOTE (p. 457): “For practices that opened during the study period, we prepared opaque sealed envelopes that the department secretary opened sequentially. Immediately before discharge, and thus at the point of returning the patient to the care of a primary care practitioner, the residents followed an algorithm to identify patients who had begun medication intended for long‐term use and for which an evidence summary was available. Only after establishing a patient’s eligibility did they check the patient’s allocation to the experimental or control intervention.” |
| Baseline characteristics similar (selection bias) | Low risk | QUOTE (p.458): “Figure 1 and table 1 summarise the characteristics of the intervention and control group at randomisation and subsequent stages of the study and show excellent balance at randomisation. […] The distribution of medical conditions addressed was similar between groups with the exception of heart failure (13% intervention, 21% control), hypertension (13% intervention, 22% control), and osteoporosis (10% intervention, 6% control). The analysis included adjustment for differences in the distribution of medical conditions.” |
| Baseline outcome similar Outcome 1 (outcome description in table above) | Unclear risk | No baseline measure of outcome |
| Incomplete outcome data (attrition bias) Outcome 1 | Unclear risk | QUOTE (p. 457‐8): “No interview was possible in 56 practices because of: refusal to participate (intervention 9/control 6); logistical problems — that is, patient lost to practitioner; practice closed; address unknown; missing discharge letter (intervention 14/control 13); patient‐related reasons — that is, death within the observation period (intervention 1/control 4); miscellaneous reasons (intervention 3/control 6).” Unsure about the outcome. Unsure about the impact of missing data (was there a between‐group significant difference in the distribution of reasons for data to be missing?) |
| Blinding of outcome assessment (detection bias) Outcome 1 | Unclear risk | QUOTE (p. 357): “We instituted several precautions to minimise the potential for bias that could result from combining non‐blinded interviews with practitioners’ self‐report about continuation of a patient’s medication. Interviewers strictly followed a written interview guide that had been pretested. Throughout the study, we repeatedly reviewed the conduct of the interview, and, in particular, adherence to the guide. We prearranged interview times through the practice nurse, ensured the availability of the patient’s drug record for the interview, and faxed the questionnaire and the original discharge letter to the practitioner before the interview. These measures assured the practitioner’s awareness of the specific patient and the patient’s current medication and also facilitated the practitioner’s understanding of the interview. […] (p.359) Limitations included the lack of blinding of interviewers to allocation to treatment and control groups and the practitioners’ self‐report of drug (dis‐)continuation that we did not confirm with a review of charts. We tried, however, to minimise bias in the interviews through a highly standardised interview format and strict monitoring of the interviewers to comply with that format. We made various provisions to ensure that practitioners had all relevant information available at the time of the interview.” |
| Contamination protection (contamination bias) | Low risk | Randomisation by cluster |
| Selective reporting (reporting bias) Outcome 1 | Unclear risk | No information was provided to assess this risk. |
| Other bias | Low risk | There was no evidence of other source of bias. |
Lam 2009.
| Study characteristics | ||
| Methods | Study design: ITS | |
| Participants | Physicians Clinical speciality: not clear Level of training: fully trained Setting/country: not clear/Canada |
|
| Interventions | The PEM studied in this report was "4D" (published 21 July 2005). The results showed that atorvastatin did not significantly reduce the primary endpoint of cardiovascular death, non‐fatal myocardial infarction, or stroke. In a secondary analysis, there was an unexpected increase in fatal strokes in the atorvastatin group compared with those receiving a placebo. The trial investigators concluded that "in persons with type II diabetes mellitus who are receiving maintenance hemodialysis and have low‐density lipoprotein cholesterol values between 80 and 190 mg per deciliter (2.07 and 4.92 mmol/L), routine treatment with a statin to reduce the primary endpoint of death from cardiac causes, myocardial infarction, and stroke is not warranted". | |
| Outcomes | 1 healthcare professionals' practice outcome: rate of statin use (age and sex standardised rate of statin use per 1000 diabetic haemodialysis patients) | |
| Notes | Funding: pg. 1178: This project was supported by the Lawson Health Research Institute and the Physicians’ Services Incorporated Foundation. One co‐author (Dan G. Hackam) was supported by clinician scientist salary funding from the University of Western Ontario. Another co‐author (Rita S. Suri) was supported by a Canadian Institutes of Health Research Randomized Controlled Trials Mentorship Award. Another co‐author (Arsh K. Jain) was supported by a Clinician Investigator Program Award from the University of Western Ontario and a Fellowship Award from the Canadian Institutes of Health Research. Another co‐author (Amit X. Garg) was supported by a Clinician Scientist Award from the Canadian Institutes of Health Research. The Institute for Clinical Evaluative Sciences receives funding from the Ontario Ministry of Health and Long‐term Care. The opinions, results, and conclusions reported in this paper are those of the authors and are independent of the funding sources. | |
| Risk of bias | ||
| Bias | Authors' judgement | Support for judgement |
| Intervention independent of other changes ‐ ITS | Unclear risk | Quote, pg. 1174: "it was not possible to evaluate the extent to which other potential factors, such as pharmaceutical marketing, influenced prescribing patterns". |
| Shape of Intervention effect pre‐specified ‐ ITS | Unclear risk | Quote, pg. 1172: "one of the largest randomized controlled trials ever published in nephrology is Der Deutsche Diabetes Dialyse Studie (4D), which showed no beneficial effect of statins in diabetic patients receiving haemodialysis. We sought to determine whether there was a change in statin use among diabetic patients on dialysis after the publication of 4D". Quote, pg. 1177: "in this study, we specified the publication date of 4D (21 July 2005) as the primary time point to assess whether there was a change in prescribing practice". |
| Intervention unlikely to affect data collection ‐ ITS | Low risk | The intervention (4D) did not affect either the source or the method of data collection. |
| Blinding of outcome assessors (detection bias) ‐ ITS All outcomes | Low risk | The outcome was objective. |
| Incomplete outcome data (attrition bias) ‐ ITS All outcomes | Low risk | Quote, pg. 1177: "we used database codes with proven validity as detailed in Supplementary Appendix B. All of these data source have been successfully used in previous studies to examine prescribing rates of statins and a number of other medications in Ontario". COMMENT: 4 databases were used as sources in this report, all of which are comprehensive. Missing data were likely to be very low. |
| Selective reporting (reporting bias) ‐ ITS | Low risk | All relevant outcomes in the methods section were reported in the results section. |
| Other bias ‐ ITS | Low risk | There was no evidence of other risks of bias. |
Lee 2018A.
| Study characteristics | ||
| Methods | Study design: ITS | |
| Participants | Clinical speciality: paediatrics Settings/country: outpatient setting (ambulatory care provided by hospitals/specialists)/United States of America |
|
| Interventions | The two PEMs consisted of the guidelines on the selection of children for ambulatory adenotonsillectomy that were published in June 2011 (G2011) and September 2012 (G2012). | |
| Outcomes | Postoperative revisits after ambulatory paediatric tonsillectomy for privately insured patients | |
| Notes | Unclear characteristics of participating providers and unclear level of training Funding: pg. 478: The corresponding author (Helen H. Lee)’s time was supported with an unrestricted grant by the Foundation for Anesthesia Education and Research and the Anesthesia Quality Institute. |
|
| Risk of bias | ||
| Bias | Authors' judgement | Support for judgement |
| Intervention independent of other changes ‐ ITS | Unclear risk | No information was provided to assess this risk. |
| Shape of Intervention effect pre‐specified ‐ ITS | High risk | Retrospective study |
| Intervention unlikely to affect data collection ‐ ITS | Low risk | Retrospective study |
| Blinding of outcome assessors (detection bias) ‐ ITS All outcomes | Unclear risk | No information was provided to assess this risk. |
| Incomplete outcome data (attrition bias) ‐ ITS All outcomes | Unclear risk | No information was provided to assess this risk. |
| Selective reporting (reporting bias) ‐ ITS | Low risk | Quote, pg. 480‐483: "See results section" COMMENT: all relevant outcomes in the methods section were reported in the results section. |
| Other bias ‐ ITS | Low risk | There was no evidence of other risks of bias. |
Lee 2018B.
| Study characteristics | ||
| Methods | Study design: ITS | |
| Participants | Clinical speciality: paediatrics Settings/country: United States of America |
|
| Interventions | The two PEMs consisted of the 2007 NICE (National Institute for Health and Care Excellence) and 2011 AAP (American Academy of Pediatrics) guidelines that recommended against routine voiding cystourethrograms in children presenting with first febrile urinary tract infections. | |
| Outcomes | Two patient outcomes: (1) quarterly rate of voiding cystourethrogram use per 100,000 (age 0 to 2 years old) (2) quarterly rate of voiding cystourethrogram use per 100,000 (age 3 to 10 years old) |
|
| Notes | Unclear characteristics of participating providers, unclear level of training and unclear setting Funding: pg.831: Supported by the Bomalaski Michigan Pediatric Urology Scholars fund |
|
| Risk of bias | ||
| Bias | Authors' judgement | Support for judgement |
| Intervention independent of other changes ‐ ITS | Unclear risk | No information was provided to assess this risk. |
| Shape of Intervention effect pre‐specified ‐ ITS | High risk | No information was provided to assess this risk. |
| Intervention unlikely to affect data collection ‐ ITS | Low risk | No information was provided to assess this risk. |
| Blinding of outcome assessors (detection bias) ‐ ITS All outcomes | Unclear risk | No information was provided to assess this risk. |
| Incomplete outcome data (attrition bias) ‐ ITS All outcomes | Unclear risk | No information was provided to assess this risk. |
| Selective reporting (reporting bias) ‐ ITS | Low risk | Quote, pg.832‐834: "See results section" COMMENT: all relevant outcomes in the methods section were reported in the results section. |
| Other bias ‐ ITS | Low risk | There was no evidence of other risks of bias. |
Li 2017.
| Study characteristics | ||
| Methods | Study design: ITS | |
| Participants | Settings/country: hospital/Canada | |
| Interventions | There were two PEMs studied: they consisted of Quebec methicillin‐resistant Staphylococcus aureus (MRSA) guidelines for healthcare‐associated infections (HAIs) prevention, that were published initially in 2006 (MRSA guideline) and updated in 2010 (MRSA update). These guidelines included progress and milestones and reinforced the fundamental goals in healthcare associated infection (HAI): 1) creating a strong and easily accessible surveillance programme, 2) facilitating laboratory and disinfection processes, 3) facilitating antibiotic stewardship, and 4) using evidence‐based practices for preventing HAIs including CLABSI (central‐line associated bloodstream infections) and bacteraemia from multidrug‐resistant organisms. | |
| Outcomes | Four patient outcomes: (1) incidence rate of healthcare‐associated MRSA for teaching facilities (2) incidence rate of healthcare‐associated MRSA for non‐teaching facilities (3) incidence rate of central‐line‐associated bloodstream infections (CLABSI) for teaching facilities (4) incidence rate central‐line‐associated bloodstream infections (CLABSI) for non‐teaching facilities |
|
| Notes | Unclear characteristics of participating providers Mixture of people who were in training and fully trained Funding: pg. 846: This work was supported by the Surveillance provinciale des infections nosocomiales (SPIN), a programme of the Quebec Institute of Public Health, funded by the Quebec Ministère de la Santé et des services sociaux (Ministry of Health). |
|
| Risk of bias | ||
| Bias | Authors' judgement | Support for judgement |
| Intervention independent of other changes ‐ ITS | High risk | Quote, pg. 845: "This study’s ecological design also limited our ability to infer causality between guideline implementation and incidence rates." |
| Shape of Intervention effect pre‐specified ‐ ITS | Low risk | Quote, pg. 842: "Although INSPQ guidelines were published in June 2006, an 11‐month window in the pre‐guideline interval was reserved to account for distribution, training, and implementation periods". |
| Intervention unlikely to affect data collection ‐ ITS | Low risk | Quote, pg. 841: "Data were extracted in June (CLABSI). The present study is a retrospective longitudinal cohort analysis that was approved by the INSPQ and did not require institutional board review because it was a secondary analysis of previously collected data." COMMENT: No change in data collection |
| Blinding of outcome assessors (detection bias) ‐ ITS All outcomes | Low risk | Quote, pg. 841: "Cases from 2007 to 2010 were retrospectively reclassified to reflect the new definition. SPIN surveillance measures and definitions have been described previously and are publicly available." |
| Incomplete outcome data (attrition bias) ‐ ITS All outcomes | Unclear risk | No information was provided to assess this risk. |
| Selective reporting (reporting bias) ‐ ITS | Low risk | COMMENT: all relevant outcomes in the methods section were reported in the results section. |
| Other bias ‐ ITS | Low risk | There was no evidence of other risks of bias. |
Liaw 2008.
| Study characteristics | ||
| Methods | Study design: C‐RT Unit of allocation: Practices Type of comparison: PEM vs. active control (training programme about an unrelated topic)
|
|
| Participants | Physicians Clinical specialty: General practice Level of training: Unclear Setting/country: Family practices/Australia |
|
| Interventions | The PEM used in this report consisted of paediatric asthma guidelines that were adapted to the local context — a low socioeconomic area with a high proportion of culturally and linguistically diverse (CALD) groups — by an inter‐divisional group of general practitioners and investigators. The guidelines were presented as flow‐charts and dot points on three laminated A4 pages, printed on both sides. Approximately 12 hours of group discussion and several hours of individual review were required to achieve consensus on the guidelines. | |
| Outcomes | 1 provider outcome: Outcome 1: Proportion of GPs who provided children with asthma with written asthma action plans, self‐reported measure |
|
| Notes | Funding: Information on funding was not available. | |
| Risk of bias | ||
| Bias | Authors' judgement | Support for judgement |
| Random sequence generation (selection bias) | Low risk | QUOTE (p. 2): The unit of randomisation was the general practice clinic. A table of random numbers was used to assign GP practices to study groups. |
| Allocation concealment (selection bias) | Low risk | QUOTE (p. 2): “It was not possible to blind GPs to which study group they had been assigned, however, patients were not informed by the investigators as to their GPs group allocation. Investigators were unable to be blinded to the group allocation of GPs, but were blind to the group allocation of patients.” |
| Baseline characteristics similar (selection bias) | Low risk | Quote:"Practice factors and GP characteristics were generally well balanced across the three study groups, except for years in general practice where GPs in Group 3 tended to have more years in general practice than GPs allocated to Groups 1 and 2". |
| Baseline outcome similar Outcome 1 (outcome description in table above) | Low risk | QUOTE p. 4: "At baseline (pre‐intervention) there were no differences between the groups in their asthma knowledge, assessment of asthma severity, or assessment of high‐risk asthma" and "At baseline there were no differences between intervention and control groups in GPs self‐reported confidence in managing acute asthma or routine management of asthma." |
| Incomplete outcome data (attrition bias) Outcome 1 | Unclear risk | Authors reported dropouts but reasons were not provided. QUOTE (p. 2): "GPs from 32 practices (n = 63 GPs) were initially enrolled, though three practices and 12 GPs dropped out of the study after patient recruitment. The flow of practices and GPs through the study is shown in Figure 1." |
| Blinding of outcome assessment (detection bias) Outcome 1 | Unclear risk | QUOTE (p. 2): “It was not possible to blind GPs to which study group they had been assigned, however, patients were not informed by the investigators as to their GPs group allocation. Investigators were unable to be blinded to the group allocation of GPs, but were blind to the group allocation of patients.” |
| Contamination protection (contamination bias) | Low risk | Randomisation by cluster |
| Selective reporting (reporting bias) Outcome 1 | Low risk | Outcome reporting consistent with methods |
| Other bias | Low risk | There was no evidence of other source of bias. |
Luo 2018.
| Study characteristics | ||
| Methods | Study design: ITS | |
| Participants | Clinical speciality: cardiology Settings/country: inpatient/hospital setting/United States of America |
|
| Interventions | Guidelines recommending the use of angiotensin‐receptor neprilysin inhibitor (ARNI). Guidelines–Heart Failure (GWTG‐HF) registry vs. no guidelines | |
| Outcomes | One process outcome: ARNI (angiotensin receptor neprilysin inhibitor) uptake in clinical practice | |
| Notes | Unclear characteristics of participating providers Unclear level of training Funding: pg. 134: This work was sponsored by Novartis Pharmaceuticals Corporation, East Hanover, NJ. Additionally, the Get With The Guidelines–Heart Failure (GWTG‐HF) programme was provided by the American Heart Association. GWTG‐HF is sponsored, in part, by Amgen Cardiovascular and has been funded in the past through support from Medtronic, GlaxoSmithKline, Ortho‐McNeil, and the American Heart Association Pharmaceutical Roundtable. |
|
| Risk of bias | ||
| Bias | Authors' judgement | Support for judgement |
| Intervention independent of other changes ‐ ITS | Low risk | Quote, pg. 138: "Results were robust when using a Bayesian structural time‐series approach." |
| Shape of Intervention effect pre‐specified ‐ ITS | Low risk | Figure 1 |
| Intervention unlikely to affect data collection ‐ ITS | Low risk | Quote, pg. 135: "We used data from the Get With The Guidelines–Heart Failure (GWTG‐HF) registry and the American Hospital Association survey." COMMENT: Same data collection |
| Blinding of outcome assessors (detection bias) ‐ ITS All outcomes | Unclear risk | No information was provided to assess this risk. |
| Incomplete outcome data (attrition bias) ‐ ITS All outcomes | Low risk | Quote, pg. 135: "After application of standard exclusions for systematic incompleteness of GWTG‐HF data at the hospital and patient level, the rate of missing data in the remaining analytic data set was minimal (10%). For variables with low rates of missingness (i.e. 5% of records), we imputed continuous variables to the overall median value, dichotomous variables to “no,” and multichotomous variables to the most frequent categorical value. For variables with 5% missing, we treated missing values as a separate category." |
| Selective reporting (reporting bias) ‐ ITS | Low risk | COMMENT: No evidence of selectively reported outcomes |
| Other bias ‐ ITS | Low risk | There was no evidence of other risks of bias. |
Majumdar 2003.
| Study characteristics | ||
| Methods | Study design: ITS | |
| Participants | Physicians Clinical speciality: not clear Level of training: fully trained Setting/country: not clear/US and Canada |
|
| Interventions | 2 PEMs were studied in this report. The HOPE study demonstrated a 22% reduction in cardiovascular morbidity and mortality, and provided a new indication for ramipril. RALES compared spironolactone with placebo in patients with heart failure and demonstrated a 30% reduction in mortality. | |
| Outcomes | 4 healthcare professionals' practice outcomes:
|
|
| Notes | Model fit was questionable for the following outcome: ‐ Percentage of augmentation in the number of prescriptions Funding: pg. 467: The corresponding author (Sumit R. Majumdar) and one co‐author (Finlay A. McAlister) are Population Health Investigators supported by the Alberta Heritage Foundation for Medical Research, and New Investigators supported by the Canadian Institutes of Health Research. Another co‐author (Stephen B. Soumerai) is an Investigator in the HMO Research Network Center for Education and Research in Therapeutics, supported by the U.S. Agency for Healthcare Research and Quality (grant U18H510391) and the Harvard Pilgrim Health Care Foundation. |
|
| Risk of bias | ||
| Bias | Authors' judgement | Support for judgement |
| Intervention independent of other changes ‐ ITS | Low risk | Quote, pg. 468: "To adjust for potential differences between Canadian and United States physicians in the adoption of published evidence, we examined the effect of the Randomized Aldactone Evaluation Study (RALES) on prescribing trends for spironolactone. This study compared spironolactone with placebo in patients with heart failure and demonstrated a 30% reduction in mortality. RALES was pre‐released and published in the same year and the same journal as the HOPE study. Because spironolactone was not promoted by the pharmaceutical industry in either country, any observed differences in prescribing trends should be attributable mostly to a publication effect". |
| Shape of Intervention effect pre‐specified ‐ ITS | Low risk | Quote, pg. 468: "Therefore, we compared the prescribing trends for ramipril in Canada and the United States to test the hypotheses that publication of the HOPE study would increase the use of ramipril in both countries (publication effect), and that this increase would be greater in Canada (promotion effect)". |
| Intervention unlikely to affect data collection ‐ ITS | Low risk | The interventions studied (HOPE; RALES) did not affect either the source or the method of data collection. |
| Blinding of outcome assessors (detection bias) ‐ ITS All outcomes | Low risk | The outcome was objective. |
| Incomplete outcome data (attrition bias) ‐ ITS All outcomes | Low risk | Quote, pg. 468: "We used nationally representative drug dispensing information collected by IMS Health (IMS Health‐Canada and IMS Health‐America), which conducts research on prescribing patterns. Methods for data collection are identical in Canada and the United States. The IMS "CompuScript" database collects monthly dispensing records from a representative sample of retail pharmacies. The sample is drawn from 4800 pharmacies in Canada and 51,355 pharmacies in the United States, about two thirds of retail pharmacies". COMMENT: missing data, if any, were likely to be similar pre‐ and post‐intervention. |
| Selective reporting (reporting bias) ‐ ITS | Low risk | All relevant outcomes in the methods section were reported in the results section. |
| Other bias ‐ ITS | Low risk | There was no evidence of other risks of bias. |
Majumdar 2004.
| Study characteristics | ||
| Methods | Study design: ITS | |
| Participants | Physicians Clinical speciality: not clear Level of training: fully trained Setting/country: not clear/US |
|
| Interventions | The PEM was the WHI trial published on 17 July 2002, which concluded that overall health risks exceeded benefits from use of combined oestrogen plus progestin among healthy postmenopausal women. | |
| Outcomes | 5 healthcare professionals' practice outcomes:
|
|
| Notes | Model fit was questionable for the following outcomes: ‐ Prescription for postmenopausal hormone therapy ‐ Prescription for a postmenopausal hormone therapy (pempro) ‐ Prescription for a postmenopausal hormone therapy (lower dose premarin and pempro) Funding: pg. 1988: This study was supported by research grant R01‐HS013405 from the Agency for Healthcare Research and Quality. The corresponding author (Sumit R. Majumdar) is a Population Health Investigator supported by the Alberta Heritage Foundation for Medical Research and a New Investigator supported by the Canadian Institutes of Health Research. One co‐author (Elizabeth A. Almasi) was supported by a Stanford University Presidential Scholars Award. None of the sponsors of our research played a role in the design and conduct of this study; collection, management, analysis, and interpretation of the data; or preparation, review, and approval of the manuscript. |
|
| Risk of bias | ||
| Bias | Authors' judgement | Support for judgement |
| Intervention independent of other changes ‐ ITS | Unclear risk | No information was provided to assess this risk. |
| Shape of Intervention effect pre‐specified ‐ ITS | Unclear risk | No information was provided to assess this risk. |
| Intervention unlikely to affect data collection ‐ ITS | Low risk | The intervention (WHI study) did not affect either source or method of data collection. |
| Blinding of outcome assessors (detection bias) ‐ ITS All outcomes | Low risk | The outcome was objective. |
| Incomplete outcome data (attrition bias) ‐ ITS All outcomes | Low risk | Quote, pg. 1984: "we used nationally representative databases published by IMS Health (Plymouth Meeting, Pa), an independent pharmaceutical research company, to describe national trends in hormone therapy prescription and promotion. Information on prescriptions was obtained from the NPA, which we have described in detail elsewhere". COMMENT: missing data, if any, was likely to be similar pre‐ and post‐intervention. |
| Selective reporting (reporting bias) ‐ ITS | Low risk | All relevant outcomes in the methods section were reported in the results section. |
| Other bias ‐ ITS | Low risk | There was no evidence of other risks of bias. |
Marincowitz 2018.
| Study characteristics | ||
| Methods | Study design: ITS Comparisons (1) SIGN head injury guidelines versus pre‐existing guidelines, (2) the 4‐hour target guideline versus pre‐existing guidelines and (3) second SIGN guideline versus pre‐existing guidelines |
|
| Participants | Clinical speciality: psychology Settings/country: in pre‐hospital care, general practice, emergency departments, radiology, surgical and critical care specialties, paediatric and rehabilitation services/Scotland |
|
| Interventions | This study examines 3 PEMs: (1) the 1st Scottish Intercollegiate Guidelines Network (SIGN1) head injury guidelines that was introduced in 2000, (2) the 4‐hour ED target (4H) that was introduced in 2004, and (3) the 2nd SIGN guidelines that was introduced in 2009 (SIGN2). | |
| Outcomes | One patient outcome: hospital admissions in patients with head injury | |
| Notes | Unclear characteristics of participating providers Unclear level of training Funding: pg. 10: The corresponding author, Carl Marincowitz is funded by a National Institute for Health Research Doctoral Fellowship (DRF‐2016‐09‐086). This study presents independent research funded by the National Institute for Health Research (NIHR). |
|
| Risk of bias | ||
| Bias | Authors' judgement | Support for judgement |
| Intervention independent of other changes ‐ ITS | Low risk | Quote, pg. 9: "We cannot find other policies or sudden changes to the population of Scotland that could account for the observed changes in admissions for head injury in Scotland at the time of the either the introduction of the SIGN guidelines or the 4‐hour ED target." |
| Shape of Intervention effect pre‐specified ‐ ITS | Low risk | (1) Outcomes: rate of change of hospital admissions in patients with head injury: 0‐15 years old, 16‐64 years old and 65 + years old (Fig.1) (2) Outcome: rate of change of hospital admissions in patients with TBI (Fig.2) |
| Intervention unlikely to affect data collection ‐ ITS | Low risk | Quote, pg. 9: "there were no changes to the cohort of admitted patients that data were collected on during the study period and ISD data have been found to be both sufficiently reliably and comprehensively collected to support its use in research." |
| Blinding of outcome assessors (detection bias) ‐ ITS All outcomes | Unclear risk | No information was provided to assess this risk. |
| Incomplete outcome data (attrition bias) ‐ ITS All outcomes | Unclear risk | No information was provided to assess this risk. |
| Selective reporting (reporting bias) ‐ ITS | Low risk | (1) COMPARISON: SIGN head injury guidelines versus pre‐existing guidelines: (1.1) Outcomes: rate of change of hospital admissions in patients with head injury: 0‐15 years old, 16‐64 years old and 65 + years old: COMMENT: No evidence of selectively reported outcome (1.2) Outcome: rate of change of hospital admissions in patients with TBI: COMMENT: No evidence of selectively reported outcome (2) COMPARISON: the 4‐hour target guideline versus pre‐existing guidelines (for all outcomes): COMMENT: No evidence of selectively reported outcomes (3) COMPARISON: Second SIGN guideline versus pre‐existing guidelines (for all outcomes): COMMENT: No evidence of selectively reported outcomes |
| Other bias ‐ ITS | Low risk | There was no evidence of other risks of bias. |
Markovitz 2017.
| Study characteristics | ||
| Methods | Study design: ITS | |
| Participants | Clinical speciality: cardiology Settings/country: United States of America |
|
| Interventions | Two different PEMS: (1) Addition of a high‐potency statin to the Department of Veterans Affairs (VA) formulary (Formulary) and (2) the release of the American College of Cardiology/American Heart Association (ACC/AHA) cholesterol guidelines | |
| Outcomes | One process outcome: Proportion of prescribing of moderate‐to‐high‐intensity statins among high‐risk patients | |
| Notes | Unclear characteristics of participating providers Unclear level of training and Unclear settings Funding: pg.2013: Funding for this study was provided by the Veterans Health Administration’s Office of Reporting, Analytics, Performance, Improvement and Deployment (RAPID) and by VA IIR 11‐088. Jeremy Sussman was supported by a VA Career Development Award (CDA13‐021). |
|
| Risk of bias | ||
| Bias | Authors' judgement | Support for judgement |
| Intervention independent of other changes ‐ ITS | High risk | Quote, pg. 2012: "The quasi‐experimental design of our study makes it difficult to be sure that changes in prescribing behavior were caused by changes to the VA formulary or ACC/AHA guideline." |
| Shape of Intervention effect pre‐specified ‐ ITS | Low risk | Quote, pg. 2001: "We divided our study into three periods: preformulary (July 2011–September 2012); postformulary (October 2012–October 2013); and postguideline (November 2013–June 2016). " COMMENT: see fig1 |
| Intervention unlikely to affect data collection ‐ ITS | Low risk | Quote, pg. 1998: "We constructed the study population using the VA Corporate Data Warehouse, a comprehensive database that contains data on all patients seen in the VA." |
| Blinding of outcome assessors (detection bias) ‐ ITS All outcomes | Unclear risk | No information was provided to assess this risk. |
| Incomplete outcome data (attrition bias) ‐ ITS All outcomes | Unclear risk | No information was provided to assess this risk. |
| Selective reporting (reporting bias) ‐ ITS | Low risk | COMMENT: No evidence of selectively reported outcomes |
| Other bias ‐ ITS | Low risk | There was no evidence of other risks of bias. |
Mason 1998/99.
| Study characteristics | ||
| Methods | Study design: ITS | |
| Participants | Physicians Clinical speciality: general practice/family medicine Level of training: fully trained Setting/country: general practice/UK |
|
| Interventions | The PEM studied in this report was an Effective Health Care bulletin questioning the cost‐effectiveness of prescribing SSRIs that was distributed to all GPs by the chief medical officer. The original distribution of the bulletin to all GPs occurred in March 1993. We examined the effect of this intervention on prescribing in English primary care using time‐series analysis. | |
| Outcomes | 2 healthcare professionals' practice outcomes:
|
|
| Notes | Model fit was questionable for the following outcome: ‐ Prescription of antidepressants (selective serotonin reuptake inhibitors‐ SSRIs) Funding: Information on funding was not available. |
|
| Risk of bias | ||
| Bias | Authors' judgement | Support for judgement |
| Intervention independent of other changes ‐ ITS | Unclear risk | Quote, pg. 122: "the Effective Health Care Bulletin, and related article in the BMJ published at the same time, were the first scientific reports to question the widespread switch to SSRIs. These sparked considerable interest in the media, and also considerable activity from medical and pharmaceutical advisors in the NHS". |
| Shape of Intervention effect pre‐specified ‐ ITS | Unclear risk | A specific null hypothesis was not provided. Quote pg. 120: "we examined the effect of this intervention on prescribing in English primary care using time series analysis". |
| Intervention unlikely to affect data collection ‐ ITS | Low risk | The Effective Health Care Bulletin (the intervention) did not affect the data source (Prescriptions Pricing Authority) or the method of data collection. |
| Blinding of outcome assessors (detection bias) ‐ ITS All outcomes | Low risk | The outcome was objective. |
| Incomplete outcome data (attrition bias) ‐ ITS All outcomes | Low risk | Quote, pg. 120: "these data reflect the total number of prescriptions reimbursed for antidepressants on a quarterly basis". COMMENT: if a patient did not seek or receive reimbursement, these data could be missed, but this was unlikely to be affected by the publication of the PEMs. |
| Selective reporting (reporting bias) ‐ ITS | Low risk | All relevant outcomes in the methods section were reported in the results section. |
| Other bias ‐ ITS | Low risk | There was no evidence of other risks of bias. |
Mason 2001.
| Study characteristics | ||
| Methods | Study design: ITS | |
| Participants | Physicians Clinical speciality: not clear Level of training: fully trained Setting/country: not clear/UK |
|
| Interventions | An NHS Effective Health Care bulletin (November 1992) on the treatment of glue ear in children (EHC‐OM bulletin) was distributed nationally to NHS decision makers in 1992. Based on systematic review, the bulletin concluded that surgery should be restricted to children with an extended period of substantial hearing impairment, with persistence and severity established by watchful waiting. | |
| Outcomes | 1 healthcare professionals' practice outcome: use of surgery for glue ear (mean number of procedures per 1000 habitants under 15 years old for 14 regions) | |
| Notes | Funding: pg. 1097: Academic grant from Nuffield Trust for Research Policy Studies in Health Services, registered charity No 209201 | |
| Risk of bias | ||
| Bias | Authors' judgement | Support for judgement |
| Intervention independent of other changes ‐ ITS | High risk | Quote, pg. 1097: "the change cannot be attributed to the bulletin alone, which was commissioned because of preexisting concerns about appropriate use of the procedure. Its publication received coverage in the medical and academic press, possibly encouraging doctors to examine their own practices and bring about behavioural change". |
| Shape of Intervention effect pre‐specified ‐ ITS | Unclear risk | Quote, pg. 1096: "based on systematic review, the bulletin concluded that surgery should be restricted to children with an extended period of substantial hearing impairment, with persistence and severity established by watchful waiting. We evaluated surgery rates before and after distribution of the bulletin". |
| Intervention unlikely to affect data collection ‐ ITS | Low risk | The intervention (Effective Health Care bulletin) did not affect either the source or the method of data collection. |
| Blinding of outcome assessors (detection bias) ‐ ITS All outcomes | Low risk | The outcome was objective. |
| Incomplete outcome data (attrition bias) ‐ ITS All outcomes | Low risk | Quote, pg. 1096: "quarterly numbers of D151 procedures — insertion of a ventilation tube through the tympanic membrane — performed in children aged under 15 in England from 1989 to 1996 were obtained from the hospital episodes system. We calculated per capita regional and national rates for this procedure". COMMENT: missing data, if any, were likely to be similar pre‐ and post‐intervention. |
| Selective reporting (reporting bias) ‐ ITS | Low risk | All relevant outcomes in the methods section were reported in the results section. |
| Other bias ‐ ITS | Low risk | There was no evidence of other risks of bias. |
Matowe 2002.
| Study characteristics | ||
| Methods | Study design: ITS | |
| Participants | Physicians Clinical speciality: radiology Level of training: fully trained Setting/country: general practice/UK |
|
| Interventions | The report evaluated the effect of postal dissemination of the third edition of the RCR guidelines on GP referral for radiography. The RCR guidelines were introduced to encourage appropriate use of diagnostic radiology and reduce the use of clinically unhelpful examinations. Between 1989 and 1998, four editions of these guidelines were produced, and a large number of copies distributed by mail to primary care. The current edition of the guideline includes 285 individual recommendations. | |
| Outcomes | 1 healthcare professionals' practice outcome: total number of x‐ray referrals | |
| Notes | Funding: pg. 578: The corresponding author (Lloyd Matowe) was funded by the Beit trust. The Health Services Research Unit is funded by the Chief Scientist Office of the Scottish Executive Health Department. The project was partially funded by the Grampian Health Board. However, the views expressed are those of authors and not the funding bodies. | |
| Risk of bias | ||
| Bias | Authors' judgement | Support for judgement |
| Intervention independent of other changes ‐ ITS | Unclear risk | No information was provided to allow assessment of this risk. |
| Shape of Intervention effect pre‐specified ‐ ITS | Low risk | COMMENT: the authors specifically referred to reductions in x‐ray requests found by other studies and proposed an ITS study of longer duration to improve the detection of the effect. They verified if other guidelines were disseminated independently of this study, and they also evaluated the effect of guidelines for 18 radiology examinations. |
| Intervention unlikely to affect data collection ‐ ITS | Low risk | The intervention did not affect the data source (hospital radiology department records), and sources and methods of data collection were the same before and after the intervention. |
| Blinding of outcome assessors (detection bias) ‐ ITS All outcomes | Low risk | The outcome was objective. |
| Incomplete outcome data (attrition bias) ‐ ITS All outcomes | Low risk | Quote, pg. 576: "data were abstracted from the computerized administrative systems of two radiology departments serving over 90% of general practices in the region". COMMENT: missing data from GPs not using these radiology departments was not considered but it was not a high proportion (10%). |
| Selective reporting (reporting bias) ‐ ITS | Low risk | All relevant outcomes in the methods section were reported in the results section. |
| Other bias ‐ ITS | Low risk | There was no evidence of other risks of bias. |
McEwen 2002.
| Study characteristics | ||
| Methods | Study design: RT Unit of allocation: Practices Type of comparison: PEM vs nothing Groups considered in review: A and B
|
|
| Participants | Physicians Clinical specialty: General practice Level of training: Unclear Setting/country:General practices/UK |
|
| Interventions | The "GP Desktop Resource" (GDR) was a smoking cessation intervention tool offering guidance for GPs in helping their patients quit smoking. It also included tear‐off advice and information sheets for smoking patients. The GDR was designed to increase the frequency and quality of smoking cessation advice given by GPs. | |
| Outcomes | 3 healthcare professionals' practice outcomes: Outcome 1: Rate of opportunistic advice per week Outcome 2: Rate of giving counselling about stopping smoking per week Outcome 3: Proportion of GPs who had recommended or prescribed NRT |
|
| Notes | Funding: Information on funding was not available. | |
| Risk of bias | ||
| Bias | Authors' judgement | Support for judgement |
| Random sequence generation (selection bias) | Low risk | Computer random number generation QUOTE (p. 596): “One hundred and seven GPs in 30 practices in West Dorset were assigned randomly (by practice) to either receive the GDR (N = 49) or to act as a control group (N = 58)." |
| Allocation concealment (selection bias) | Unclear risk | No information was provided to assess this risk. |
| Baseline characteristics similar (selection bias) | Unclear risk | Table with the summary of participants' characteristics not provided QUOTE (p. 596): “There were no differences between the GDR group and the controls in terms of gender, age, location, whether they were single handed or group practices, smoking status or whether they had received training on smoking cessation.” |
| Baseline outcome similar Outcome 1 (outcome description in table above) | Unclear risk | No information was provided to assess this risk. |
| Incomplete outcome data (attrition bias) Outcome 1 | Unclear risk | No table or data were presented to support low risk of bias due to non‐response (only a reference to support theory). QUOTE (p. 596): "the survey, 62 from the first wave of questionnaires and 12 from the second (37 in the GDR group and 37 in the control group, response rate 70%). […] In principle the results might be viewed as biased by the fact that the response rate was not 100%. However, it was similar in both groups and previous research has found no difference between initial responders and non responders in GP surveys of smoking cessation activities (McEwen & West 2000).” |
| Blinding of outcome assessment (detection bias) Outcome 1 | Low risk | The outcome was objective and... QUOTE (p. 596):“The survey was deliberately kept separate from any health authority communication to minimize response bias.” |
| Contamination protection (contamination bias) | Unclear risk | Radomisation not by cluster, thus contamination was possible even if: QUOTE (p. 596): The survey was deliberately kept separate from any health authority communication to minimise response bias. |
| Selective reporting (reporting bias) Outcome 1 | Low risk | Outcome reporting consistent with methods |
| Other bias | Low risk | The was no evidence of other sources of bias. |
Meyer 2007.
| Study characteristics | ||
| Methods | Study design: ITS | |
| Participants | Physicians Clinical speciality: general practice/family medicine Level of training: fully trained Setting/country: outpatient (e.g. ambulatory care provided by hospitals/specialists)/Germany |
|
| Interventions | The written guidelines on empirical antibiotic treatment in the ICU were revised in December 2003 upon publication of the study by Chastre and colleagues (Chastre 2003) and with respect to the local resistance situation. This change in empirical therapy was performed by a multidisciplinary team consisting of the intensive care specialist responsible for the ward and an infection control physician, and also included a microbiologist and a pharmacist, on occasion. | |
| Outcomes | 1 healthcare professionals' practice outcome: antibiotic use density (AD; expressed as defined daily doses per 1000 patient‐days) | |
| Notes | Funding: pg. 1154: The ICU participated in SARI (Surveillance of Antimicrobial use and antimicrobial Resistance in German Intensive Care Units), a project that is supported by a grant from the Federal Ministry of Education and Research (01Kl 9907). | |
| Risk of bias | ||
| Bias | Authors' judgement | Support for judgement |
| Intervention independent of other changes ‐ ITS | Unclear risk | No information was provided to assess this risk. |
| Shape of Intervention effect pre‐specified ‐ ITS | Low risk | Quote, pg. 1148: "to evaluate the impact of an intervention to reduce the duration of antibiotic treatment for pneumonia in a neurosurgical intensive care unit (ICU). The usage of antibiotics and the resultant costs were examined using interrupted time series analysis while resistance and device‐associated infection rates are also described". |
| Intervention unlikely to affect data collection ‐ ITS | Low risk | The intervention (written guidelines) did not affect the source or method of data collection. |
| Blinding of outcome assessors (detection bias) ‐ ITS All outcomes | Low risk | The outcome was objective. |
| Incomplete outcome data (attrition bias) ‐ ITS All outcomes | Low risk | Quote, pg. 1149: "monthly data on antimicrobial usage and costs of antibiotics were obtained from the computerized pharmacy database". COMMENT: missing data, if any, were likely similar pre‐ and post‐intervention. |
| Selective reporting (reporting bias) ‐ ITS | Low risk | All relevant outcomes in the methods section were reported in the results section. |
| Other bias ‐ ITS | Low risk | There was no evidence of other risks of bias. |
Mohammadi 2015.
| Study characteristics | ||
| Methods | Study design: RT Unit of allocation: Physicians Stratification by sex Type of comparison: PEM only vs. nothing
|
|
| Participants | Physicians Clinical specialty: General practice Level of training: Unclear Setting/country: General practices/Iran |
|
| Interventions | The PEM was an educational pamphlet used as a tool to reinforce the learning process. It was used to improve overall prescription writing by physicians (i.e. reduce prescription errors). The pamphlet addressed the most prevalent prescription writing problems using a checklist designed for this purpose. The pamphlet was designed with the supervision of a pharmacologist and a clinical pharmacologist. | |
| Outcomes | 11 healthcare professionals' practice outcomes: Outcome 1: Number of prescriptions of each GP Outcome 2: Number of items in prescriptions Outcome 3: Number of injection drugs prescribed Outcome 4: Number of corticosteroids prescribed Outcome 5: Number of penicillin injections prescribed Outcome 6: Number of cephalosporins prescribed Outcome 7: Number of aminoglycosides prescribed Outcome 8: Number of NSAIDs prescribed Outcome 9: Number of injection solutions prescribed Outcome 10: Number of prescriptions of IV gentamicin + ceftriaxone Outcome 11: Cost of prescriptions |
|
| Notes | Funding: pg. 5: This study was carried out as part of a research project at Tehran University of Medical Sciences; in June 2010, contract number 10190/76/01/89. | |
| Risk of bias | ||
| Bias | Authors' judgement | Support for judgement |
| Random sequence generation (selection bias) | Unclear risk | No information was provided to assess this risk. |
| Allocation concealment (selection bias) | Unclear risk | No information was provided to assess this risk. |
| Baseline characteristics similar (selection bias) | Low risk | QUOTE (p. 3): “There was no significant difference for the years of experience between intervention (8.1% ± 3.52) and control (8.2 ± 3.00) groups (P = 0.874). Also, there was no significant difference between two groups in gender (P = 0.463). There was no significant difference in the mean number of prescriptions in the intervention and the control groups before and after intervention (P = 0.076).” |
| Baseline outcome similar Outcome 1 (outcome description in table above) | Low risk | QUOTE (p. 3): “There was no significant difference in the mean number of prescriptions in the intervention and the control groups before and after intervention (P = 0.076).” |
| Incomplete outcome data (attrition bias) Outcome 1 | Low risk | QUOTE (p. 2): “Five physicians (5%) were excluded due to unknown address.” |
| Blinding of outcome assessment (detection bias) Outcome 1 | Unclear risk | No information was provided to assess this risk. QUOTE (p. 2): "Also, we designed a checklist on the basis of identified errors to assess prescriptions. To check interpersonal reliability of the checklist (between raters), 50 assessed prescriptions were reviewed simultaneously by two experts, and for individual reliability (within‐rater), 50 prescriptions were assessed in two rounds within a one‐week interval." |
| Contamination protection (contamination bias) | Unclear risk | Randomisation not in cluster. General practitioners within same practice could have been allocated to different groups and may have easily communicated about the study material. |
| Selective reporting (reporting bias) Outcome 1 | Low risk | Outcome reporting consistent with methods |
| Other bias | Low risk | There was no evidence of other risks of bias. |
Naimer 2017.
| Study characteristics | ||
| Methods | Study design: ITS | |
| Participants | Clinical speciality: general practice/family medicine Settings: general practice/Canada |
|
| Interventions | May 2012 cervical cancer screening guidelines on Chlamydia testing | |
| Outcomes | Fifteen process outcomes:
|
|
| Notes | Unclear characteristics of participating providers Unclear level of training Funding: pg. 334: This work was supported by the Ray D. Wolfe Department of Family Medicine at Mount Sinai Hospital and the Department of Family and Community Medicine, University of Toronto. This study was also supported by the Institute for Clinical Evaluative Sciences (ICES) and Public Health Ontario (PHO), which are funded by annual grants from the Ontario Ministry of Health and Long‐Term Care (MOHLTC). The study sponsors did not participate in the design and conduct of the study; collection, management, analysis and interpretation of the data; preparation, review or approval of the manuscript; or the decision to submit the manuscript for publication. |
|
| Risk of bias | ||
| Bias | Authors' judgement | Support for judgement |
| Intervention independent of other changes ‐ ITS | High risk |
(1) Outcomes: Pap testing rates, for females, and by age bands of 15‐19, 20‐24 and 25‐29 years: Risk: High risk Quote, pg. 333: "We also included females who might have required specialized cervical cancer screening, such as immunocompromised individuals and those who had had previous abnormal Pap tests and had not yet returned to routine screening." COMMENT: No comment (2) Outcomes: Chlamydia testing rate change by sex (females and males) and age bands of 15‐19, 20‐24 and 25‐29 years: Risk: High risk Quote, pg. 333: "similar changes to other cervical cancer screening guidelines (e.g. the updated 2013 Canadian Task Force on Preventive Care Guidelines) may have also influenced chlamydia testing in Ontario". COMMENT: No comment (3) Outcomes: Rate of change of Chlamydia Incidence by sex (females and males) and by age bands of 15‐19, 20‐24 and 25‐29 years: Risk: Unclear risk Quote, pg. : "‐" COMMENT: No comment |
| Shape of Intervention effect pre‐specified ‐ ITS | Low risk |
For all outcomes: Quote, pg. 330: "This method estimates the trend of the outcomes before the release of the new guidelines (intervention), and changes in the outcomes both immediately following the intervention and 2 years later." |
| Intervention unlikely to affect data collection ‐ ITS | Unclear risk | No information was provided to assess this risk. |
| Blinding of outcome assessors (detection bias) ‐ ITS All outcomes | Low risk |
(1) Outcomes: Pap testing rates, for females, and by age bands of 15‐19, 20‐24 and 25‐29 years: Quote, pg. : "OHIP database, which captures billing claims submitted by about 94% of Ontario physicians" COMMENT: No comments (2) Outcomes: Chlamydia testing rate of change by sex (females and males) and age bands of 15‐19, 20‐24 and 25‐29 years: COMMENT: No information was provided to assess this risk. (3) Outcomes: Rate of change of Chlamydia Incidence by sex (females and males) and by age bands of 15‐19, 20‐24 and 25‐29 years: Quote, pg. 330: "Laboratories and clinicians are legally required to report laboratory‐confirmed or probable chlamydia cases to local public health departments, who record case information in iPHIS." |
| Incomplete outcome data (attrition bias) ‐ ITS All outcomes | Low risk |
(1) Outcomes: Pap testing rates, for females, and by age bands of 15‐19, 20‐24 and 25‐29 years: Quote, pg. 333: "Also, this study did not include Pap or chlamydia tests performed at certain hospitals, but most Ontario family physicians and gynecologists practice outside of hospitals, and the proportion missed was constant over the study period". (2) Outcomes: Chlamydia testing rate of change by sex (females and males) and age bands of 15‐19, 20‐24 and 25‐29 years: Quote, pg. 333: "Also, this study did not include Pap or chlamydia tests performed at certain hospitals, but most Ontario family physicians and gynecologists practice outside of hospitals, and the proportion missed was constant over the study period". (3) Outcomes: Rate of change of Chlamydia Incidence by sex (females and males) and by age bands of 15‐19, 20‐24 and 25‐29 years: No information was provided to assess this risk. |
| Selective reporting (reporting bias) ‐ ITS | Low risk | COMMENT: No evidence of selectively reported outcomes |
| Other bias ‐ ITS | Low risk | There was no evidence of other risks of bias. |
Nicholas 2009.
| Study characteristics | ||
| Methods | Study design: RT Unit of allocation: Paediatricians and family physicians Type of comparison: PEM only vs. nothing:
|
|
| Participants | Physicians Clinical specialty: Family medicine & paediatrics Level of training: Mixed Setting/country: Paediatric and general practices/US |
|
| Interventions | The PEM was a toolkit designed to promote the use of sex‐specific BMI‐for‐age percentiles to screen youths aged 2 to 20 years for obesity. The toolkit consisted of professional guidelines for childhood obesity screening and BMI‐related tools and educational information. More specifically, the material included a BMI calculator; sex‐specific BMI‐for‐age percentile growth charts; a laminated office chart summarising steps to calculate, plot, and interpret BMI; printed recommendations by the American Academy of Pediatrics to prevent paediatric overweight; and additional professional resources, including growth chart information, links to training modules, and links to Bright Futures in Practice, a collection of patient and family questionnaires on nutrition. The toolkit also included a letter highlighting the BMI percentiles‐based screening recommendations and the purpose of the mailing, signed by the New York State Commissioner of Health, the president of the New York State chapter of the American Academy of Pediatrics (District II), and the president of the New York State Academy of Family Physicians. | |
| Outcomes | 3 healthcare professionals' practice outcomes: Outcome 1: Frequency of using sex‐specific body mass index (BMI)‐for‐age percentiles to screen for obesity for children aged from 2‐5 years Outcome 2: Frequency of using sex‐specific body mass index (BMI)‐for‐age percentiles to screen for obesity for children aged from 6‐11 years Outcome 3: Frequency of using sex‐specific body mass index (BMI)‐for‐age percentiles to screen for obesity for children aged from 12‐20 years |
|
| Notes | Funding: pg. 6: This study was supported, in part, by cooperative agreement U58/CCU222783 from the Centers for Disease Control and Prevention and the New York State Department of Health. | |
| Risk of bias | ||
| Bias | Authors' judgement | Support for judgement |
| Random sequence generation (selection bias) | Unclear risk | Method used for randomisation not mentioned QUOTE (p. 2): “We obtained a random sample of physicians who reported their primary practice as either pediatrics or family practice from the state department of health’s medical licensing database and randomly assigned them to either the intervention (n = 496) or control group (n = 504) (Figure 1).” |
| Allocation concealment (selection bias) | Unclear risk | No information was provided to assess this risk. |
| Baseline characteristics similar (selection bias) | Low risk | QUOTE (p. 3): “The control and intervention groups did not differ on any measured variables (Table 1).” |
| Baseline outcome similar Outcome 1 (outcome description in table above) | Unclear risk | Information on table but none provided in text |
| Incomplete outcome data (attrition bias) Outcome 1 | Unclear risk | Authors did not report reasons for missing data. Information to make an assessment was insufficient. QUOTE "“A total of 211 physicians returned follow‐up surveys (response rate, 21%) (Figure 1).” |
| Blinding of outcome assessment (detection bias) Outcome 1 | Low risk | The outcome was objective. |
| Contamination protection (contamination bias) | Unclear risk | Possibility of contamination was likely. More information is needed. |
| Selective reporting (reporting bias) Outcome 1 | Low risk | Outcome reporting consistent with methods |
| Other bias | Low risk | There was no evidence of other risks of bias. |
Oakeshott 1994.
| Study characteristics | ||
| Methods | Study design: C‐RT Unit of allocation: practices Stratification by: number of partners and number of radiographic examinations requested Type of comparison: PEM only vs. nothing
|
|
| Participants | Physicians Clinical speciality: general practice/family medicine Level of training: fully trained (e.g. consultant) Setting/country: general practice/UK |
|
| Interventions | The PEM studied in this report consisted of the guidelines for examinations of the chest, limbs and joints, and spine taken from the RCR guidelines. The RCR guidelines aimed to encourage more appropriate use of diagnostic radiology and thereby reduce the use of clinically unhelpful x‐rays. The guidelines were printed verbatim on both sides of a laminated sheet of A4 paper. | |
| Outcomes | 3 healthcare professionals' practice outcomes:
|
|
| Notes | Funding: pg. 200: The study was funded by the South Thames Regional Health Authority Research and Development Project Grants Scheme. | |
| Risk of bias | ||
| Bias | Authors' judgement | Support for judgement |
| Random sequence generation (selection bias) | Unclear risk | Author could not confirm the method to generate the sequence (P. Oakeshott, personal communication). |
| Allocation concealment (selection bias) | Low risk | COMMENT: the unit of allocation was by physician and allocation was performed on all units at the start of the study. |
| Baseline characteristics similar (selection bias) | Unclear risk | No information was provided to assess this risk. |
| Baseline outcome similar Outcome 1 (outcome description in table above) | Low risk | COMMENT: we judged that no important difference was present across the study groups. |
| Incomplete outcome data (attrition bias) Outcome 1 | Unclear risk | No information was provided to assess this risk. |
| Blinding of outcome assessment (detection bias) Outcome 1 | Low risk | Quote, pg. 197: "conformity was assessed by P0 and JW who were unaware which practices had been sent the guidelines". |
| Contamination protection (contamination bias) | Low risk | Quote, pg. 197: "practices were stratified by number of partners and number of radiographic examinations requested, and randomized into two groups". |
| Selective reporting (reporting bias) Outcome 1 | Low risk | All relevant outcomes in the methods section were reported in the results section. |
| Other bias | Low risk | There was no evidence of other risks of bias. |
Ouldali 2017.
| Study characteristics | ||
| Methods | Study design: ITS Authors compared implementation of the 2011 national guidelines versus no guidelines. |
|
| Participants | Clinical speciality: paediatrics Settings/country: outpatient setting (ambulatory care provided by hospitals/specialists)/France |
|
| Interventions | New French national guidelines that were published in November 2011 to reduce the number of antibiotic prescriptions and avoid the use of broad‐spectrum antibiotics for ARTI in paediatrics. Each participating PED developed and implemented their own local protocols for antibiotic use for ARTIs based on the 2011 French guidelines. Implementation of the guidelines consisted of scientific discussions among emergency physicians, residents, and specialists in paediatric infectious diseases. Education sessions for new physicians and residents were conducted twice per year (once per rotation). Local guidelines were available through physician pocket guides. Implementation efforts were continued throughout the study. | |
| Outcomes | One process outcome: antibiotic prescription rate for ARTI (acute respiratory tract infections) per 1000 PED visits in the PED discharge prescriptions | |
| Notes | Unclear characteristics of participating providers Unclear level of training Funding: pg. 1475: Financial Support. This work was supported by the French Society of Pediatrics, the Pediatric Epidemiologic Research Group (SFP Guigoz laboratory grant), and the French Group of Intensive Care and Pediatric Emergency. |
|
| Risk of bias | ||
| Bias | Authors' judgement | Support for judgement |
| Intervention independent of other changes ‐ ITS | Low risk | Quote, pg. 1470: "We analyzed as a control outcome the antibiotic prescription rate for urinary infections per 1000 PED visits, given that there were no new guidelines for these diseases during the study period." Quote, pg. 1471: "An adjusted analysis, including age and proportion of viral ARTI among all ARTI cases over time, was performed to ensure that the results were not due to these potential confounding factors (see Supplementary Appendix 4)." |
| Shape of Intervention effect pre‐specified ‐ ITS | Low risk | Quote, pg. 1471: "to define a transitional phase of 9 months in 2011, from February 2011 to November 2011." |
| Intervention unlikely to affect data collection ‐ ITS | Low risk | Quote, pg. 1470: "We obtained data following the same procedure for the entire study period". |
| Blinding of outcome assessors (detection bias) ‐ ITS All outcomes | Unclear risk | No information was provided to assess this risk. |
| Incomplete outcome data (attrition bias) ‐ ITS All outcomes | Unclear risk | No information was provided to assess this risk. |
| Selective reporting (reporting bias) ‐ ITS | Low risk | No evidence of selectively reported outcomes |
| Other bias ‐ ITS | Low risk | There was no evidence of other risks of bias. |
Perria 2007.
| Study characteristics | ||
| Methods | Study design: C‐RT Unit of allocation: GPs Type of comparison: PEM only vs. nothing. We used comparison groups A and B, as defined here:
|
|
| Participants | Physicians Clinical speciality: general practice/family medicine Level of training: fully trained (e.g. consultant) Setting/country: general practice/Italy |
|
| Interventions | The PEM studied in this report was an evidence‐based guideline for the management of non‐complicated type 2 diabetes mellitus. The source guideline was a French guideline entitled "Stratégie de prise en charge du patient diabétique de type 2 à l'exclusion de la prise en charge des complications" published by ANAES, which was then translated, updated, and adapted for Italian GPs. | |
| Outcomes | 3 healthcare professionals' practice outcomes:
|
|
| Notes | Funding: pg. 8: The study is funded by the Italian Ministry of Health ("Special Programs" art.12 bis D.lgs 229/99) and the Lazio Region. The Agency of Public Health of Lazio region provided computers for data collection and the resources for planning and organisational support. | |
| Risk of bias | ||
| Bias | Authors' judgement | Support for judgement |
| Random sequence generation (selection bias) | Low risk | Quote, pg. 4: "our randomization sequence was computer‐generated". |
| Allocation concealment (selection bias) | Low risk | Quote, pg. 4: "randomization was performed by a researcher not involved in the study and who was blind to the identity of the practices". |
| Baseline characteristics similar (selection bias) | Low risk | Baseline information was provided in Table 1 and there were no important differences between study groups. |
| Baseline outcome similar Outcome 1 (outcome description in table above) | Low risk | The generalised estimating equation model was to used account for baseline differences. |
| Incomplete outcome data (attrition bias) Outcome 1 | Low risk | COMMENT: Intervention arm 2 (passive dissemination) and the control group had similar numbers of missing data. |
| Blinding of outcome assessment (detection bias) Outcome 1 | Low risk | The outcome was objective. |
| Contamination protection (contamination bias) | Low risk | Quote, pg. 4: "GPs who accepted to take part in the study, were assigned by simple random allocation by the REXSCO [21] software, which assigns to same‐practice partners a nil probability of being randomized, thus minimizing the chances of participant contamination". |
| Selective reporting (reporting bias) Outcome 1 | High risk | Quote, pg. 7: "as results showed the non‐effectiveness of the intervention strategy, we did not perform any economic evaluation or carry out analysis on participant sub‐clusters". COMMENT: all relevant primary outcomes were reported. |
| Other bias | Low risk | There was no evidence of other risks of bias. |
Rahme 2005.
| Study characteristics | ||
| Methods | Study design: C‐RT Unit of allocation: Towns Type of comparison: PEM only vs. nothing:
|
|
| Participants | Physicians Clinical specialty: General practice Level of training: Unclear Setting/country: General practices/Canada |
|
| Interventions | The PEM was a laminated sheet representing a decision tree used as a continuing medical education intervention. The PEM's purpose was to increase general practitioners’ ability to prescribe pharmacological treatment for patients with osteoarthritis according to guidelines. It was distributed to physicians by sales representatives, followed by a letter of explanation from the Continuing Medical Education Department regarding the content and use of the decision tree, without any further justification or discussion of the medical content. The decision tree discussed treatment options for osteoarthritis patients, suggesting non‐pharmacological treatment, including physical exercise as first‐line therapy, and pharmacological treatments starting with acetaminophen and moving to NSAIDs or COX‐2 inhibitors, with or without a gastroprotective agent, depending on the patient response to treatment and the presence of risk factors for NSAID gastropathy. | |
| Outcomes | 1 healthcare professionals' practice outcome: Outcome1: Percentage of adequate prescriptions relative to the total number of prescriptions of acetominophen, NSAIDs, or COX‐2 inhibitors |
|
| Notes | Funding: pg. 1267: This study and the development of the educational tools were supported by a nonrestricted education grant from Merck Frosst Canada Ltd. pg. 1261: Corresponding authors (Elham Rahme) and co‐authors (Denis Choquette, Louis Bessette, Jacques LeLorier) have served as consultants and paid speakers for Merck & Co. Inc. and for Pfizer Inc. In addition, co‐author (Michele Beaulieu) is an employee at Merck Frosst Canada Ltd. Corresponding authors (Elham Rahme) is a research scholar funded by The Arthritis Society. | |
| Risk of bias | ||
| Bias | Authors' judgement | Support for judgement |
| Random sequence generation (selection bias) | Unclear risk | No information was provided to assess this risk. QUOTE (p. 1263): “Each town was randomly allocated 1 of 4 intervention options: workshop alone, decision tree alone, workshop and decision tree, or no intervention (control).” |
| Allocation concealment (selection bias) | Unclear risk | No information was provided to assess this risk. |
| Baseline characteristics similar (selection bias) | Low risk | QUOTE (p. 1265): “Patients and physician characteristics were on average similar among the four groups (Table 2).” |
| Baseline outcome similar Outcome 1 (outcome description in table above) | Unclear risk | No information provided in text. A table with baseline outcomes was provided. Authors seem to have used appropriate analysis to take baseline characteristics into account. QUOTE (p. 1264): “To assess the effect of the intervention on prescription adequacy, we used a multilevel Bayesian hierarchical model. […] The models adjusted for the patient and physician variables described above.” |
| Incomplete outcome data (attrition bias) Outcome 1 | Unclear risk | No information was provided to assess this risk. |
| Blinding of outcome assessment (detection bias) Outcome 1 | Low risk | The outcome was objective. |
| Contamination protection (contamination bias) | Low risk | Randomisation in cluster QUOTE (p. 1263): “The intervention was first implemented in 8 towns of relatively small population sizes (30,000‐50,000 persons). Each town was randomly allocated 1 of 4 intervention options: workshop alone, decision tree alone, workshop and decision tree, or no intervention (control). The towns were geographically distant to minimize cross‐contamination (≥ 70 kilometers apart).” |
| Selective reporting (reporting bias) Outcome 1 | Low risk | Outcome reporting consistent with methods |
| Other bias | Low risk | There was no evidence of other risks of bias. |
Rigobon 2019.
| Study characteristics | ||
| Methods | Study design: ITS | |
| Participants | Physicians (including residents) Clinical speciality: general practice/family medicine Settings/country: general practice/Canada |
|
| Interventions | Dissemination tools were launched with the 2013 Diabetes Canada (previously Canadian Diabetes Association) evidence‐based guidelines. Compared with previous (2008) guidelines, the 2013 Diabetes Canada guidelines no longer require providers to stratify patients into different risk categories prior to recommending vascular protective therapy, thereby simplifying the assessment for vascular protection (Supplementary Table 1). Statin use is recommended for all patients over 40 years old and living with diabetes; ACEIs or angiotensin receptor blockers (ARBs) are recommended for patients over 55 years old with diabetes. Antiplatelet medications are no longer recommended for routine use in the primary prevention of CVD for patients with diabetes. The nationwide dissemination strategy launched in April 2013 and targeted multiple national and provincial systems‐level groups (e.g. government agencies, nongovernmental agencies, disease advocacy groups, and professional associations), as well as healthcare providers and people living with diabetes across Canada via large‐scale communications campaigns (e.g. television, radio, digital and print media). Interventions including in‐person lecture series, conferences, webinars, web‐based professional and patient resources such as flow sheets, electronic point of care decision support, a mobile application, and electronic medical record (EMR) templates were rolled out over 24 months. | |
| Outcomes | Three process outcomes: (1) proportion of eligible patients with statin prescriptions (2) proportion of eligible patients with ACEI/ARB prescriptions (3) proportion of eligible patients with antiplatelet prescriptions |
|
| Notes | Unclear level of training Funding: pg. 155: The 1st author (Alanna V. Rigobon) was supported by the Comprehensive Research Experience for Medical Students (CREMS) Stipend. The authors are also grateful to Diabetes Canada for providing funds for a component of data collection and analysis. |
|
| Risk of bias | ||
| Bias | Authors' judgement | Support for judgement |
| Intervention independent of other changes ‐ ITS | High risk | Quote, pg. 151: "Overall prescription rates were influenced by factors including rurality, province, and patient age and SES." COMMENT: no sufficient information to evaluate the independency of the intervention |
| Shape of Intervention effect pre‐specified ‐ ITS | Unclear risk | Quote, pg.: "‐" COMMENT: No comment |
| Intervention unlikely to affect data collection ‐ ITS | Low risk | Quote, pg. 150: "CPCSSN, established in 2008, is an EMR based information system designed for chronic disease surveillance. Every 3 months, EMR data from primary care practices in 10 practice‐based research networks (PBRNs) across Canada are extracted, cleaned, and merged into a single database housed at the Centre for Advanced Computing at Queen’s University in Kingston, Ontario, Canada". COMMENT: study was retrospective; study material was the same pre‐ and post‐intervention. |
| Blinding of outcome assessors (detection bias) ‐ ITS All outcomes | Unclear risk | No information was provided to assess this risk. |
| Incomplete outcome data (attrition bias) ‐ ITS All outcomes | Unclear risk | No information was provided to assess this risk. |
| Selective reporting (reporting bias) ‐ ITS | Low risk | COMMENT: all outcomes in method were reported in the results. |
| Other bias ‐ ITS | Low risk | There wais no evidence of other source of bias. |
Roberts 2007.
| Study characteristics | ||
| Methods | Study design: ITS | |
| Participants | Physicians Clinical speciality: prosthetic care Level of training: fully trained Setting/country: outpatient (e.g. ambulatory care provided by hospitals/specialists)/UK |
|
| Interventions | The PEM studied in this report was the Technology Appraisal Guidance No. 2 ‐ guidance on the selection of protheses for primary total hip replacements (April 2000). TAG No. 2 contained a recommendation that cemented protheses be used. | |
| Outcomes | 2 healthcare professionals' practice outcomes:
|
|
| Notes | Model fit was questionable for the following outcome: ‐ Percent use of uncemented prostheses Funding: pg. 867: No benefits in any form have been received or will be received from a commercial party related directly or indirectly to the subject of this article. |
|
| Risk of bias | ||
| Bias | Authors' judgement | Support for judgement |
| Intervention independent of other changes ‐ ITS | Unclear risk | No information was provided to assess this risk. |
| Shape of Intervention effect pre‐specified ‐ ITS | Unclear risk | No information was provided to assess this risk. |
| Intervention unlikely to affect data collection ‐ ITS | Low risk | The intervention (NICE Technology Appraisal Guideline 2) did not affect either the source or method of data collection. |
| Blinding of outcome assessors (detection bias) ‐ ITS All outcomes | Low risk | The outcome was objective. |
| Incomplete outcome data (attrition bias) ‐ ITS All outcomes | Unclear risk | Quote, pg. 865: "since the beginning of 1990, and with the agreement of all consultant orthopaedic surgeons in the region, all primary total hip and knee replacements (THR, TKR) performed throughout the Trent region were recorded prospectively". COMMENT: it was unlikely that there would be a difference in missing data before and after implementation of the intervention. |
| Selective reporting (reporting bias) ‐ ITS | Low risk | All relevant outcomes in the methods section were reported in the results section. |
| Other bias ‐ ITS | Low risk | There was no evidence of other risks of bias. |
Roifman 2017.
| Study characteristics | ||
| Methods | Study design: ITS | |
| Participants | Clinical speciality: cardiology Level of training: fully trained Settings/country: ‐/Canada |
|
| Interventions | Publication of Appropriate Use Criteria (AUC) on Utilization Rates of Myocardial Perfusion Imaging Studies in Ontario, Canada. Myocardial perfusion imaging (MPI) with single photon emission computed tomography is a commonly utilised cardiac imaging modality. Concern about the potential over utilisation of noninvasive cardiac imaging has led to the development of health policy initiatives such as appropriate use criteria (AUC) publications geared to curb utilisation. The three studied PEMs consisted of the three publications of the AUC updates in October 2005 (Oct2005), June 2009 (Jun2009), and February 2014 (Feb2014). | |
| Outcomes | One process outcome: age‐ and sex‐standardised monthly rate of MPI scans per 10,000 adults | |
| Notes | Unclear characteristics of participating providers Unclear level of training Unclear setting Funding: pg. 6: This article was funded by operating funds from Schulich Heart Program and the Sunnybrook Research Institute. This study was supported by the Institute for Clinical Evaluative Sciences (ICES), which is funded by an annual grant from the Ontario Ministry of Health and Long‐Term Care (MOHLTC). The funding organisations did not have any role in the design and conduct of the study; collection, management, analysis, and interpretation of the data; and preparation, review, or approval of the manuscript. No endorsement by ICES or the Ontario MOHLTC is intended or should be inferred. |
|
| Risk of bias | ||
| Bias | Authors' judgement | Support for judgement |
| Intervention independent of other changes ‐ ITS | Unclear risk | No information was provided to assess this risk. |
| Shape of Intervention effect pre‐specified ‐ ITS | Low risk | Quote, pg. 1: "Concern about the potential overutilization of noninvasive cardiac imaging has led to the development of health policy initiatives such as appropriate use criteria (AUC) publications geared to curb utilization". |
| Intervention unlikely to affect data collection ‐ ITS | Low risk | COMMENT: intervention is independent of data collection and might not affect it. |
| Blinding of outcome assessors (detection bias) ‐ ITS All outcomes | Unclear risk | No information was provided to assess this risk. |
| Incomplete outcome data (attrition bias) ‐ ITS All outcomes | Unclear risk | No information was provided to assess this risk. |
| Selective reporting (reporting bias) ‐ ITS | Low risk | Quote, pg. 3‐4: "See results section" COMMENT: all outcomes in the methods were reported in the results. |
| Other bias ‐ ITS | Low risk | Quote, pg. 2: "An auto regressive integrated moving average (ARIMA) model was used to compare mean monthly utilization rates before and after publication of the guidelines (i.e. the interventions). The impact of these interventions was assessed after accounting for seasonality (if present), background trends, and autocorrelation. Linear spline functions with knots at the dates of publications of the AUC were incorporated into this model.2". |
Sakai 2017.
| Study characteristics | ||
| Methods | Study design: ITS | |
| Participants | Clinical speciality: paediatrics Settings/country: Inpatient/hospital setting/United States of America |
|
| Interventions | Clinical guidelines issued by the American Heart Association (AHA) in 2007 for many types of invasive procedures, with recommendations for significant decreases in antimicrobial prophylaxis use | |
| Outcomes | One patient outcome: Incidence of infective endocarditis hospitalisation | |
| Notes | Unclear characteristics of participating providers Unclear level of training Funding: pg.110: Funding source: No external funding for this manuscript |
|
| Risk of bias | ||
| Bias | Authors' judgement | Support for judgement |
| Intervention independent of other changes ‐ ITS | Unclear risk | No information was provided to assess this risk. |
| Shape of Intervention effect pre‐specified ‐ ITS | Unclear risk | No information was provided to assess this risk. |
| Intervention unlikely to affect data collection ‐ ITS | Low risk | Quote, pg. 111: "We used the Healthcare Cost and Utilization Project's (HCUP) NIS, compiled by the Agency for Healthcare Research and Quality (AHRQ). The NIS is one of the largest all‐payer inpatient care databases in the United States. Weight and study design variables enable calculation of national estimates for all USA hospitalisations. Additional details of the NIS can be found elsewhere". COMMENT: the study was a retrospective study and the material was the same for pre‐ and in post‐intervention. |
| Blinding of outcome assessors (detection bias) ‐ ITS All outcomes | Unclear risk | No information was provided to assess this risk. |
| Incomplete outcome data (attrition bias) ‐ ITS All outcomes | Unclear risk | No information was provided to assess this risk. |
| Selective reporting (reporting bias) ‐ ITS | Low risk | All outcomes in the methods were reported in the results. |
| Other bias ‐ ITS | Low risk | There was no evidence of other risks of bias. |
Salzler 2017.
| Study characteristics | ||
| Methods | Study design: ITS | |
| Participants | Clinical speciality: cardiology Settings/country: inpatient/hospital setting/United States of America |
|
| Interventions | The two PEMs consisted of the publication of Centers for Medicare and Medicaid guidelines (CMSG) and the one of Carotid Revascularization Endarterectomy versus Stent Trial results (CREST). | |
| Outcomes | One process outcome: use of carotid artery stenting for high‐risk patients | |
| Notes | Unclear characteristics of participating providers Unclear level of training Funding: pg. 110: Obtained funding: Not applicable |
|
| Risk of bias | ||
| Bias | Authors' judgement | Support for judgement |
| Intervention independent of other changes ‐ ITS | Unclear risk | No information was provided to assess this risk. |
| Shape of Intervention effect pre‐specified ‐ ITS | Low risk | Quote, pg. 105: "We previously used a national database to analyze trends in CAS use in relation to the publication of the CMSG in 2008 and CREST in 2010, showing a small but statistically significant decrease in CAS use after CMSG, followed by a steady but not significant increase in the rate of CAS after the publication of CREST. In this study, we sought to further evaluate trends of CAS use in a high‐risk subset of patients, again using a national database to determine whether the publication of the CMSG and CREST affected rates of CAS. Because CMSG specifically suggested a high‐risk subset of symptomatic patients be considered for CAS, we hypothesized that rates of CAS would increase in these patients. We also sought to see whether the suggestion in CREST that CAS led to higher stroke rates would lead to changes in CAS use in high‐risk symptomatic patients." |
| Intervention unlikely to affect data collection ‐ ITS | Low risk | Intervention was independent from data collection and could not affect it. |
| Blinding of outcome assessors (detection bias) ‐ ITS All outcomes | Unclear risk | No information was provided to assess this risk. |
| Incomplete outcome data (attrition bias) ‐ ITS All outcomes | Unclear risk | No information was provided to assess this risk. |
| Selective reporting (reporting bias) ‐ ITS | Low risk | All outcomes in method are reported in result. |
| Other bias ‐ ITS | Unclear risk | COMMENT: Although a moving average was used to describe trend over the time for CAS uses, it was not clear whether for this outcome it could be considered valid and without bias. |
Santerre 1996.
| Study characteristics | ||
| Methods | Study design: ITS | |
| Participants | Physicians Clinical speciality: obstetrics and gynaecology Level of training: fully trained Setting/country: not clear/US |
|
| Interventions | In October 1988, the ACOG issued a physician practice guideline stating that a prior caesarean section was no longer a reason for performing a repeat section. | |
| Outcomes | 1 healthcare professionals' practice outcome: vaginal birth after previous caesarean section | |
| Notes | We could not recover any data from this study. Funding: Information on funding was not available. |
|
| Risk of bias | ||
| Bias | Authors' judgement | Support for judgement |
| Intervention independent of other changes ‐ ITS | Unclear risk | No information was provided to assess this risk. |
| Shape of Intervention effect pre‐specified ‐ ITS | Low risk | Quote, pg. 317: "the ACOG guideline essentially states that a previous birth by cesarean is no longer a good reason for doing one again in the future. Consequently, if guidelines are effective at altering practice patterns, a noticeable increase in the VBAC rate should be detected after 1988 when the ACOG guideline was established". |
| Intervention unlikely to affect data collection ‐ ITS | Low risk | The intervention (ACOG guidelines) did not affect either the source or method of data collection. |
| Blinding of outcome assessors (detection bias) ‐ ITS All outcomes | Low risk | The outcome was objective. |
| Incomplete outcome data (attrition bias) ‐ ITS All outcomes | Low risk | The data set came from 55 Massachusetts hospitals from 1987 to 1991. |
| Selective reporting (reporting bias) ‐ ITS | Low risk | All relevant outcomes in the methods section were reported in the results section. |
| Other bias ‐ ITS | Low risk | There was no evidence of other risks of bias. |
Shah 2014.
| Study characteristics | ||
| Methods | Study design: C‐RT Unit of allocation: practice Stratification by: health region Type of comparison: PEM only vs. nothing
|
|
| Participants | Physicians Clinical speciality: general practice/family medicine; Level of training: unclear Setting/country: general practices/Canada |
|
| Interventions | The cardiovascular disease toolkit was packaged in a brightly coloured box with CDA branding. The contents included an introductory letter from the chair of the practice guidelines' dissemination and implementation committee; an 8‐page summary of selected sections of the practice guidelines targeted towards primary care physicians; a 4‐page synopsis of the key guideline elements pertaining to cardiovascular disease risk; a small double‐sided laminated card with a simplified algorithm for cardiovascular risk assessment, vascular protection strategies, and screening for cardiovascular disease; and a pad of tear‐off sheets for patients, with a cardiovascular risk self‐assessment tool and a list of recommended risk reduction strategies. In the intervention group, the toolkit was mailed with the spring 2009 edition of Canadian Diabetes, a quarterly newsletter from the CDA that provides practical information on diagnosis and treatment issues associated with diabetes and that is sent to all primary care physicians in Canada. The content of this edition of the newsletter did not pertain to cardiovascular risk screening or treatment. Both the toolkit and Canadian Diabetes were packaged together in a large mailing envelope. The control group received Canadian Diabetes alone in its usual shrink wrap packaging, and received the toolkit with the spring 2010 edition of the newsletter. | |
| Outcomes | 1 patient health outcome: Outcome 1: Proportion of deaths or non‐fatal myocardial infarctions, from administrative databases (composite end point) 1 healthcare professionals' practice outcome: Outcome 2: Proportion of patients prescribed a statin (initiation or ongoing use), assessed by chart review |
|
| Notes | Funding: pg. 1: The study was funded by an operating grant from the Canadian Institutes for Health Research (CIHR) and the Heart and Stroke Foundation of Canada. The corresponding author (Baiju R. Shah) receives salary support from the CIHR, and previously received support from the Canadian Diabetes Association. The Institute for Clinical Evaluative Sciences (ICES) is a non‐profit research institute funded by the Ontario Ministry of Health and Long‐Term Care (MOHLTC). The opinions, results and conclusions reported in this study are those of the authors and are independent from the funding sources. The founders had no role in study design, data collection and analysis, decision to publish, or preparation of the manuscript. No endorsement by ICES or the MOHLTC is intended or should be inferred. | |
| Risk of bias | ||
| Bias | Authors' judgement | Support for judgement |
| Random sequence generation (selection bias) | Low risk | QUOTE (p. 2): “…family practices in the province of Ontario were allocated 1:1 into the intervention or control group using random number sequences generated by SAS version 9.3 (SAS Institute Inc.)”. |
| Allocation concealment (selection bias) | Low risk | QUOTE (p. 2): “An independent analyst, not otherwise involved with the study, generated the randomized list and provided it to the mailing house distributing the toolkit on behalf of the CDA.” QUOTE (p. 3): “Patients were selected using random number sequences generated by SAS version 9.3 (SAS Institute). Their charts were reviewed by a trained and experienced registered nurse, blinded to treatment allocation, who abstracted relevant data into a computerized data collection template.” |
| Baseline characteristics similar (selection bias) | Low risk | QUOTE (p. 3): "The baseline characteristics of patients and practices were well balanced (Table 1)." |
| Baseline outcome similar Outcome 1 (outcome description in table above) | Unclear risk | No baseline outcome data reported |
| Incomplete outcome data (attrition bias) Outcome 1 | Low risk | No missing data QUOTE (p.4): “Using administrative data sources to evaluate outcomes ensured complete data collection with no loss to follow up or missing data." |
| Blinding of outcome assessment (detection bias) Outcome 1 | Low risk | The outcome was objective. |
| Contamination protection (contamination bias) | Low risk | Randomisation in cluster QUOTE (p. 2): “Randomization at the practice level helped prevent contamination by ensuring that all patients seen at a single location were assigned to the same study arm.” |
| Selective reporting (reporting bias) Outcome 1 | Low risk | Outcome reporting consistent with the methods |
| Other bias | Low risk | The was no evidence of other source of bias. |
Shah 2008.
| Study characteristics | ||
| Methods | Study design: ITS | |
| Participants | Physicians Clinical speciality: not clear Level of training: fully trained Setting/country: outpatient (e.g. ambulatory care provided by hospitals/specialists)/Canada |
|
| Interventions | The PEM studied in this report was the publication "Effect of rosiglitazone on the risk of myocardial infarction and death from cardiovascular causes." New England Journal of Medicine, May 21, 2007. This meta‐analysis suggested an increased risk of myocardial infarction associated with rosiglitazone compared with active comparator or placebo. | |
| Outcomes | 1 healthcare professionals' practice outcome: number of new users of thiazolidinedione (rosiglitazone or pioglitazone) | |
| Notes | Funding: pg. 873: The study was funded by the Dean’s Fund of the University of Toronto. The corresponding author (B. R. Shah) and two co‐authors (D. N. Juurlink and P. C. Austin) are supported by the Canadian Institutes of Health Research (CIHR) and B. R. Shah is also supported by the Canadian Diabetes Association. | |
| Risk of bias | ||
| Bias | Authors' judgement | Support for judgement |
| Intervention independent of other changes ‐ ITS | High risk | Quote, pg. 873: "several other studies of cardiovascular risk with thiazolidinediones were reported throughout 2007, which may have contributed to the overall decline in their use". |
| Shape of Intervention effect pre‐specified ‐ ITS | Unclear risk | Quote, pg. 871: "we sought to determine whether physicians’ choices of glucose‐lowering medications changed in the immediate aftermath of the publication of the meta‐analysis". |
| Intervention unlikely to affect data collection ‐ ITS | Low risk | The intervention (publication of report on rosiglitazone) did not affect either the source or the method of data collection. |
| Blinding of outcome assessors (detection bias) ‐ ITS All outcomes | Low risk | The outcome was objective. |
| Incomplete outcome data (attrition bias) ‐ ITS All outcomes | Low risk | Quote, pg. 871: "we examined prescription claims in the Ontario Drug Benefits (ODB) programme database, which contains records of all prescription medications dispensed to Ontario residents aged ≥ 65 years. We restricted our analysis to people aged ≥ 66 years (approximate n = 1.5 million), purposefully excluding the first year of eligibility to avoid incomplete medication records". |
| Selective reporting (reporting bias) ‐ ITS | Low risk | All relevant outcomes in the methods section were reported in the results section. |
| Other bias ‐ ITS | Low risk | There was no evidence of other risks of bias. |
Stafford 2004.
| Study characteristics | ||
| Methods | Study design: ITS | |
| Participants | Physicians Clinical speciality: not clear Level of training: fully trained Setting/country: outpatient (e.g. ambulatory care provided by hospitals/specialists)/US |
|
| Interventions | The PEM studied in this report was the ALLHAT, published on 18 December 2002. In April 2000, the results involving the study's doxazosin mesylate arm led to early termination of this arm owing to results that indicated an increased risk associated with use of the α‐blocker doxazosin mesylate compared with diuretics. | |
| Outcomes | One healthcare professionals' practice outcome: number of α‐blockers prescriptions dispensed (both newly dispensed and refills) | |
| Notes | Funding: pg. 61: This study was supported by research grant R01‐HS013405 from the Agency for Healthcare Research and Quality. | |
| Risk of bias | ||
| Bias | Authors' judgement | Support for judgement |
| Intervention independent of other changes ‐ ITS | Unclear risk | Quote, pg. 61: "because there are multiple simultaneous influences, it is difficult to establish a primary influencing factor on the significant decline in physician prescribing of α‐blockers. Nevertheless, our findings are clearly consistent with ALLHAT early termination results having a significant impact on α‐blocker use. Declining pharmaceutical industry promotion also may have contributed further to decreased α‐blocker use. The lack of an abrupt and more pronounced decline in prescribing shortly after the ALLHAT results, however, suggests slow and potentially incomplete diffusion of information from this clinical trial". |
| Shape of Intervention effect pre‐specified ‐ ITS | Unclear risk | Quote, pg. 55: "our analytic goals were 2‐fold: to describe patterns of α‐blocker use before and after the April 2000 publication of the early ALLHAT results and to examine whether these clinical trial results or alternative influences were associated with changes in α‐blocker prescribing that occurred in this time frame". |
| Intervention unlikely to affect data collection ‐ ITS | Low risk | The intervention (publication of ALLHAT) did not affect either the source or the method of data collection. |
| Blinding of outcome assessors (detection bias) ‐ ITS All outcomes | Low risk | The outcome was objective. |
| Incomplete outcome data (attrition bias) ‐ ITS All outcomes | Low risk | Two databases were used as sources of prescribing information pre‐ and post‐intervention. Missing data, if any, were likely to be similar pre‐ and post‐intervention. |
| Selective reporting (reporting bias) ‐ ITS | Low risk | All relevant outcomes in the methods section were reported in the results section. |
| Other bias ‐ ITS | Low risk | There was no evidence of other risks of bias. |
Steffensen 1997.
| Study characteristics | ||
| Methods | Study design: CBA Type of comparison: PEM only vs. nothing |
|
| Participants | Physicians Clinical speciality: general practice/family medicine Level of training: unclear Setting/country: general practice/US |
|
| Interventions | This intervention consisted of a set of local guidelines for anticoagulant therapy, including brief information on background, individual risk estimates, and suggestions for para clinical investigations, all on one page. The guidelines comprised a supplementary page containing practical suggestions on how to initiate oral anticoagulation in general practice, as well as information about how to prepare and mail blood samples to the laboratory for monitoring of the international normalised ratio (INR). These clinical guidelines were posted as a two‐page newsletter to all GPs and hospital doctors in Viborg county in September 1994. This way of distributing information to the doctors was already established in Viborg as a new system, with GPs as advisers in hospitals concerning primary‐secondary cooperation. The newsletter is generally used to exchange information between secondary and primary health care. Five months later, in February 1995, the message was reinforced in a reminder in the local periodical for all doctors in the county. | |
| Outcomes | 1 healthcare professionals' practice outcome: prescription of oral anticoagulants, estimated from their sales | |
| Notes | Funding: pg. 214: The county of Viborg financed the meetings of the steering group. The activities of the Danish Epidemiology Science Centre are financed by a grant from the Danish National Research Foundation. | |
| Risk of bias | ||
| Bias | Authors' judgement | Support for judgement |
| Random sequence generation (selection bias) | High risk | This was a controlled before‐and‐after trial. |
| Allocation concealment (selection bias) | High risk | This was a controlled before‐and‐after trial |
| Baseline characteristics similar (selection bias) | Low risk | Quote, pg 211, "Table 1 shows the GPs' self reported data on practice characteristics in 1995." Comment: The reported baseline characteristics were similar. |
| Baseline outcome similar Outcome 1 (outcome description in table above) | High risk | Quote, pg. 212, "At baseline there was a 97% higher sale of oral anticoagulants in the intervention county than in the control county per 1000 inhabitants". |
| Incomplete outcome data (attrition bias) Outcome 1 | Unclear risk | Comment: The number of participating physicians in each group was reported as 149 (intervention) and 166 (control), but no information was provided to indicate whether this was the number at baseline or end of study, and whether any attrition due to death, retirement or movement occurred. |
| Blinding of outcome assessment (detection bias) Outcome 1 | Low risk | The outcome was objective. |
| Contamination protection (contamination bias) | Low risk | The two study groups were from different geographical regions that were not adjacent to one another (about 30 km apart). |
| Selective reporting (reporting bias) Outcome 1 | Low risk | All relevant outcomes in the methods section were reported in the results section. |
| Other bias | High risk | Quote, pg. 214 "to receive two questionnaires concerning the same limited subject may have created an awareness and in itself precipitated an attitude towards change in both counties". Also see pg. 213: "The scale of anticoagulant use in the counties thus reflects the performance of both the GPs and the hospital doctors. This might explain the parallel and large increase in anticoagulant drug use in the two counties". |
Stocks 2017.
| Study characteristics | ||
| Methods | Study design: ITS | |
| Participants | Clinical speciality: mental health/neurology Settings/country: general practice/United Kingdom |
|
| Interventions | The four PEMs consisted of the UK guidelines on antipsychotic drugs prescription (MHRA2004), the UK guidelines on antipsychotic drugs prescription (NICE2006), UK guidelines on antipsychotic drugs prescription (MHRA2009), and the UK guidelines on antipsychotic drugs prescription (CHALL).
|
|
| Outcomes | One process outcome: prescribing of antipsychotic drugs to older patients with dementia and without a psychosis diagnosis | |
| Notes | Unclear characteristics of participating providers Unclear level of training Funding: pg. 691: This study was funded by the National Institute for Health Research (http://www.nihr.ac.uk) through the Greater Manchester Primary Care Patient Safety Translational Research Centre, Grant No.gmpstrc‐2012‐1. The Medical Research Council Health eResearch Centre Grant MR/K006665/1 supported the time and facilities of one investigator (EK). The founders had no role in study design, data collection and analysis, decision to publish or preparation of the manuscript. |
|
| Risk of bias | ||
| Bias | Authors' judgement | Support for judgement |
| Intervention independent of other changes ‐ ITS | Unclear risk | No information was provided to assess this risk. |
| Shape of Intervention effect pre‐specified ‐ ITS | Unclear risk | No information was provided to assess this risk. |
| Intervention unlikely to affect data collection ‐ ITS | Low risk | Intervention was independent from data collection and could not affect it. |
| Blinding of outcome assessors (detection bias) ‐ ITS All outcomes | Unclear risk | No information was provided to assess this risk. |
| Incomplete outcome data (attrition bias) ‐ ITS All outcomes | Unclear risk | No information was provided to assess this risk. |
| Selective reporting (reporting bias) ‐ ITS | Low risk | Quote, pg. 684‐688: "See results section" COMMENT: all outcomes in the methods were reported in the results. |
| Other bias ‐ ITS | Low risk | There was no evidence of other risks of bias. |
Tsuji 2009.
| Study characteristics | ||
| Methods | Study design: C‐RT Unit of allocation: physician Stratification by: healthcare unit size and geographic location Type of comparison: PEM only vs. nothing
|
|
| Participants | Physicians Clinical speciality: general practice/family medicine Level of training: fully trained Setting/country: general practice/Brazil |
|
| Interventions | The PEM studied in this report was a depression‐specific guide, adapted from rigorous, previously published guidelines, which provided brief and objective educational information regarding the effects of depression on patient daily living, strategies for improving adherence to treatment, and guidelines for therapeutic management using standardised antidepressants in primary care. | |
| Outcomes | 1 healthcare professionals' practice outcome: prescription of an antidepressant at the first appointment with the clinician 1 patient health outcome: clinical remission (proportion of patients with depression severity of less than 8 points on Hamilton Rating Scale for Depression Severity) |
|
| Notes | Funding: Information on funding was not available. | |
| Risk of bias | ||
| Bias | Authors' judgement | Support for judgement |
| Random sequence generation (selection bias) | Unclear risk | No information was provided to assess this risk. |
| Allocation concealment (selection bias) | Low risk | COMMENT: the unit of allocation was by physician and allocation was performed on all units at the start of the study. |
| Baseline characteristics similar (selection bias) | Low risk | Quote, pg. 223: "clinician and patient baseline characteristics were comparable in the experimental and control groups (Tables 1 and 2)". |
| Baseline outcome similar Outcome 1 (outcome description in table above) | Unclear risk | Baseline outcomes were not reported for this RT. |
| Incomplete outcome data (attrition bias) Outcome 1 | Low risk | Quote, pg. 223: "dichotomous end points (withdrawals, appropriate treatment and 16‐week clinical remission) were analyzed using the adjusted chi‐square approach." Withdrawals were quantified by group and reason, quote. pg. 223: "There were a total of 36 study withdrawals, 13 (10.8%) in the intervention arm and 23 (20.2%) in the usual care arm (intracluster coefficient correlation = 0.032, P = 0.153). Nine subjects (7.5%) in the intervention arm and 19 (16.7%) in the usual care arm withdrew (P = 0.122). Eight subjects, four (3.3%) in the intervention arm and four (3.5%) in the usual care arm, worsened and were withdrawn (P = 0.949)". |
| Blinding of outcome assessment (detection bias) Outcome 1 | Low risk | Quote, pg. 222: "investigators were blind to the treatment assignment of the clinicians and to which clinician the patient was assigned" and, "16‐week depression severity, as measured by the HAM‐D scale, was evaluated at a mental health facility by two independent evaluators who were blind to treatment allocation". |
| Contamination protection (contamination bias) | Low risk | Quote, pg. 222: "to avoid cross‐contamination of clinicians, sensitization of patients and for administrative reasons, eight clinicians were stratified by basic healthcare unit size and geographical area and randomized to use either usual care or a treatment guide in treating depression". |
| Selective reporting (reporting bias) Outcome 1 | Low risk | All relevant outcomes in the methods section were reported in the results section. |
| Other bias | Low risk | There was no evidence of other risks of bias. |
Tziraki 2000.
| Study characteristics | ||
| Methods | Study design: C‐RT Unit of allocation: Practices Stratification by the 14 health regions into which responsibility for health care delivery in Ontario is divided. Type of comparison: PEM only vs. nothing
|
|
| Participants | Physicians Clinical specialty: General practice/family medicine Level of training: Fully trained Setting/country: General practices/US |
|
| Interventions | The PEM was a nutrition manual designed by the National Cancer Institute (NCI) to guide primary care practices in structuring their office environment and routine visits. The manual was modelled after the NCI publication “How to Help Your Patients Stop Smoking: A National Cancer Institute Manual for Physicians” and used to enhance nutrition screening, advice/referral, and follow‐up for cancer prevention. It was designed to address physician‐related determinants of nutrition behavior, such as knowledge of cancer and nutrition and brief counselling techniques, as well as system‐related determinants, such as office organization, material resources, and staff training. The manual included the following components: (1) the rationale for nutritional assessment and intervention by primary care physicians; (2) the rationale for and the mechanisms of organizing the office environment, office staff, and physical setting in a way that will help patients improve their eating habits; (3) advice on how to screen patients’ current eating habits and diet‐related cancer risk factors; (4) advice on how to plan effective interventions, such as providing dietary advice and follow‐up to help patients successfully improve their eating habits; (5) advice on when and how to make referrals to dietitians or other related health professionals; (6) tip sheets and articles for patients, including ethnic minorities; and (7) samples of government nutrition education materials. Although the manual stressed the role of nutrition in cancer prevention, its recommendations and educational material were consistent with the role of nutrition in the prevention of major chronic diseases. | |
| Outcomes | 4 healthcare professionals' practice outcomes: Outcome 1: Level of compliance to the nutrition manual; extent to which the office was organised to provide nutrition information and promote nutrition‐related activities (office organisation); range from 0‐12, and then transformed to percentages Outcome 2: Level of compliance to the nutrition manual; extent to which the practice performed nutrition screening (nutrition screening); range from 0‐22, and then transformed to percentages Outcome 3: Level of compliance to the nutrition manual; extent to which the practice provided nutrition advice or referral for their patients (nutrition advice/referral); range from 0‐13, and then transformed to percentages Outcome 4: Level of compliance to the nutrition manual; extent to which the practice supported and monitored patients in making changes in their nutrition‐related behaviours (patient follow‐up); range from 0‐5, and then transformed to percentages |
|
| Notes | Funding: Information on funding was not available. | |
| Risk of bias | ||
| Bias | Authors' judgement | Support for judgement |
| Random sequence generation (selection bias) | Low risk | A computer random number generator was used for the random assignment of the physician practices to the three treatment/intervention groups. QUOTE: (p. 156): “The study design consisted of a random assignment of primary care physician practices recruited from Pennsylvania and New Jersey to one of three intervention groups:…” |
| Allocation concealment (selection bias) | High risk | Blinding was not possible because of the nature of the treatment/intervention. It was obvious to each practice as to what treatment they were assigned. |
| Baseline characteristics similar (selection bias) | Low risk | QUOTE (p. 158): “The three intervention groups were similar with respect to the designated physicians’ gender, ethnicity, prior nutrition education, and training in nutrition counseling (Table 2). Thus, the groups remained comparable, despite differential interview rates among them.” |
| Baseline outcome similar Outcome 1 (outcome description in table above) | Unclear risk | No information was provided to assess this risk. |
| Incomplete outcome data (attrition bias) Outcome 1 | Unclear risk | Insufficient information to make an assessment |
| Blinding of outcome assessment (detection bias) Outcome 1 | Low risk | QUOTE (p. 158): “The interviewers were blinded to the intervention group assignments of the practices.” |
| Contamination protection (contamination bias) | Low risk | Randomisation in clusters |
| Selective reporting (reporting bias) Outcome 1 | Low risk | Outcome reporting consistent with the methods |
| Other bias | Low risk | There was no evidence of other risks of bias. |
Ulbricht 2014.
| Study characteristics | ||
| Methods | Study design: RT Unit of allocation: Physicians Type of comparison: PEM only vs. active control Groups considered in review: A and B
|
|
| Participants | Physicians Clinical specialty: General practice/family medicine Level of training: Unclear Setting/country: Private general practices/Germany |
|
| Interventions | The PEM studied in this report was an educational manual (EM) used to advise general practitioners (GPs) on how to manage patients who may have problems with psychotropic prescription drug use, especially with regards to assessment, referral, and treatment. The EM was a coloured booklet of 54 pages addressing problematic psychotropic drug use. It targeted the management of prescription drug abuse (PDA) and prescription drug dependence (PDD), and focused more particularly on the following drug groups: sedatives, hypnotics, analgesics, and psychostimulants. The following chapters were included: introduction; addressing, recognising, and diagnosing PDA and PDD; an overview of drug agents; raising awareness in and motivating affected patients; and instructions for psychotropic drug detoxification and subsequent treatment of PDD. | |
| Outcomes | 6 healthcare professionals' practice outcomes: Outcome 1: Proportion of GPs who assessed patients for psychotropic prescription drug abuse, assessed by phone interview with GP Outcome 2: Mean number of patients assessed for psychotropic prescription drug abuse, assessed by phone interview with GP Outcome 3: Proportion of GPs who referred patients because of psychotropic prescription drug dependence, assessed by phone interview with GP Outcome 4: Mean number of patients referred because of psychotropic prescription drug dependence, assessed by phone interview with GP Outcome 5: Proportion of GPs who treated patients for psychotropic prescription drug dependence, assessed by phone interview with GP Outcome 6: Mean number of patients treated for psychotropic prescription drug dependence, assessed by phone interview with GP |
|
| Notes | Funding: Information on funding was not available. | |
| Risk of bias | ||
| Bias | Authors' judgement | Support for judgement |
| Random sequence generation (selection bias) | Low risk | A computer random number generator QUOTE (p. 86): “A random sample of GPs was drawn from the data files of the 17 Associations of Statutory Health Insurance Physicians (Kassenärztliche Vereinigung) Germany.” |
| Allocation concealment (selection bias) | Low risk | Central allocation (including telephone, web‐based and pharmacy‐controlled randomisation) |
| Baseline characteristics similar (selection bias) | Low risk | Information in text but no table provided QUOTE (p. 88): “The characteristics did not differ between the study groups.” |
| Baseline outcome similar Outcome 1 (outcome description in table above) | Unclear risk | QUOTE (p. 90): "A second limitation of this study was the absence of a baseline measurement." |
| Incomplete outcome data (attrition bias) Outcome 1 | Unclear risk | Information was missing to assess this risk. QUOTE (p. 87): “the EM prior to the study (n = 77) were also excluded. The participation rate within the study groups did not differ in terms of gender in the IG but in the CG. Females in the CG participated more likely (sic) in the study than males (63.3% vs. 56.3% chi2 = 4.29, p = 0.038).” |
| Blinding of outcome assessment (detection bias) Outcome 1 | Low risk | The outcome was objective. |
| Contamination protection (contamination bias) | High risk | Randomisation was not by clusters. Contamination was likely. |
| Selective reporting (reporting bias) Outcome 1 | Low risk | Outcome reporting consistent with the methods |
| Other bias | Low risk | There was no evidence of other source of bias. |
Wang 2005.
| Study characteristics | ||
| Methods | Study design: ITS | |
| Participants | Physicians Clinical speciality: general practice/family medicine Level of training: fully trained Setting/country: outpatient (e.g. ambulatory care provided by hospitals/specialists)/US |
|
| Interventions | Two PEMs were studied in this report. The ADA guidelines published in January 1998 advocated an LDL cholesterol goal below 100 mg/dL for patients with diabetes. The second PEM was the third report entitled ATP III published by the National Cholesterol Education Program Expert Panel on Detection, Evaluation, and Treatment of High Blood Cholesterol in Adults (May 2001) that designated diabetes as a CHD risk equivalent, with the same LDL cholesterol goal of under 100 mg/dL. | |
| Outcomes | 2 healthcare professionals' practice outcomes:
|
|
| Notes | We planned to look at the combined effect of the 2 PEMs because of a lack of data to look at them separately. In this case, the 2 PEMs studied were very similar, and we characterised them as a whole (i.e. 1 PEM). In the end, we could not recover any data from this study. Funding: pg. 2943: This research was supported by AstraZeneca Pharmaceuticals (Y.R.W.), the MacLean Center for Clinical Medical Ethics at the University of Chicago (G.C.A.), and the Centers for Disease Control, Chicago Center of Excellence in Health Promotion Economics (1 P30 CD000147‐01 to D.O.M.). |
|
| Risk of bias | ||
| Bias | Authors' judgement | Support for judgement |
| Intervention independent of other changes ‐ ITS | Unclear risk | No information was provided to assess this risk. |
| Shape of Intervention effect pre‐specified ‐ ITS | Unclear risk | Quote, pg. 2942: "The publication of the ADA and ATP III guidelines provides an opportunity to assess the effect of guideline changes on LDL cholesterol reporting and control for diabetes visits". |
| Intervention unlikely to affect data collection ‐ ITS | Low risk | The interventions (ADA guidelines and ATP III guidelines) did not affect either the source or the method of data collection. |
| Blinding of outcome assessors (detection bias) ‐ ITS All outcomes | Low risk | The outcome was objective. |
| Incomplete outcome data (attrition bias) ‐ ITS All outcomes | Low risk | Quote, pg. 2942: "we used the National Disease and Therapeutic Index (NDTI), an ongoing survey of U.S. office‐based physicians conducted by IMS Health providing nationally representative diagnostic and treatment data, to analyze the national trends of LDL cholesterol reporting and control for diabetes and CHD visits by year between 1995 and 2004". |
| Selective reporting (reporting bias) ‐ ITS | Low risk | All relevant outcomes in the methods section were reported in the results section. |
| Other bias ‐ ITS | Low risk | There was no evidence of other risks of bias. |
Watson 2001.
| Study characteristics | ||
| Methods | Study design: C‐RT Unit of allocation: practices Stratification by: size (number of GPs) and fund holding status Type of comparison: PEM only vs. nothing. We reviewed comparison group A and B as defined here:
|
|
| Participants | Physicians Clinical speciality: general practice/family medicine Level of training: fully trained Setting/country: general practice/UK |
|
| Interventions | The PEM studied in this report was a locally developed guideline for the use of PO NSAIDs in the management of musculoskeletal disorders. NSAIDs were selected as the subject of the guidelines because they are associated with high volume and cost prescribing, significant morbidity and mortality, and considerable variation in practice. The guidelines were developed to promote awareness of NSAID prescribing issues and were informed by literature reviews of their relative effectiveness and safety. | |
| Outcomes | 1 healthcare professionals' practice outcome: prescription of 3 recommended NSAIDS relative to total NSAID prescribing (mean in all practices) (%) | |
| Notes | Funding: pg. 212: The corresponding author (Margaret Watson) was funded by a South West Regional Health Authority R&D Training Studentship. Mr T.Beswick (Regional Pharmaceutical Adviser) provided funding for pharmacist training. | |
| Risk of bias | ||
| Bias | Authors' judgement | Support for judgement |
| Random sequence generation (selection bias) | Low risk | Quote (MC Watson, PhD Thesis), pg. 89‐90: "randomization commenced with the blinded selection of one of these cards. The practice undergoing randomization was then allocated to the study group corresponding to the number on the card. The second practice was then randomized to the group on the second selected card (without replacement of the first card), and so on". |
| Allocation concealment (selection bias) | Low risk | COMMENT: the unit of allocation was by practice and allocation was performed on all units at the start of the study. |
| Baseline characteristics similar (selection bias) | Low risk | Quote, pg. 210: "the 20 participating practices did not differ appreciably from other practices in Avon in terms of size or dispensing status, although fewer had fund holding status (Table 1)". COMMENT: the baseline characteristics of the intervention and control groups were reported and similar. |
| Baseline outcome similar Outcome 1 (outcome description in table above) | Low risk | Quote, pg. 209: "analysis of covariance adjusting for baseline was performed using Stata". |
| Incomplete outcome data (attrition bias) Outcome 1 | Low risk | COMMENT: missing outcome measures were unlikely to bias the results because a registry was used in its entirety. |
| Blinding of outcome assessment (detection bias) Outcome 1 | Low risk | The outcome was objective. |
| Contamination protection (contamination bias) | Low risk | Quote, pg. 208: "practices in Avon, England, that used the Egton Medical Information Systems Ltd (EMIS) computer system (n = 51) were invited to participate. Of these, 20 (39%) were randomized". |
| Selective reporting (reporting bias) Outcome 1 | Low risk | All relevant outcomes in the methods section were reported in the results section. |
| Other bias | Low risk | No information was provided to assess this risk. |
Weaver 2016.
| Study characteristics | ||
| Methods | Study design: C‐RT Unit of allocation: Practices Type of comparison: PEM only vs. nothing OR other Intervention, considering the groups A and D as described here:
|
|
| Participants | Physicians Clinical specialty: General practice/family medicine Level of training: Unclear Setting/country: Stationary primary healthcare (PHCs)/Australia |
|
| Interventions | The PEM was a paper‐based continuing medical education handout on sexually transmitted infections (STIs), organised in 6 modules. The modules were organised around clinical cases based on several recent reviews that concluded that interactive training was more effective than a didactic approach. Each module was designed to be completed in 1 hour. Participants received two modules per week for 3 weeks, for a total of six modules. | |
| Outcomes | 5 healthcare professionals' practice outcomes: Outcome 1: Proportion of completed visits for which Sexually Transmitted Infections (STI) management tasks were completed during an unannounced SP encounter ‐ correct medication offer Outcome 2: Proportion of completed visits for which Sexually Transmitted Infections (STI) management tasks were completed during an unannounced SP encounter ‐ HIV test offer Outcome 3: Proportion of completed visits for which Sexually Transmitted Infections (STI) management tasks were completed during an unannounced SP encounter ‐ condoms provision Outcome 4: Proportion of completed visits for which Sexually Transmitted Infections (STI) management tasks were completed during an unannounced SP encounter ‐ provision of partner notification slips Outcome 5: Proportion of completed visits for which Sexually Transmitted Infections (STI) management tasks were completed during an unannounced SP encounter ‐ offer of a genital exam |
|
| Notes | Funding: pg. 140‐141: This study and the activities detailed were developed and conducted by the University of Washington and I‐TECH with funding from Cooperative Agreement U91HA06801‐06‐00 from the US Department of Health and Human Services, Health Resources and Services Administration (HRSA). The developers of REDCap were supported by grant UL1 RR025014 from National Center for Research Resources of the US Department of Health and Human Services, National Institutes of Health. | |
| Risk of bias | ||
| Bias | Authors' judgement | Support for judgement |
| Random sequence generation (selection bias) | Low risk | A computer random number generator QUOTE (p. 138): “Forty PHC clinics were randomised to four parallel arms (1:1:1:1 balance): arm 1 was control, arm 2 was lecture, arm 3 was computer and arm 4 was paper‐based. Sites were randomised in strata to control for two characteristics of PHC clinics: subdistrict and operating hours, meaning 24 h services versus fewer hours. The randomisation was conducted on 30 September 2013 before the pre‐training SP visits and knowledge tests.” |
| Allocation concealment (selection bias) | High risk | The staff and participants were not blinded during the data collection nor interventions. |
| Baseline characteristics similar (selection bias) | Unclear risk | Insufficient information QUOTE (p. 138): “Total number of SP encounters and number of visits by individual SPs were similar across arms and time periods because of their balanced distributIion." |
| Baseline outcome similar Outcome 1 (outcome description in table above) | High risk | QUOTE (p. 138): “Despite the random assignment of PHC clinics to arms, there were differences in percentages of tasks completed across arms before training.” |
| Incomplete outcome data (attrition bias) Outcome 1 | Unclear risk | Insufficient information to make assessment QUOTE (p. 138): “Scores were missing for 37 of 240 clinic modules for the post‐test compared with 10 for the pre‐test.” |
| Blinding of outcome assessment (detection bias) Outcome 1 | Low risk | The outcome was objective. |
| Contamination protection (contamination bias) | Low risk | Contamination not likely: randomsation in clusters |
| Selective reporting (reporting bias) Outcome 1 | Low risk | Outcome reporting consistent with the methods |
| Other bias | Low risk | There was no evidence of other source of bias. |
Weiner 2017.
| Study characteristics | ||
| Methods | Study design: ITS | |
| Participants | Physicians (including residents) Clinical speciality: emergency medicine Level of training: Mixture of people who were in training and fully trained Settings/country: inpatient/hospital setting/United States of America |
|
| Interventions | Opioid prescribing guidelines, that encouraged emergency physicians to check Ohio’s prescription drug monitoring programme, the Ohio Automated Rx Reporting System, to determine whether a patient has other prescriptions for controlled medications; urged prescribers to limit the quantity of opioids prescribed, writing for no more than a 3 days’ supply; and encouraged providers to refer patients to a primary care provider or specialist for evaluation, treatment, and monitoring of continuing pain (Appendix E1, available online at http://www.annemergmed.com). Emphasis was also placed on educating patients about the risks and limited benefits of opioids. The guidelines were released with extensive publicity, and the Ohio chapter of the American College of Emergency Physicians, the Ohio State Medical Association, and the Ohio Hospital Association were among 9 organisations that endorsed and promulgated the document. | |
| Outcomes | One process outcome: total number of opioid prescriptions per month by emergency physicians | |
| Notes | Funding: Information on funding was not available. | |
| Risk of bias | ||
| Bias | Authors' judgement | Support for judgement |
| Intervention independent of other changes ‐ ITS | Unclear risk | No information was provided to assess this risk. |
| Shape of Intervention effect pre‐specified ‐ ITS | Low risk | Quote, pg. 800: "The goal of this study is to determine whether the introduction of ED prescribing guidelines in Ohio in April 2012 was associated with a decline in the total number of opioid prescriptions by emergency physicians in the entire state. Using an interrupted time series analysis of data from the Ohio Prescription Drug Monitoring Program, we evaluated multiple years of emergency physician opioid prescribing before and after guideline implementation to determine the effect on the statewide number of opioid prescriptions and total morphine milligram equivalents written by emergency physicians, the number of prescriptions of individual types of opioids, and the number of prescriptions for greater than a 3 days’ supply of opioids." |
| Intervention unlikely to affect data collection ‐ ITS | Low risk | COMMENT: The study was a retrospective study and material was the same pre‐ and post‐intervention. |
| Blinding of outcome assessors (detection bias) ‐ ITS All outcomes | Unclear risk | No information was provided to assess this risk. |
| Incomplete outcome data (attrition bias) ‐ ITS All outcomes | Unclear risk | COMMENT: some excluded observations due to erroneous data, yet no clear statement on how missing data were handled nor on the impact or of excluded observations |
| Selective reporting (reporting bias) ‐ ITS | Low risk | COMMENT: All outcomes mentioned in the methods were reported in the results. |
| Other bias ‐ ITS | Low risk | There was no evidence of other risks of bias. |
Weiss 2011.
| Study characteristics | ||
| Methods | Study design: ITS | |
| Participants | Physicians, pharmacists Clinical speciality: general practice/family medicine Level of training: guidelines were distributed both to physicians and to residents in training, but prescribing data collected could only be from fully trained physicians. Setting/country: outpatient (e.g. ambulatory care provided by hospitals/specialists)/Canada |
|
| Interventions | In 2004, the Quebec Medication Council (Conseil du Medicament du Québec, Quebec City), with the help of designated physicians and pharmacists, issued a first series of guidelines targeting the most common infectious conditions in the outpatient setting. Eleven 2‐page highly graphic guidelines providing clinical information (diagnosis, investigation) and antibiotic recommendations were published and sent to all physicians (including medical residents) and pharmacists in January 2005. Emphasis was placed not only on proper antibiotic regimens, but also on not using antibiotics when viral infections were suspected and on prescribing the shortest possible duration of treatment. A letter signed by all key stakeholders in Quebec (Minister of Health, College of Physicians, College of Pharmacists, and medical associations) accompanied the initial mailing explaining the reasons behind the initiative and the importance of prescribing antibiotics appropriately. The main objective of this study was to assess the impact of a multi‐pronged, mostly Web‐based education strategy on the per capita number and cost of antibiotic prescriptions in the province of Quebec, and to compare the trends with those in the other 9 Canadian provinces. | |
| Outcomes | One process outcome: monthly number of prescriptions/1000 inhabitants for all antibiotics in Quebec relative to the rest of Canada | |
| Notes | Funding: pg. 6‐7: The corresponding author (Karl Weiss) received research grants from Abbott, Bayer Health Care, GlaxoSmithKlinie, Merck, Optimer Pharma, Pfizer, Roche, and Valorisation Recherche Quebec, Government of Canada, and has received payment for consulting work from Pfizer. A co‐author (Regis Blais) received research grants from the Canadian Institute of Health Research. | |
| Risk of bias | ||
| Bias | Authors' judgement | Support for judgement |
| Intervention independent of other changes ‐ ITS | High risk | Quote, pg. 6: "this study has a number of limitations; we did not take into account samples given to physicians, but they represent a very small percentage of the total amount of antibiotics, and filling an antibiotic prescription at a community pharmacy does not guarantee that the patient will finish the entire treatment. The Quebec antibiotic guidelines were produced in a period when health care professionals, government authorities, and perhaps the population as a whole were highly aware of the risks associated with antibiotic overuse (C. difficile infections). Thus, external factors besides the guidelines themselves may have influenced antibiotic prescribing practices". |
| Shape of Intervention effect pre‐specified ‐ ITS | Unclear risk | No information was provided to assess this risk. |
| Intervention unlikely to affect data collection ‐ ITS | Low risk | The intervention (education guidelines) did not affect either the source or the method of data collection. |
| Blinding of outcome assessors (detection bias) ‐ ITS All outcomes | Low risk | The outcome was objective. |
| Incomplete outcome data (attrition bias) ‐ ITS All outcomes | Unclear risk | Quote, pg. 2: "the province of Quebec, Canada (2009 population, 7.8 million) has a universal health care insurance program in which medical visits, required investigations, and treatments (whether outpatient or inpatient) are provided free of charge to all citizens. In 1997, the Quebec government instituted a universal drug plan in which everybody has to be covered by either private insurance obtained through his or her employer (57% of the population) or by the public plan (43% of the population). Other provinces have similar drug plans, but not as extensive as that in Quebec". COMMENT: data for Quebec were likely to be complete, but no information was specified for the other provinces. |
| Selective reporting (reporting bias) ‐ ITS | Low risk | All relevant outcomes in the methods section were reported in the results section. |
| Other bias ‐ ITS | Low risk | There was no evidence of other risks of bias. |
Zwarenstein 2014.
| Study characteristics | ||
| Methods | Study design: C‐RT Unit of allocation: Practice Type of comparison: PEM#1 vs. PEM#1 plus PEM #2 and PEM #3, as described in groups A and D below:
|
|
| Participants | Physicians Clinical specialty: General practice/family medicine Level of training: Unclear Setting/country: Family medicine practices/Canada |
|
| Interventions | The PEMs were designed to help family physicians increase retinal screening of patients with diabetes. The Informed newsletter was a free, peer‐reviewed, evidence‐based primary care practice synopsis designed and used as the basic material. It was written and produced by clinical and research staff from the Institute for Clinical Evaluative Sciences (ICES, www.ices.on.ca) (an internist, two family physicians, and two knowledge translation researchers), and a communications consultant. In addition to Informed, two types of PEM were designed to address the identified evidence‐practice gap: (1) the outsert was a short, directive, evidence‐based PEM on a postcard‐sized card stapled to the front page of the Informed newsletter, and (2) the insert was a two‐page insert, indistinguishable from the rest of Informed in size and style, which provided the same directive statements as the outsert, but included more background, a summarised evidence‐based guideline, and references. The authors also designed a pad of take‐home reminders for patients, to remind them to make an appointment for an eye exam. The pad was meant to be distributed by the family physician. Participating practices were randomly assigned to one of four intervention groups. The two intervention groups selected to receive an outsert were further randomly divided into two subgroups, one of which received the patient reminder notepad, and the other which did not. | |
| Outcomes | 1 healthcare professionals' practice outcome: Outcome 1: Percentage of patients obtaining retinal screening within 90 days of mail out |
|
| Notes | Funding: pg. 8: This study was funded by the Canadian Institutes for Health Research, under grant 724180703. The Canadian Institutes of Health Research had no role in the design and conduct of the study; collection, management, analysis and interpretation of the data; or in the preparation, review or approval of the manuscript. This study was also supported by the Institute for Clinical Evaluative Sciences (ICES), which is funded by an annual grant from the Ontario Ministry of Health and Long‐Term Care (MOHLTC). The opinions, results and conclusions reported in this paper are those of the authors and are independent from the funding sources. No endorsement by ICES or the Ontario MOHLTC is intended or should be inferred.. | |
| Risk of bias | ||
| Bias | Authors' judgement | Support for judgement |
| Random sequence generation (selection bias) | Low risk | QUOTE (p. 2): "Practices were randomly assigned to an intervention group by the study statistician, using computer generated random numbers." |
| Allocation concealment (selection bias) | Unclear risk | No information was provided to assess this risk. |
| Baseline characteristics similar (selection bias) | Low risk | QUOTE (p. 5): "There were small, clinically unimportant, differences between the demographics of patients with diabetes who paid a visit to a study physician and those who did not, and between those who were and were not included in the analysis (Table 2). [...] There were no meaningful physician differences among the intervention groups (Table 3)." |
| Baseline outcome similar Outcome 1 (outcome description in table above) | Unclear risk | No information was provided to assess this risk. |
| Incomplete outcome data (attrition bias) Outcome 1 | Unclear risk | Difficult to assess considering lack of information |
| Blinding of outcome assessment (detection bias) Outcome 1 | Low risk | Objective outcome + use of administrative data |
| Contamination protection (contamination bias) | Low risk | Randomisation by cluster (practice level) QUOTE: "To prevent contamination (sharing of information among doctors in group practice) we randomised at the level of the practice. FPs were placed into practices on the basis of a shared street address." |
| Selective reporting (reporting bias) Outcome 1 | Low risk | All relevant outcomes in the methods section were reported in the results section. |
| Other bias | Low risk | The was no evidence of other source of bias. |
Zwarenstein 2016.
| Study characteristics | ||
| Methods | Study design: C‐RT Unit of allocation: practices Type of comparison: [PEM #1] vs. [PEM #1 + PEM #2 + PEM #3], as described in groups A and D below:
|
|
| Participants | Physicians Clinical speciality: general practice/family medicine Level of training: not clear Setting/country: Family medicine practices/Canada |
|
| Interventions | The authors aimed to conduct 3 replicates of the trial to cover the 3 evidence‐practice gaps over a 9‐month period (3 successive mail outs of Informed). They planned to test the effects of short (directive) and long (discursive) PEMs compared with no PEM on the clinical practices of primary care physicians, and on related patient outcomes. In the first replicate (ACE inhibitors, hypertension treatment, and cholesterol‐lowering agents for diabetes), the first intervention group received a copy of Informed with both the short, directive, evidence‐based outsert stapled to the lower‐left quarter of the front page, and the longer 2‐page insert focusing on the same topic as the outsert. The second intervention group received an identical issue of Informed, with only the above‐mentioned outsert. The third intervention group received an identical copy of Informed with the above‐mentioned insert. The control group received the identical Informed only, without the insert or the outsert. The healthcare topic shared by the insert and outsert was not covered elsewhere in that particular issue of Informed. For the second replicate (retinal screening in patients with diabetes), in addition to the short, directive outsert and the longer, explanatory insert, a reminder note was included, which physicians could give to their patients to supplement the verbal reminder that physicians are encouraged to give. Because it was not clear whether this patient‐held reminder to make an appointment with their eye‐care provider was any more effective than the verbal reminder that physicians are encouraged to give, those physicians receiving an outsert to receive a pad of the patient‐aimed reminder slips were randomised. For the third replicate (using thiazides as first‐line treatment for hypertension), 2 different, short, directive outsert messages were used (in addition to the long, explanatory insert message). The OPEM team developed the first outsert message, whereas a team of psychologists with experience in knowledge implementation and the use of psychological theories developed the second outsert message. With the addition of a theory‐based outsert, it was possible to determine whether a message based on psychological theory, specifically on the Theory of Planned Behaviour, is more effective in changing clinical behaviour towards more evidence‐based practice than a message based on standard methods, which are uninformed by an explicit theoretical basis. | |
| Outcomes | 1 healthcare professionals' practice outcome: Outcome 1: Percentage of patients aged over 65 and newly diagnosed with hypertension who were prescribed a thiazide as the sole initial prescription medication |
|
| Notes |
Funding: pg. 10: This study was also supported by the Institute for Clinical Evaluative Sciences (ICES), which is funded by an annual grant from the Ontario Ministry of Health and Long‐Term Care (MOHLTC). The opinions, results and conclusions reported in this paper are those of the authors and are independent from the funding sources. No endorsement by ICES or the Ontario MOHLTC is intended or should be inferred. (Canadian Institutes of Health Research, award number 724180703) The Canadian Institutes of Health Research had no role in the design and conduct of the study; collection, management, analysis and interpretation of the data; or in the preparation, review or approval of the manuscript. |
|
| Risk of bias | ||
| Bias | Authors' judgement | Support for judgement |
| Random sequence generation (selection bias) | Low risk | QUOTE (p. 5): "'Practices were randomly assigned to one of six intervention groups by the study statistician (see Table 1), using computer‐generated random numbers." |
| Allocation concealment (selection bias) | Low risk | QUOTE (p. 5): "Patient and physician participants were unaware of allocation and administrative data were collected without knowledge of the research under way." |
| Baseline characteristics similar (selection bias) | Low risk | QUOTE (p. 7): "There were small, statistically significant but clinically unimportant, differences between the characteristics of the physicians in the six intervention groups (Table 4)." |
| Baseline outcome similar Outcome 1 (outcome description in table above) | Low risk | QUOTE (p. 7): "There were small, statistically significant but clinically unimportant, differences between the characteristics of the physicians in the six intervention groups (Table 4)." In Table 4, the baseline % for patients newly treated for hypertension started on only a thiazide was globally similar in groups (P = 0.69). |
| Incomplete outcome data (attrition bias) Outcome 1 | Unclear risk | No information was provided to assess this risk. |
| Blinding of outcome assessment (detection bias) Outcome 1 | Low risk | Objective outcome: use of administrative data. QUOTE (p. 11): ''Another strength of the study was the use of administrative data, which allowed us to examine the impact of our interventions across the full spectrum of physicians and patients in Ontario." |
| Contamination protection (contamination bias) | Low risk | Randomisation in clusters, the practice being the unit of allocation |
| Selective reporting (reporting bias) Outcome 1 | Low risk | Outcome reporting consistent with the methods section |
| Other bias | Low risk | The was no evidence of other sources of bias. |
4D: Der Deutsche Diabetes Dialyse Studie 4H: 4‐hour 4S: Scandinavian Simvastatin Survival Study AAP: ACC: American College of Cardiology ACE: angiotensin‐converting enzyme ACEI: ACOG: American College of Obstetricians and Gynecologists ACS: acute coronary syndrome ADA: American Diabetes Association AGREE: Appraisal of Guidelines for Research and Evaluation AF: AHA: American Heart Association AHRQ: ALLHAT: Antihypertensive and Lipid‐Lowering Treatment to Prevent Heart Attack Trial AMI: ANAES: Agence Nationale d'Accréditation et d'Evaluation en Santé ARB: ARNI: ARTI: ASA: aspirin ATP: Adult Treatment Panel AUC: BCS: BMI: BP: blood pressure BPSD: BSR: CALD: CAS: CBA: CDA: CG: CHALL: CHD: coronary heart disease CLABSI: CME: continuing medical education CMSG: COX‐2: CPRD: CR: C‐RT: cluster randomised controlled trial CREST: csDMARD: CVD: DAS: DBP: DDD: DMARD: DTC: ED: EHC‐OM: EHRS: EM: EMIS: EMR: ENT: ERT: oestrogen replacement therapy ES: effect size ESC: FDA: FENTA: FN: FP: GDR: GP: general practitioner GWTG‐HF: HAI: HAM‐D: HCL: HCUP: HDFP: HERS: Heart and Estrogen/progestin Replacement Study HIV: HOPE: Heart Outcomes and Prevention Evaluation HRT: hormone replacement therapy HT: hormone therapy IBS: irritable bowel syndrome ICES: ICU: intensive care unit IG: IHD: ischaemic heart disease IMS: INR: INSPQ: ISD: ITS: interrupted time series IV: intravenous J01: LDL: low‐density lipoprotein LIFE: Losartan Intervention for Endpoint LMWH: low molecular weight heparin MCS: MHRA2004: MHRA2009: MIRACL: Myocardial Ischemia Reduction with Acute Cholesterol Lowering MPI: MRSA: MTX: NANDA‐1: NCI: NDTI: National Disease and Therapeutic Index NEJM: New England Journal of Medicine NHS: National Health Service (UK) NIC: NICE: National Institute for Health and Clinical Excellence NIS: NOAC: NOC: NPA: National Prescription Audit Plus NPI‐Q: NRMI: NRT: NS: NSAID: non‐steroidal anti‐inflammatory drug ODB: Ontario's universal Drug Benefit programme OME: OPEM: OXY: PBRN: PCS: PDA: PDD: PDF: PED: PEM: printed educational material pg: PHC: PICOT: PN: PO: oral PROPO: PROVE IT‐TIMI22: Pravastatin or Atorvastatin Evaluation and Infection Therapy– Thrombolysis In Myocardial Infarction 22 RA: RALES: Randomized Aldactone Evaluation Study RCR: Royal College of Radiologists RT: randomised trial REVERSAL: Reversal of Atherosclerosis With Aggressive Lipid Lowering SES: SF‐36: SIGN: SNCP: SNL: SP: SPIN: SSRI: selective serotonin reuptake inhibitor STEMI: ST‐elevation myocardial infarction STI: TA: TBI: THR: total hip replacement TKR: total knee replacement TNFi: UA: UBH: United Behavioral Health VA: Veterans Administration VALUE: Valsartan Anti‐hypertensive Long‐term Use Evaluation VBAC: vaginal births after caesarean VHA: vs.: versus WHI: Women's Health Initiative
Characteristics of excluded studies [ordered by study ID]
| Study | Reason for exclusion |
|---|---|
| Croudace 2003 | The comparison studied was not included: multifaceted intervention comprising PEM + educational meeting vs. usual care |
| Emslie 1993 | The comparison studied was not included: PEM + reminder vs. usual care |
| Engers 2005 | The comparison studied was not included: multifaceted intervention comprising PEM + workshop vs. no intervention |
| Evans 2010 | Outcomes were not objective (knowledge test) |
| Ferrari 2005 | PEM only vs. usual care + information sheet |
| Fontaine 2006 | The intervention was a reminder |
| Hazard 1997 | The comparison studied was not included: multifaceted intervention comprising PEM + patient‐mediated reminder vs. usual care |
| Hunskaar 1996 | Outcomes were not objective |
| Jackevicius 1999 | Outcomes were not objective |
| Jain 2006 | The comparison studied was not included (PEM was used as control): PEM as part of a multifaceted intervention vs. PEM |
| Janmeja 2009 | The intervention was addressed at patients and not at healthcare professionals |
| Kocher 2003 | This study aimed to evaluate the validity of the guideline, and not its effectiveness to change professional practice |
| Kulkarni 1998 | Study design does not meet the inclusion criteria |
| Maiman 1988 | The comparison studied was not included (PEM was used as control): PEM + tutorial vs. PEM |
| Majumdar 2008 | The comparison studied was not included: PEM + reminder vs. usual care |
| Martino 2011 | Study design does not meet the inclusion criteria |
| Mettes 2010 | The comparison studied was not included (PEM was used as control): PEM + multifaceted intervention vs. PEM |
| Mockiene 2011 | The outcome was not objective |
| Mollon 2009 | Study design does not meet the inclusion criteria |
| Morse 2009 | Study design does not meet the inclusion criteria |
| Ozgun 2010 | Study design does not meet the inclusion criteria |
| Perez‐Jauregui 2008 | The intervention was a reminder |
| Richardson 2002 | Outcomes were not objective |
| Schwartz 2007 | The comparison was not included: PEM + conference vs. usual care |
| Simon 2007 | The comparison was not included: PEM + academic detailing vs. no intervention |
PEM: printed educational material
Differences between protocol and review
There is no difference between the protocol and review.
The first version of the review (Freemantle 1997) considered the following comparisons: (1) PEMs against a non‐intervention control and (2) multifaceted intervention plus PEMs versus PEMs alone. In the subsequent versions (Farmer 2008, Giguere 2012) and in the current update, we modified the proposed comparisons to separate the effect of PEM from the effect of other interventions. We thus did not include any more studies that compared PEMs with PEMs as part of a multifaceted intervention, but compared PEMs as part of a multifaceted intervention versus multifaceted interventions not including PEMs.
In the present update of the review, we included one CBA study that had been excluded in the last update because of a lack of pre‐intervention data (Steffensen 1997), as we were able to get the needed data.
Contributions of authors
AG, HTVZ, JM, CBU and DUA identified the eligible studies and participated in data extraction. AG, PHC, HTVZ, and CBU participated in data analysis. AG, PHC and HTVZ wrote the first draft of the review report. AG, HTVZ, PHC and CBU updated the manuscript using the new data. All authors revised the first draft and the final version of the review report.
Sources of support
Internal sources
Institute of Population Health, University of Ottawa, Canada
Canadian Foundation for Innovation ‐ Canadian Research Chair, Canada
Centre de Recherche, Centre Hospitalier Universitaire de Québec, Canada
Health Services Research Unit, University of Aberdeen, UK
University of Leeds, UK
Department of Medical Education, University of Washington, USA
Ottawa Hospital Research Institute, Canada
Health Information Research Unit, McMaster University, Canada
External sources
NIHR Cochrane Review Incentive Scheme 2011, UK
The Wellcome Trust and Chief Scientist Office, Scottish Executive Health Department, UK
CCOHTA'S 2004 Health Technology Assessment Capacity Building Grants Program, Canada
Canadian Institutes for Health Research, Canada
Knowledge Translation Canada Research Network, Canada
Declarations of interest
AG: none known
DUA: none known
PHC: none known
FL: none known
JMG is author of one of the included studies but he did not have any role in extracting and assessing risks of bias for this study
MPF: none known
HTVZ: none known
CBU: none known
JM; none known
New search for studies and content updated (conclusions changed)
References
References to studies included in this review
Adereti 2018 {published data only}
- Adereti CS, Olaogun AA. Use of electronic and paper-based standardized nursing care plans to improve nurses' documentation quality in a Nigerian teaching hospital. International Journal of Nursing Knowledge 2018;30(4):219-27. [DOI] [PubMed] [Google Scholar]
Austin 2003 {published data only}
- Austin PC, Mamdani MM, Tu K, Jaakkimainen L. Prescriptions for estrogen replacement therapy in Ontario before and after publication of the Women's Health Initiative Study. Journal of the American Medical Association 2003;289(24):3241-2. [DOI] [PubMed] [Google Scholar]
Austin 2004A {published data only}
- Austin PC, Mamdani MM, Tu K. The impact of the Women's Health Initiative study on incident clonidine use in Ontario, Canada. Canadian Journal of Clinical Pharmacology 2004;11(2):e191-4. [PubMed] [Google Scholar]
Austin 2004B {published data only}
- Austin PC, Mamdani MM, Tu K, Zwarenstein M. Changes in prescribing patterns following publication of the ALLHAT trial. Journal of the American Medical Association 2004;291(1):44-5. [DOI] [PubMed] [Google Scholar]
Austin 2005 {published data only}
- Austin PC, Mamdani MM. Impact of the pravastatin or avorstatin evaluation and infection therapy-thrombolysis in myocardial infarction. Circulation 2005;112(9):1296-300. [DOI] [PubMed] [Google Scholar]
Avorn 1983 {published data only}
- Avorn J, Soumerai SB. Improving drug-therapy decisions through educational outreach. A randomized controlled trial of academically based "detailing". New England Journal of Medicine 1983;308(24):1457-63. [DOI] [PubMed] [Google Scholar]
- Soumerai SB, Avorn J. Economic and policy analysis of university-based drug "detailing". Medical Care 1986;24(4):313-31. [DOI] [PubMed] [Google Scholar]
- Soumerai SB, Avorn J. Predictors of physician prescribing change in an educational experiment to improve medication use. Medical Care 1987;25(3):210-21. [DOI] [PubMed] [Google Scholar]
Azocar 2003 {published data only}
- Azocar F, Cuffel B, Goldman W, McCarter L. The impact of evidence-based guideline dissemination for the assessment and treatment of major depression in a managed behavioral health care organization. Journal of Behavioral Health Services and Research 2003;30(1):109-18. [DOI] [PubMed] [Google Scholar]
- Azocar F, Cuffel BD, Goldman W, McCulloch J. Best practices: dissemination of guidelines for the treatment of major depression in a managed behavioral health care network. Psychiatric Services 2001;52(8):1014-6. [DOI] [PubMed] [Google Scholar]
Barbaglia 2009 {published data only}
- Barbaglia G, Macia F, Comas M, Sala M, del MV, Casamitjana M, et al. Trends in hormone therapy use before and after publication of the Women's Health Initiative trial: 10 years of follow-up. Menopause 2009;16(5):1061-4. [DOI] [PubMed] [Google Scholar]
Barber 2017 {published data only}
- Barber C, Gagnon D, Fonda J, Cho K, Hermos J, Miller M. Assessing the impact of prescribing directives on opioid prescribing practices among Veterans Health Administration providers. Pharmacoepidemiology and Drug Safety 2017 Jan;26(1):40-6. [DOI] [PubMed] [Google Scholar]
Bearcroft 1994 {published data only}
- Bearcroft PWP, Small JH, Flower CDR. Chest radiography guidelines for general practitioners: a practical approach. Clinical Radiology 1994;49(1):56-8. [DOI] [PubMed] [Google Scholar]
Beaulieu 2004 {published data only}
- Beaulieu M-D, Brophy J, Jacques A, Blais R, Battista R, Lebeau R. Drug treatment of stable angina pectoris and mass dissemination of therapeutic guidelines: a randomized controlled trial. Quarterly Journal of Medicine 2004;97(1):21-31. [DOI] [PubMed] [Google Scholar]
Bjornson 1990 {published data only}
- Bjornson DC, Rector TS, Daniels CE, Wertheimer AI, Snowdon DA, Litman TJ. Impact of a drug-use review program intervention on prescribing after publication of a randomized clinical trial. American Journal of Hospital Pharmacy 1990;47(7):1541-6. [PubMed] [Google Scholar]
Black 2002 {published data only}
- Black N, Hutchings A. Reduction in the use of surgery for glue ear: did national guidelines have an impact? Quality and Safety in Health Care 2002;11(2):121-4. [DOI] [PMC free article] [PubMed] [Google Scholar]
Buyle 2010 {published data only}
- Buyle F, Vogelaers D, Peleman R, Van Maele G, Robays H. Implementation of guidelines for sequential therapy with fluoroquinolones in a Belgian hospital. Pharmacy World & Science 2010;32(3):404-10. [DOI] [PubMed] [Google Scholar]
Chandy 2014 {published data only}
- Chandy SJ, Naik GS, Charles R, Jeyaseelan V, Naumova EN, Thomas K, et al. The impact of policy guidelines on hospital antibiotic use over a decade: a segmented time series analysis. PLOS One 2014;9(3):e92206. [DOI] [PMC free article] [PubMed] [Google Scholar]
Coopersmith 2002 {published data only}
- Coopersmith CM, Rebmann TL, Zack JE, Ward MR, Corcoran RM, Schallom ME, et al. Effect of an education program on decreasing catheter-related bloodstream infections in the surgical intensive care unit. Critical Care Medicine 2002;30(1):59-64. [DOI] [PubMed] [Google Scholar]
Denig 1990 {published data only}
- Denig P, Haaijer-Ruskamp FM, Zijsling DH. Impact of a drug bulletin on the knowledge, perception of drug utility, and prescribing behavior of physicians. Annals of Pharmacotherapy 1990;24(1):87-93. [DOI] [PubMed] [Google Scholar]
Dickinson 2003 {published data only}
- Dickinson WP, Dickinson LM, DeGruy FV, Main DS, Candib LM, Rost K. A randomized clinical trial of a care recommendation letter intervention for somatization in primary care. Annals of Family Medicine 2003;1(4):228-35. [DOI] [PMC free article] [PubMed] [Google Scholar]
Dormuth 2004 {published data only}
- Dormuth CR, Maclure M, Bassett K, Jauca C, Whiteside C, Wright JM. Effect of periodic letters on evidence-based drug therapy on prescribing behaviour: a randomized trial. Canadian Medical Association Journal 2004;171(9):1057-61. [DOI] [PMC free article] [PubMed] [Google Scholar]
Dubey 2006 {published data only}
- Dubey V, Mathew R, Iglar K, Moineddin R, Glazier R. Improving preventive service delivery at adult complete health check-ups: the Preventive health Evidence-based Recommendation Form (PERFORM) cluster randomized controlled trial. BMC Family Practice 2006;7:44. [DOI] [PMC free article] [PubMed] [Google Scholar]
Evans 1986 {published data only}
- Evans CE, Haynes RB, Birkett NJ, Gilbert JR, Taylor DW, Sackett DL, et al. Does a mailed continuing education program improve physician performance? Results of a randomized trial in antihypertensive care. Journal of the American Medical Association 1986;255(4):501-4. [PubMed] [Google Scholar]
Fijn 2000 {published data only}
- Fijn R, Stuurman-Bieze AGG, Van Den Berg PB, Brouwers JRBJ, De Graeff PA, De Jong-van Den B. Predictors for prophylactic antithrombotic prescribing in ischaemic heart disease and the impact of national guidelines. European Journal of Clinical Pharmacology 2000;56(9-10):739-46. [DOI] [PubMed] [Google Scholar]
Fonarow 2009 {published data only}
- Fonarow GC, French WJ, Frederick PD. Trends in the use of lipid-lowering medications at discharge in patients with acute myocardial infarction: 1998 to 2006. American Heart Journal 2009;157(1):185-94. [DOI] [PubMed] [Google Scholar]
Fukuda 2009 {published data only}
- Fukuda H, Imanaka Y, Ishizaki T, Okuma K, Shirai T. Change in clinical practice after publication of guidelines on breast cancer treatment. International Journal for Quality in Health Care 2009;21(5):372-8. [DOI] [PubMed] [Google Scholar]
Fukuda 2018 {published data only}
- Fukuda K, Terada S, Hashimoto M, Ukai K, Kumagai R, Suzuki M, et al. Effectiveness of educational program using printed educational material on care burden distress among staff of residential aged care facilities without medical specialists and/or registered nurses: Cluster quasi-randomization study. Geriatrics & Gerontology International 2018;18(3):487-94. [DOI] [PubMed] [Google Scholar]
Guadagnoli 2004 {published data only}
- Guadagnoli E, Normand SL, DiSalvo TG, Palmer RH, McNeil BJ. Effects of treatment recommendations and specialist intervention on care provided by primary care physicians to patients with myocardial infarction or heart failure. American Journal of Medicine 2004;117(6):371-9. [DOI] [PubMed] [Google Scholar]
Guay 2007 {published data only}
- Guay MP, Dragomir A, Pilon D, Moride Y, Perreault S. Changes in pattern of use, clinical characteristics and persistence rate of hormone replacement therapy among postmenopausal women after the WHI publication. Pharmacoepidemiology and Drug Safety 2007;16(1):17-27. [DOI] [PubMed] [Google Scholar]
Haas 2004 {published data only}
- Haas JS, Kaplan CP, Gerstenberger EP, Kerlikowske K. Changes in the use of postmenopausal hormone therapy after the publication of clinical trial results. Annals of Internal Medicine 2004;140(3):184-8. [DOI] [PubMed] [Google Scholar]
Hawley 2018 {published data only}
- Hawley S, Cordtz R, Dreyer L, Edwards CJ, Arden NK, Delmestri A, et al. Association between NICE guidance on biologic therapies with rates of hip and knee replacement among rheumatoid arthritis patients in England and Wales: an interrupted time-series analysis. Seminars in Arthritis and Rheumatism 2018;47(5):605-10. [DOI] [PMC free article] [PubMed] [Google Scholar]
Hersh 2004 {published data only}
- Hersh AL, Stefanick ML, Stafford RS. National use of postmenopausal hormone therapy: annual trends and response to recent evidence. Journal of the American Medical Association 2004;291(1):47-53. [DOI] [PubMed] [Google Scholar]
Izcovich 2011 {published data only}
- Izcovich A, Malla CG, Diaz MM, Manzotti M, Catalano HN. Impact of facilitating physician access to relevant medical literature on outcomes of hospitalised internal medicine patients: a randomised controlled trial. Evidence-Based Medicine 2011;16(5):131-5. [DOI] [PubMed] [Google Scholar]
Jackevicius 2001 {published data only}
- Jackevicius CA, Anderson GM, Leiter L, Tu JV. Use of the statins in patients after acute myocardial infarction: does evidence change practice? Archives of Internal Medicine 2001;161(2):183-8. [DOI] [PubMed] [Google Scholar]
Jameson 2010 {published data only}
- Jameson SS, Bottle A, Malviya A, Muller SD, Reed MR. The impact of national guidelines for the prophylaxis of venous thromboembolism on the complications of arthroplasty of the lower limb. Journal of Bone and Joint Surgery - Series B 2010;92(1):123-9. [DOI] [PubMed] [Google Scholar]
Jousimaa 2002 {published data only}
- Jousimaa J, Makela M, Kunnamo I, MacLennan G, Grimshaw JM. Primary care guidelines on consultation practices: the effectiveness of computerized versus paper-based versions. A cluster randomized controlled trial among newly qualified primary care physicians. International Journal of Technology Assessment Health Care 2002;18(3):586-96. [PubMed] [Google Scholar]
Judge 2015 {published data only}
- Judge A, Wallace G, Prieto-Alhambra D, Arden NK, Edwards CJ. Can the publication of guidelines change the management of early rheumatoid arthritis? An interrupted time series analysis from the United Kingdom. Rheumatology 2015;54(12):2244-8. [DOI] [PubMed] [Google Scholar]
Juurlink 2004 {published data only}
- Juurlink DN, Mamdani MM, Lee DS, Kopp A, Austin PC, Laupacis A, et al. Rates of hyperkalemia after publication of the Randomized Aldactone Evaluation Study. New England Journal of Medicine 2004;354(6):543-51. [DOI] [PubMed] [Google Scholar]
Kabir 2007 {published data only}
- Kabir Z, Feely J, Bennett K. Primary care prescribing patterns in Ireland after the publication of large hypertension trials. British Journal of Clinical Pharmacology 2007;64(3):381-5. [DOI] [PMC free article] [PubMed] [Google Scholar]
Kajita 2010 {published data only}
- Kajita E, Nakatani Y, Tamaki J, Ito N, Iki M. In: Evidence-based assessment of the effectiveness of a clinical practice guideline for prevention of osteoporosis and osteoporotic fracture. IOF World Congress on Osteoporosis and 10th European Congress on Clinical and Economic Aspects of Osteoporosis and Osteoarthritis, IOF WCO - ECCEO 10; 2010 May 5-8; Florence, Italy. 2010.
- Nakatani Y, Tamaki J, Komatsu M, Iki M, Kajita E. Effect of distributing an evidence-based guideline for prevention of osteoporosis on health education programs in municipal health centers: a randomized controlled trial. Journal of Epidemiology 2012;22(2):103-12. [DOI] [PMC free article] [PubMed]
Komen 2017 {published data only}
- Komen J, Forslund T, Hjemdahl P, Andersen M, Wettermark B. Effects of policy interventions on the introduction of novel oral anticoagulants in Stockholm: an interrupted time series analysis. British Journal of Clinical Pharmacology 2017;83(3):642-52. [DOI] [PMC free article] [PubMed] [Google Scholar]
Kottke 1989 {published data only}
- Kottke TE, Brekke ML, Solberg LI, Hughes JR. Use smoking intervention by physicians. Doctors Helping Smokers, Round I. Journal of the American Medical Association 1989;261(14):2101-6. [PubMed] [Google Scholar]
Kunz 2007 {published data only}
- Kunz R, Wegscheider K, Guyatt G, Zielinski W, Rakowsky N, Donner-Banzhoff N, et al. Impact of short evidence summaries in discharge letters on adherence of practitioners to discharge medication. A cluster-randomised controlled trial. Quality and Safety in Health Care 2007;16(6):456-61. [DOI] [PMC free article] [PubMed] [Google Scholar]
Lam 2009 {published data only}
- Lam NN, Jain AK, Hackam DG, Cuerden MS, Suri RS, Huo CY, et al. Results of a randomized controlled trial on statin use in dialysis patients had no influence on statin prescription. Kidney International 2009;76(11):1172-9. [DOI] [PubMed] [Google Scholar]
Lee 2018A {published data only}
- Lee HH, Dalesio NM, Lo Sasso AT, Van Cleve WC. Impact of clinical guidelines on revisits after ambulatory pediatric adenotonsillectomy. Anesthesia & Analgesia 2018;127(2):478-84. [DOI] [PubMed] [Google Scholar]
Lee 2018B {published data only}
- Lee T, Ellimoottil C, Marchetti KA, Banerjee T, Ivančić V, Kraft KH, et al. Impact of clinical guidelines on voiding cystourethrogram use and vesicoureteral reflux Incidence. Journal of Urology 2018;199(3):831-6. [DOI] [PubMed] [Google Scholar]
Li 2017 {published data only}
- Li L, Fortin E, Tremblay C, Ngenda-Muadi M, Garenc C, Moisan D, et al, SPIN-BACC and SPIN-SARM. Hospital-acquired methicillin-resistant Staphylococcus aureus bloodstream infections in Québec: impact of guidelines. Infection Control & Hospital Epidemiology 2017;38(7):840-7. [DOI] [PubMed] [Google Scholar]
Liaw 2008 {published data only}
- Liaw ST, Sulaiman ND, Barton CA, Chondros P, Harris CA, Sawyer S, et al. An interactive workshop plus locally adapted guidelines can improve general practitioners asthma management and knowledge: a cluster randomised trial in the Australian setting. BMC Family Practice 2008;9:22. [DOI] [PMC free article] [PubMed] [Google Scholar]
Luo 2018 {published data only}
- Luo N, Ballew NG, O'Brien EC, Greiner MA, Peterson PN, Hammill BG, et al. Early impact of guideline publication on angiotensin-receptor neprilysin inhibitor use among patients hospitalized for heart failure. American Heart Journal 2018;200:134-40. [DOI] [PubMed] [Google Scholar]
Majumdar 2003 {published data only}
- Majumdar SR, McAlister FA, Soumerai SB. Synergy between publication and promotion: comparing adoption of new evidence in Canada and the United States. American Journal of Medicine 2003;115(6):467-72. [DOI] [PubMed] [Google Scholar]
Majumdar 2004 {published data only}
- Majumdar SR, Almasi EA, Stafford RS. Promotion and prescribing of hormone therapy after report of harm by the Women's Health Initiative. Journal of the American Medical Association 2004;292(16):1983-8. [DOI] [PubMed] [Google Scholar]
Marincowitz 2018 {published data only}
- Marincowitz C, Lecky FE, Morris E, Allgar V, Sheldon TA. Impact of the SIGN head injury guidelines and NHS 4-hour emergency target on hospital admissions for head injury in Scotland: an interrupted times series. BMJ Open 2018;8(12):e022279. [DOI] [PMC free article] [PubMed] [Google Scholar]
Markovitz 2017 {published data only}
- Markovitz AA, Holleman RG, Hofer TP, Kerr EA, Klamerus ML, Sussman JB. Effects of guideline and formulary changes on statin prescribing in the Veterans Affairs. Health Services Research 2017;52(6):1996-2017. [DOI] [PMC free article] [PubMed] [Google Scholar]
Mason 1998/99 {published data only}
- Mason J, Freemantle N, Young P. The effect of the distribution of Effective Health Care Bulletins on prescribing selective serotonin reuptake inhibitors in primary care. Health Trends 1998/99;30:120-2. [Google Scholar]
Mason 2001 {published data only}
- Mason J, Freemantle N, Browning G. Impact of effective health care bulletin on treatment of persistent glue ear in children: time series analysis. BMJ 2001;323(7321):1096-7. [DOI] [PMC free article] [PubMed] [Google Scholar]
Matowe 2002 {published data only}
- Matowe L, Ramsay CR, Grimshaw JM, Gilbert FJ, Macleod MJ, Needham G. Effects of mailed dissemination of the Royal College of Radiologists' guidelines on general practitioner referrals for radiography: a time series analysis. Clinical Radiology 2002;57(7):575-8. [DOI] [PubMed] [Google Scholar]
McEwen 2002 {published data only}
- McEwen A, Preston A, West R. Effect of a GP desktop resource on smoking cessation activities of general practitioners. Addiction 2002;97(5):595-7. [DOI] [PubMed] [Google Scholar]
Meyer 2007 {published data only}
- Meyer E, Buttler J, Schneider C, Strehl E, Schroeren-Boersch B, Gastmeier P, et al. Modified guidelines impact on antibiotic use and costs: duration of treatment for pneumonia in a neurosurgical ICU is reduced. Journal of Antimicrobial Chemotherapy 2007;59(6):1148-54. [DOI] [PubMed] [Google Scholar]
Mohammadi 2015 {published data only}
- Mohammadi A, Mojtahedzadeh R, Emami A, Dehpour M. Pamphlet as a tool for continuing medical education: performance assessment in a randomized controlled interventional study. Medical Journal of the Islamic Republic of Iran 2015;29:252. [PMC free article] [PubMed] [Google Scholar]
Naimer 2017 {published data only}
- Naimer MS, Kwong JC, Bhatia D, Moineddin R, Whelan M, Campitelli MA, et al. The effect of changes in cervical cancer screening guidelines on chlamydia testing. Annals of Family Medicine 2017;15(4):329-34. [DOI] [PMC free article] [PubMed] [Google Scholar]
Nicholas 2009 {published data only}
- Nicholas J, Dennison BA, De Long R, Prokorym M, Brissette I. Randomized controlled trial of a mailed toolkit to increase use of body mass index percentiles to screen for childhood obesity. Preventing Chronic Disease 2009;6:A122. [PMC free article] [PubMed] [Google Scholar]
Oakeshott 1994 {published data only}
- Oakeshott P, Kerry SM, Williams JE. Randomized controlled trial of the effect of the Royal College of Radiologists' guidelines on general practitioners' referrals for radiographic examination. British Journal of General Practice 1994;44(382):197-200. [PMC free article] [PubMed] [Google Scholar]
Ouldali 2017 {published data only}
- Ouldali N, Bellêttre X, Milcent K4, , Guedj R, De Pontual L, Cojocaru B, et al. Impact of implementing national guidelines on antibiotic prescriptions for acute respiratory tract Infections in pediatric emergency departments: an interrupted time series analysis. Clinical Infectious Diseases 2017;65(9):1469-76. [DOI] [PubMed] [Google Scholar]
Perria 2007 {published data only}
- Perria C, Group IS . Strategies for the introduction and implementation of a guideline for the treatment of type 2 diabetics by general practitioners (GPs) of the Lazio region of Italy (IMPLEMEG study): protocol for a cluster randomised controlled trial. BMC Health Services Research 2004;4(1):13. [DOI] [PMC free article] [PubMed] [Google Scholar]
- Perria C, Mandolini D, Guerrera C, Jefferson T, Billi P, Calzini V, et al. Implementing a guideline for the treatment of type 2 diabetics: results of a cluster-randomized controlled trial (C-RCT). BMC Health Services Research 2007;7:79. [DOI] [PMC free article] [PubMed] [Google Scholar]
Rahme 2005 {published data only}
- Rahme E, Choquette D, Beaulieu M, Bessette L, Joseph L, Toubouti Y, et al. Impact of a general practitioner educational intervention on osteoarthritis treatment in an elderly population. American Journal of Medicine 2005;118(11):1262-70. [DOI] [PubMed] [Google Scholar]
Rigobon 2019 {published data only}
- Rigobon AV, Kalia S, Nichols J, Aliarzadeh B, Greiver M, Moineddin R, et al. Impact of the diabetes Canada guideline dissemination strategy on the prescription of vascular protective medications: a retrospective cohort study, 2010-2015. Diabetes Care 2019;42(1):148-56. [DOI] [PubMed] [Google Scholar]
Roberts 2007 {published data only}
- Roberts VI, Esler CN, Harper WM. What impact have NICE guidelines had on the trends of hip arthroplasty since their publication? The results from the Trent Regional Arthroplasty Study between 1990 and 2005. Journal of Bone and Joint Surgery - Series B 2007;89(7):864-7. [DOI] [PubMed] [Google Scholar]
Roifman 2017 {published data only}
- Roifman I, Austin PC, Qiu F, Wijeysundera HC. Impact of the publication of appropriate use criteria on utilization rates of myocardial perfusion imaging studies in Ontario, Canada: a population-based study. Journal of the American Heart Association 2017;6(7):pii: e005961. [DOI] [PMC free article] [PubMed] [Google Scholar]
Sakai 2017 {published data only}
- Sakai Bizmark R, Chang RR, Tsugawa Y, Zangwill KM, Kawachi I. Impact of AHA's 2007 guideline change on incidence of infective endocarditis in infants and children. American Heart Journal 2017;189:110-9. [DOI] [PubMed] [Google Scholar]
Salzler 2017 {published data only}
- Salzler GG, Farber A, Rybin DV, Doros G, Siracuse JJ, Eslami MH. The association of Carotid Revascularization Endarterectomy versus Stent Trial (CREST) and Centers for Medicare and Medicaid Services Carotid Guideline Publication on utilization and outcomes of carotid stenting among "high-risk" patients. Journal of Vascular Surgery 2017;66(1):104-11. [DOI] [PubMed] [Google Scholar]
Santerre 1996 {published data only}
- Santerre RE. The effect of the ACOG guideline on vaginal births after cesarean. Medical Care Research and Review 1996;53(3):315-29. [DOI] [PubMed] [Google Scholar]
Shah 2008 {published data only}
- Shah BR, Juurlink DN, Austin PC, Mamdani MM. New use of rosiglitazone decreased following publication of a meta-analysis suggesting harm. Diabetic Medicine 2008;25(7):871-4. [DOI] [PubMed] [Google Scholar]
Shah 2014 {published data only}
- Shah BR, Bhattacharyya O, Yu C, Mamdani M, Parsons JA, Straus SE, et al. Evaluation of a toolkit to improve cardiovascular disease screening and treatment for people with type 2 diabetes: protocol for a cluster-randomized pragmatic trial. Trials 2010;11:44. [DOI] [PMC free article] [PubMed] [Google Scholar]
- Shah BR, Bhattacharyya O, Yu CH, Mamdani MM, Parsons JA, Straus SE, et al. Effect of an educational toolkit on quality of care: a pragmatic cluster randomized trial. PLOS Medicine 2014;11(2):e1001588. [DOI] [PMC free article] [PubMed] [Google Scholar]
Stafford 2004 {published data only}
- Stafford RS, Furberg CD, Finkelstein SN, Cockburn IM, Alehegn T, Ma J. Impact of clinical trial results on national trends in alpha-blocker prescribing, 1996-2002. Journal of the American Medical Association 2004;291(1):54-62. [DOI] [PubMed] [Google Scholar]
Steffensen 1997 {published data only}
- Steffensen FH, Sorensen HT, Olesen F. Impact of local evidence-based clinical guidelines - a Danish intervention study. Family Practice 1997;14(3):209-15. [DOI] [PubMed] [Google Scholar]
Stocks 2017 {published data only}
- Stocks SJ, Kontopantelis E, Webb RT, Avery AJ, Burns A, Ashcroft DM. Antipsychotic prescribing to patients diagnosed with dementia without a diagnosis of psychosis in the context of national guidance and drug safety warnings: longitudinal study in UK general practice. Drug Safety 2017;40(8):679-92. [DOI] [PMC free article] [PubMed] [Google Scholar]
Tsuji 2009 {published data only}
- Tsuji SR, Atallah AN, Aranha FC, Tonhom AP, Siqueira AC Jr, Matos D. Cluster randomized clinical trial (ISRCTN23732000) to evaluate the effectiveness of a diagnosis recognition and treatment guide for depressive disorders in primary care. Journal of Evaluation in Clinical Practice 2009;15(1):222-5. [DOI] [PubMed] [Google Scholar]
Tziraki 2000 {published data only}
- Tziraki C, Graubard BI, Manley M, Kosary C, Moler JE, Edwards BK. Effect of training on adoption of cancer prevention nutrition-related activities by primary care practices: results of a randomized, controlled study. Journal of General and Internal Medicine 2000;15(3):155-62. [DOI] [PMC free article] [PubMed] [Google Scholar]
Ulbricht 2014 {published data only}
- Ulbricht S, Gross B, Kunstmann W, John U, Meyer C. Efficacy of disseminating educational materials in general practices. Sucht 2014;60(2):85-91. [Google Scholar]
Wang 2005 {published data only}
- Wang YR, Alexander GC, Meltzer DO. Lack of effect of guideline changes on LDL cholesterol reporting and control for diabetes visits in the U.S., 1995-2004. Diabetes Care 2005;28(12):2942-4. [DOI] [PubMed] [Google Scholar]
Watson 2001 {published data only}
Weaver 2016 {published data only}
- Weaver MR, Pillay E, Jed SL, De Kadt J, Galagan S, Gilvydis J, et al. Three methods of delivering clinic-based training on syndromic management of sexually transmitted diseases in South Africa: a pilot study. Sexually Transmitted Infections 2016;92(2):135-41. [DOI] [PMC free article] [PubMed] [Google Scholar]
Weiner 2017 {published data only}
- Weiner SG, Baker O, Poon SJ, Rodgers AF, Garner C, Nelson LS, et al. The effect of opioid prescribing guidelines on prescriptions by emergency physicians in Ohio. Annals of Emergency Medicine 2017;70(6):799-808. [DOI] [PubMed] [Google Scholar]
Weiss 2011 {published data only}
- Weiss K, Blais R, Fortin A, Lantin S, Gaudet M. Impact of a multipronged education strategy on antibiotic prescribing in Quebec, Canada. Clinical Infectious Diseases 2011;53(5):433-9. [DOI] [PubMed] [Google Scholar]
Zwarenstein 2014 {published data only}
- Zwarenstein M, Shiller SK, Croxford R, Grimshaw JM, Kelsall D, Paterson JM, et al. Printed educational messages aimed at family practitioners fail to increase retinal screening among their patients with diabetes: a pragmatic cluster randomized controlled trial [ISRCTN72772651]. Implementation Science 2014;9:87. [DOI] [PMC free article] [PubMed] [Google Scholar]
Zwarenstein 2016 {published data only}
- Francis JJ, Grimshaw JM, Zwarenstein M, Eccles MP, Shiller S, Godin G, et al. Testing a TheoRY-inspired MEssage ('TRY-ME'): a sub-trial within the Ontario Printed Educational Message (OPEM) trial. Implementation Science 2007;2:39. [DOI] [PMC free article] [PubMed] [Google Scholar]
- Zwarenstein M, Grimshaw JM, Presseau J, Francis JJ, Godin G, Johnston M, et al. Printed educational messages fail to increase use of thiazides as first-line medication for hypertension in primary care: a cluster randomized controlled trial [ISRCTN72772651]. Implementation Science 2016;11(1):124. [DOI] [PMC free article] [PubMed] [Google Scholar]
- Zwarenstein M, Hux JE, Kelsall D, Paterson M, Grimshaw J, Davis D, et al. The Ontario printed educational message (OPEM) trial to narrow the evidence-practice gap with respect to prescribing practices of general and family physicians: a cluster randomized controlled trial, targeting the care of individuals with diabetes and hypertension in Ontario, Canada. Implementation Science 2007;2:37. [DOI] [PMC free article] [PubMed] [Google Scholar]
References to studies excluded from this review
Croudace 2003 {published data only}
- Croudace T, Evans J, Harrison G, Sharp DJ, Wilkinson E, McCann G, et al. Impact of the ICD-10 primary health care (PHC) diagnostic and management guidelines for mental disorders on detection and outcome in primary care. British Journal of Psychiatry 2003;182:20-30. [DOI] [PubMed] [Google Scholar]
Emslie 1993 {published data only}
- Emslie C, Grimshaw J, Templeton A. Do clinical guidelines improve general practice management and referral of infertile couples? BMJ 1993;306(6894):1728-31. [DOI] [PMC free article] [PubMed] [Google Scholar]
Engers 2005 {published data only}
- Engers AJ, Wensing M, Van Tulder MW, Timmermans A, Oostendorp RA, Koes BW, et al. Implementation of the Dutch low back pain guideline for general practitioners: a cluster randomized controlled trial. Spine 2005;30(6):559-600. [DOI] [PubMed] [Google Scholar]
Evans 2010 {published data only}
- Evans DW, Breen AC, Pincus T, Sim J, Underwood M, Vogel S, et al. The effectiveness of a posted information package on the beliefs and behavior of musculoskeletal practitioners: the UK Chiropractors, Osteopaths, and Musculoskeletal Physiotherapists Low Back Pain ManagemENT (COMPLeMENT) randomized trial. Spine 2010;35(8):858-66. [DOI] [PubMed] [Google Scholar]
Ferrari 2005 {published data only}
- Ferrari R, Rowe BH, Majumdar SR, Cassidy JD, Blitz S, Wright SC, et al. Simple educational intervention to improve the recovery from acute whiplash: results of a randomized, controlled trial. Academic Emergency Medicine 2005;12(8):699-706. [DOI] [PubMed] [Google Scholar]
Fontaine 2006 {published data only}
- Fontaine A, Mahe I, Bergmann JF, Fiessinger JN, Dhote R, Cohen P, et al. Effectiveness of written guidelines on the appropriateness of thromboprophylaxis prescriptions for medical patients: a prospective randomized study. Journal of Internal Medicine 2006;260(4):369-76. [DOI] [PubMed] [Google Scholar]
Hazard 1997 {published data only}
- Hazard RG, Haugh LD, Reid S, McFarlane G, MacDonald L. Early physician notification of patient disability risk and clinical guidelines after low back injury: a randomized controlled trial. Spine 1997;22(24):2951-8. [DOI] [PubMed] [Google Scholar]
Hunskaar 1996 {published data only}
- Hunskaar S, Hannestad YS, Backe B, Matheson I. Direct mailing of consensus recommendations did not alter GPs' knowledge and prescription of oestrogen in the menopause. Scandinavian Journal of Primary Health Care 1996;14(4):203-8. [DOI] [PubMed] [Google Scholar]
Jackevicius 1999 {published data only}
- Jackevicius CA, Chapman KR. Inhaler education for hospital-based pharmacists: how much is required? Canadian Respiratory Journal 1999;6(3):237-44. [DOI] [PubMed] [Google Scholar]
Jain 2006 {published data only}
- Jain MK, Heyland D, Dhaliwal R, Day AG, Drover J, Keefe L, et al. Dissemination of the Canadian clinical practice guidelines for nutrition support: results of a cluster randomized controlled trial. Critical Care Medicine 2006;34(9):2362-9. [DOI] [PubMed] [Google Scholar]
Janmeja 2009 {published data only}
- Janmeja AK, Mohapatra PR, Kumar M. The impact of "World Health Organization - Government of India guidelines on chronic obstructive pulmonary diseases-2003" on quality of life. Lung India 2009;26(4):102-5. [DOI] [PMC free article] [PubMed] [Google Scholar]
Kocher 2003 {published data only}
- Kocher MS, Mandiga R, Murphy JM, Goldmann D, Harper M, Sundel R, et al. A clinical practice guideline for treatment of septic arthritis in children: efficacy in improving process of care and effect on outcome of septic arthritis of the hip. Journal of Bone & Joint Surgery, American Volume 2003;85A(6):994-9. [PubMed] [Google Scholar]
Kulkarni 1998 {published data only}
- Kulkarni K, Castle G, Gregory R, Holmes A, Leontos C, Powers M, et al, The Diabetes Care and Education Dietetic Practice Group. Nutrition practice guidelines for type 1 diabetes mellitus positively affect dietician practices and patient outcomes. Journal of the American Dietetic Association 1998;98(1):62-70. [DOI] [PubMed] [Google Scholar]
Maiman 1988 {published data only}
- Maiman LA, Becker MH, Liptak GS, Nazarian LF, Rounds KA. Improving pediatricians' compliance-enhancing practices. A randomized trial. American Journal of Diseases of Children 1988;142(7):773-9. [DOI] [PubMed] [Google Scholar]
Majumdar 2008 {published data only}
- Majumdar SR, Johnson JA, McAlister FA, Bellerose D, Russell AS, Hanley DA, et al. Multifaceted intervention to improve diagnosis and treatment of osteoporosis in patients with recent wrist fracture: a randomized controlled trial. Canadian Medical Association Journal 2008;178(5):569-75. [DOI] [PMC free article] [PubMed] [Google Scholar]
Martino 2011 {published data only}
- Martino P, Ban KM, Bartoloni A, Fowler KE, Saint S, Mannelli F. Assessing the sustainability of hand hygiene adherence prior to patient contact in the emergency department: a 1-year postintervention evaluation. American Journal of Infection Control 2011;39(1):14-8. [DOI] [PubMed] [Google Scholar]
Mettes 2010 {published data only}
- Mettes TG, Van der Sanden WJ, Bronkhorst E, Grol RP, Wensing M, Plasschaert AJ. Impact of guideline implementation on patient care: a cluster RCT. Journal of Dental Research 2010;89(1):71-6. [DOI] [PubMed] [Google Scholar]
Mockiene 2011 {published data only}
- Mockiene V, Suominen T, Valimaki M, Razbadauskas A, Martinkenas A, Caplinskas S. The impact of an education intervention to change nurses' HIV-related knowledge and attitudes in Lithuania: a randomized controlled trial. Journal of the Association of Nurses in AIDS Care 2011;22(2):140-9. [DOI] [PubMed] [Google Scholar]
Mollon 2009 {published data only}
- Mollon DL, Fields WL. Is this the right patient? An educational initiative to improve compliance with two patient identifiers. Journal of Continuing Education in Nursing 2009;40(5):221-7. [DOI] [PubMed] [Google Scholar]
Morse 2009 {published data only}
- Morse L, McDonald M. Failure of a poster-based educational programme to improve compliance with peripheral venous catheter care in a tertiary hospital. A clinical audit. Journal of Hospital Infections 2009;72(3):221-6. [DOI] [PubMed] [Google Scholar]
Ozgun 2010 {published data only}
- Ozgun H, Ertugrul BM, Soyder A, Ozturk B, Aydemir M. Peri-operative antibiotic prophylaxis: adherence to guidelines and effects of educational intervention. International Journal of Surgery 2010;8(2):159-63. [DOI] [PubMed] [Google Scholar]
Perez‐Jauregui 2008 {published data only}
- Perez-Jauregui J, Gonzalez-Cardel AM, Olay-Fuentes G, Reza-Albarran A, Mehta R, Aguilar-Salinas CA. Inclusion of educational messages in laboratory reports aids to complete the diagnostic workup of hyperglycemia. Diabetes Care 2008;31(5):882-3. [DOI] [PubMed] [Google Scholar]
Richardson 2002 {published data only}
- Richardson B, Kitchen G, Livingston G. The effect of education on knowledge and management of elder abuse: a randomized controlled trial. Age Ageing 2002;31(5):335-41. [DOI] [PubMed] [Google Scholar]
Schwartz 2007 {published data only}
- Schwartz DN, Abiad H, DeMarais PL, Armeanu E, Trick WE, Wang Y, et al. An educational intervention to improve antimicrobial use in a hospital-based long-term care facility. Journal of the American Geriatrics Society 2007;55(8):1236-42. [DOI] [PubMed] [Google Scholar]
Simon 2007 {published data only}
- Simon SR, Rodriguez HP, Majumdar SR, Kleinman K, Warner C, Salem-Schatz S, et al. Economic analysis of a randomized trial of academic detailing interventions to improve use of antihypertensive medications. Journal of Clinical Hypertension 2007;9(1):15-20. [DOI] [PMC free article] [PubMed] [Google Scholar]
Additional references
Agbadjé 2018
- Agbadjé TT, Menear M, Dugas M, Gagnon M-P, Rahimi SA, Robitaille H, et al. Pregnant women’s views on how to promote the use of a decision aid for Down syndrome prenatal screening: a theory-informed qualitative study. BMC Health Services Research 2018;18:434. [DOI] [PMC free article] [PubMed] [Google Scholar]
Ancker 2007
- Ancker JS, Kaufman D. Rethinking health numeracy: a multidisciplinary literature review. Journal of the American Medical Informatics Association 2007;14(6):713-21. [DOI] [PMC free article] [PubMed] [Google Scholar]
Arnold 2005
- Arnold SR, Straus SE. Interventions to improve antibiotic prescribing practices in ambulatory care. Cochrane Database of Systematic Reviews 2005, Issue 4. Art. No: CD003539. [DOI: 10.1002/14651858.CD003539.pub2 ] [DOI] [PMC free article] [PubMed] [Google Scholar]
Baker 2010
- Baker R, Camosso-Stefinovic J, Gillies C, Shaw EJ, Cheater F, Flottorp S, et al. Tailored interventions to overcome identified barriers to change: effects on professional practice and health care outcomes. Cochrane Database of Systematic Reviews 2010, Issue 3. Art. No: CD005470. [DOI: 10.1002/14651858.CD005470.pub2 ] [DOI] [PMC free article] [PubMed] [Google Scholar]
Bero 1998
- Bero L, Grilli R, Grimshaw J, Harvey E, Oxman A, Thomson MA. Closing the gap between research and practice: an overview of systematic reviews of interventions to promote the implementation of research findings. BMJ 1998;317(7156):465-8. [DOI] [PMC free article] [PubMed] [Google Scholar]
Bull 2001
- Bull F, Kreuter M, Clark E, Scharff D. Understanding the effects of printed health education material which features lead to which outcomes. Journal of Health Communication 2001;6(3):265-79. [DOI] [PubMed] [Google Scholar]
Burgers 2003a
- Burgers J, Grol R, Zaat J, Spies T, Van der Bij A, Mokkink H. Characteristics of effective guidelines for general practice. British Journal of General Practice 2003;53(486):15-9. [PMC free article] [PubMed] [Google Scholar]
Chastre 2003
- Chastre J. Antimicrobial treatment of hospital-acquired pneumonia. Infectious Disease Clinics of North America 2003;17(4):727-37. [PMID: 15008595] [DOI] [PubMed] [Google Scholar]
Chatfield 2001
- Chatfield C. Time-Series Forecasting. Florida: Chapman & Hall/CRC Press, 2001. [Google Scholar]
Davis 2009
- Davis D, Galbraith R. Continuing medical education effect on practice performance: effectiveness of continuing medical education: American College of Chest Physicians Evidence-Based Educational Guidelines. Chest 2009;135(3 Suppl):42S-8S. [DOI] [PubMed] [Google Scholar]
De Belvis 2009
- De Belvis AG, Pelone F, Biasco A, Ricciardi W, Volpe M. Can primary care professionals' adherence to Evidence Based Medicine tools improve quality of care in type 2 diabetes mellitus? A systematic review. Diabetes Research and Clinical Practice 2009;85(2):119-31. [DOI] [PubMed] [Google Scholar]
Donner 2001
- Donner A, Piaggio G, Villar J. Statistical methods for the meta-analysis of cluster randomization trials. Statistical Methods in Medical Research 2001;10(5):325-38. [DOI] [PubMed] [Google Scholar]
Foy 2002
- Foy R, McLennan G, Grimshaw J, Penney G, Campbell M, Grol R. Attributes of clinical recommendations that influence change in practice following audit and feedback. Journal of Clinical Epidemiology 2002;55:717-22. [DOI] [PubMed] [Google Scholar]
Freemantle 1997
- Freemantle N, Harvey EL, Wolf F, Grimshaw JM, Grilli R, Bero LA. Printed educational materials: effects on professional practice and health care outcomes. Cochrane Database of Systematic Reviews 1997, Issue 2. Art. No: CD000172. [DOI: 10.1002/14651858.CD000172] [DOI] [PubMed] [Google Scholar]
French 2010
- French SD, Green S, Buchbinder R, Barnes H. Interventions for improving the appropriate use of imaging in people with musculoskeletal conditions. Cochrane Database of Systematic Reviews 2010, Issue 1. Art. No: CD006094. [DOI: 10.1002/14651858.CD006094.pub2] [DOI] [PMC free article] [PubMed] [Google Scholar]
Gagliardi 2015
- Gagliardi AR, Alhabib S, members of Guidelines International Network Implementation Working Group. Trends in guideline implementation: a scoping systematic review. Implementation Sciences 2015;10:54. [DOI] [PMC free article] [PubMed] [Google Scholar]
GRADE 2009
- Schünemann H, Brozek J, Oxman A, editor(s), GRADE Working Group. GRADE handbook for grading quality of evidence and strength of recommendation. www.cc-ims.net/gradepro (accessed prior to 15 June 2020);Version 3.2.
Grandage 2002
- Grandage KK, Slawson DC, Shaughnessy AF. When less is more: a practical approach to searching for evidence-based answers. Journal of the Medical Library Association 2002;90(3):298-304. [PMC free article] [PubMed] [Google Scholar]
Greenhalgh 2017
- Greenhalgh T, Wherton J, Papoutsi C, Lynch J, Hughes G, A'Court C, et al. Beyond adoption: a new framework for theorizing and evaluating nonadoption, abandonment, and challenges to the scale-up, spread, and sustainability of health and care technologies. Journal of Medical Internet Research 2017;19(11):e367. [DOI] [PMC free article] [PubMed] [Google Scholar]
Grilli 2002
- Grilli R, Ramsay C, Minozzi S. Mass media interventions: effects on health services utilisation. Cochrane Database of Systematic Reviews 2002, Issue 1. Art. No: CD000389. [1469-493X: (Electronic)] [DOI: 10.1002/14651858.CD000389] [MEDLINE: ITS/PEM/methods/meta analysis] [DOI] [PubMed] [Google Scholar]
Grimshaw 2004
- Grimshaw JM, Thomas RE, MacLennan G, Fraser C, Ramsay CR, Vale L, et al. Effectiveness and efficiency of guideline dissemination and implementation strategies. Health Technology Assessment 2004;8(6):iii-iv, 1-72. [DOI] [PubMed] [Google Scholar]
Grimshaw 2006
- Grimshaw J, Eccles M, Thomas R, MacLennan G, Ramsay C, Fraser C, et al. Toward evidence-based quality improvement. Evidence (and its limitations) of the effectiveness of guideline dissemination and implementation strategies 1966-1998. Journal of General Internal Medicine 2006;21 Suppl 2:S14-20. [DOI] [PMC free article] [PubMed] [Google Scholar]
Grol 1998
- Grol R, Dalhuijsen J, Thomas S, Veld C, Rutten G, Mokkink H. Attributes of clinical guidelines that influence of guidelines in general practice: observational study. BMJ 1998;317:858-61. [DOI] [PMC free article] [PubMed] [Google Scholar]
Grol 2001
- Grol R. Successes and failures in the implementation of evidence-based guidelines for clinical practice. Medical Care 2001;39(8 Suppl 2):II46-54. [DOI] [PubMed] [Google Scholar]
Grol 2003
- Grol R, Grimshaw J. From best evidence to best practice: effective implementation of change in patients' care. Lancet 2003;362(9391):1225-30. [DOI] [PubMed] [Google Scholar]
Grol 2007
- Grol RP, Bosch MC, Hulscher ME, Eccles MP, Wensing M. Planning and studying improvement in patient care: the use of theoretical perspectives. Milbank Quarterly 2007;85(1):93-138. [DOI] [PMC free article] [PubMed] [Google Scholar]
Hakkennes 2008
- Hakkennes S, Dodd K. Guideline implementation in allied health professions: a systematic review of the literature. Quality and Safety in Health Care 2008;17(4):296-300. [DOI] [PubMed] [Google Scholar]
Haynes 2007
- Haynes B. Of studies, syntheses, synopses, summaries, and systems: the "5S" evolution of information services for evidence-based healthcare decisions. Evidence-Based Nursing 2007;10(1):6-7. [DOI] [PubMed] [Google Scholar]
Higgins 2011
- Higgins J, Green S (editors). Cochrane Handbook for Systematic Reviews of Interventions Version 5.0.1 [updated March 2011]. The Cochrane Collaboration, 2011. handbook.cochrane.org (accessed prior to 15 June 2020).
Hoffman 2004
- Hoffman T, Worrall L. Designing effective written health education materials: considerations for health professionals. Disability and Rehabilitation 2004;26(19):1163-73. [DOI] [PubMed] [Google Scholar]
Kanouse 1995
- Kanouse D, Kallich J, Kahan J. Dissemination of effectiveness and outcomes research. Health Policy 1995;34(3):167-92. [DOI] [PubMed] [Google Scholar]
Kreuter 1996
- Kreuter MW, Strecher VJ. Do tailored behaviour change messages enhance the effectiveness of health risk appraisals? results from a randomized controlled trial. Health Education Research 1996;11(1):97-105. [DOI] [PubMed] [Google Scholar]
Lagarde 2012
- Lagarde M. How to do (or not to do)... Assessing the impact of a policy change with routine longitudinal data. Health Policy Plan 2012;27(1):76-83. [DOI] [PubMed] [Google Scholar]
Lau 2015
- Lau R, Stevenson F, Ong BN, Dziedzic K, Treweek S, Eldridge S, et al. Achieving change in primary care - effectiveness of strategies for improving implementation of complex interventions: systematic review of reviews. BMJ Open 2015;5(12):e009993. [DOI] [PMC free article] [PubMed] [Google Scholar]
Marriott 2000
- Marriott S, Palmer C, Lelliott P. Disseminating healthcare information: getting the message across. Quality in Health Care 2000;9(1):58-62. [DOI] [PMC free article] [PubMed] [Google Scholar]
McGuire 1989
- McGuire WJ. Theoretical foundations of campaigns. In: Rice R, Atkins C, editors(s). Public Communication Campaigns. California: Sage Publication, Inc., 1989. [Google Scholar]
NHS 1999
- NHS Centre for Reviews and Dissemination. Getting evidence into practice. Effective Health Care 1999;5:1–16. [Google Scholar]
Ramsay 2003
- Ramsay CR, Matowe L, Grilli R, Grimshaw JM, Thomas RE. Interrupted time series designs in health technology assessment: lessons from two systematic reviews of behavior change strategies. International Journal of Technology Assessment in Health Care 2003;19(4):613-23. [DOI] [PubMed] [Google Scholar]
Revere 2001
- Revere D, Dunbar P. Review of computer-generated outpatient health behavior interventions: clinical encounters in absentia. Journal of the American Medical Informatics Association 2001;8(1):62-79. [DOI] [PMC free article] [PubMed] [Google Scholar]
RevMan 2014 [Computer program]
- Nordic Cochrane Centre, the Cochrane Collaboration Review Manager 5 (RevMan 5). Version 5.3. Copenhagen: Nordic Cochrane Centre, the Cochrane Collaboration, 2014.
Rogers 1995
- Rogers EM. Diffusion of Innovations. New York: Free Press, 1995. [Google Scholar]
Rosenbaum 2010
- Rosenbaum ME. Improving the User Experience of Evidence: a Design Approach to Evidence-informed Healthcare [PhD thesis]. Oslo: The Oslo School of Architecture and Design, 2010. [Google Scholar]
Sbaffi 2017
- Sbaffi L, Rowley J. Trust and credibility in web-based health information: a review and agenda for future research. Journal of Medical Internet Research 2017;19(6):e218. [DOI] [PMC free article] [PubMed] [Google Scholar]
Schuster 2005
- Schuster MA, McGlynn EA, Brook RH. How good is the quality of health care in the United States? 1998. Milbank Quarterly 2005;83(4):843-95. [DOI] [PMC free article] [PubMed] [Google Scholar]
Seitz 2011
- Seitz P, Rosemann T, Gensichen J, Huber CA. Interventions in primary care to improve cardiovascular risk factors and glycated haemoglobin (HbA1c) levels in patients with diabetes: a systematic review. Diabetes Obesity and Metabolism 2011;13(6):479-89. [DOI] [PubMed] [Google Scholar]
Stergiou‐Kita 2010
- Stergiou-Kita M. Implementing clinical practice guidelines in occupational therapy practice: recommendations from the research evidence. Australian Occupational Therapy Journal 2010;57(2):76-87. [DOI] [PubMed] [Google Scholar]
Straus 2013
- Straus S, Tetroe J, Graham ID. Knowledge Translation in Health Care: Moving from Evidence to Practice. Second edition. Chichester, UK: Wiley Blackwell, 2013. [Google Scholar]
Tseng 1999
- Tseng S, Fogg B. Credibility and computing technology. Communications of the Association for Computing Machinery 1999;42(5):39–44. [Google Scholar]
Wan 2014
- Wan X, Wang W, Liu J, Tong T. Estimating the sample mean and standard deviation from the sample size, median, range and/or interquartile range. BMC Medical Research Methodology 2014;14(135):1-13. [DOI] [PMC free article] [PubMed] [Google Scholar]
Wang 2009
- Wang R, Bartlett G, Grad R, Pluye P. The cognitive impact of research synopses on physicians: a prospective observational analysis of evidence-based summaries sent by email. Informatics in Primary Care 2009;17(2):79-86. [DOI] [PubMed] [Google Scholar]
Wathen 2002
- Wathen CN, Burkell J. Believe it or not: factors influencing credibility on the web. Journal of the American Society for Information Science and Technology 2002;53(2):134-44. [Google Scholar]
Weinmann 2007
- Weinmann S, Koesters M, Becker T. Effects of implementation of psychiatric guidelines on provider performance and patient outcome: systematic review. Acta Psychiatrica Scandinavica 2007;115(6):420-33. [DOI] [PubMed] [Google Scholar]
Wilson 2010
- Wilson PM, Petticrew M, Calnan MW, Nazareth I. Disseminating research findings: what should researchers do? A systematic scoping review of conceptual frameworks. Implementation Science 2010;5:91. [DOI] [PMC free article] [PubMed] [Google Scholar]
Wood 2008
- Wood L, Egger M, Gluud LL, Schulz KF, Juni P, Altman DG, et al. Empirical evidence of bias in treatment effect estimates in controlled trials with different interventions and outcomes: meta-epidemiological study. BMJ 2008;336(7644):601-5. [DOI] [PMC free article] [PubMed] [Google Scholar]
References to other published versions of this review
Farmer 2003
- Farmer AP, Légaré F, McAuley LM, Thomas R, Harvey E, McGowan JL, et al. Printed educational materials: effects on professional practice and health care outcomes. Cochrane Database of Systematic Reviews 2003, Issue 3. Art. No: CD004398. [DOI: 10.1002/14651858.CD004398] [DOI] [PubMed] [Google Scholar]
Farmer 2008
- Farmer AP, Legare F, Turcot L, Grimshaw J, Harvey E, McGowan JL, et al. Printed educational materials: effects on professional practice and health care outcomes. Cochrane Database of Systematic Reviews 2008, Issue 3. Art. No: CD004398. [DOI: 10.1002/14651858.CD004398.pub2] [CD004398] [DOI] [PubMed] [Google Scholar]
Giguere 2012
- Giguere A, Legare F, Grimshaw J, Turcotte S, Fiander M, Grudniewicz A, et al. Printed educational materials: effects on professional practice and healthcare outcomes. Cochrane Database of Systematic Reviews 2012, Issue 10. Art. No: CD004398. [DOI: 10.1002/14651858.CD004398.pub3] [DOI] [PMC free article] [PubMed] [Google Scholar]