Abstract
Cytokine signaling via signal transducer and activator of transcription (STAT) proteins is crucial for optimal antiviral responses of natural killer (NK) cells. However, the pleiotropic effects of both cytokine and STAT signaling preclude the ability to precisely attribute molecular changes to specific cytokine-STAT modules. Here, we employed a multi-omics approach to deconstruct and rebuild the complex interaction of multiple cytokine signaling pathways in NK cells. Proinflammatory cytokines and homeostatic cytokines formed a cooperative axis to commonly regulate global gene expression and to further repress expression induced by type I interferon signaling. These cytokines mediated distinct modes of epigenetic regulation via STAT proteins, and collective signaling best recapitulated global antiviral responses. The most dynamically responsive genes were conserved across humans and mice, which included a cytokine-STAT-induced cross-regulatory program. Thus, an intricate crosstalk exists between cytokine signaling pathways, which governs NK cell responses.
NK cells are cytotoxic lymphocytes capable of rapid and potent effector responses against pathogens and tumors. Their canonical responses have been extensively defined during viral infection, including the release of cytolytic granules that contain the pore-forming protein perforin and proteolytic granzymes, as well as the secretion of the key antiviral cytokine interferon (IFN)-γ1.
Among the many signals that NK cells receive during viral infection are cytokines, many of which are mediated through hetero-multimeric receptors and downstream STAT proteins2. STAT proteins possess distinct preferential pairings with specific cytokine families. For example, type I IFNs consisting of IFN-α and IFN-β primarily activate STAT1 and STAT2, interleukin (IL)-12 predominantly leads to activation of STAT4 and γ-chain family cytokines IL-2 and IL-15 potently activate STAT5 (ref. 5). However, these relationships are not exclusive, as certain STATs can be activated by multiple cytokine signals and certain cytokine families can activate different STATs. For example, STAT1 can additionally be activated by IFN-γ4, type I IFN can activate other STATs5–7 and IL-12 has been suggested to activate STAT1 and STAT5 (ref.8).
In mice and humans, NK cells are crucial to employ early antiviral defenses that control cytomegalovirus (CMV) infection9,10. Proinflammatory cytokines IFN-α, IL-12 and IL-18 are produced early during infection11–15 and play major roles in shaping NK cell responses. IFN-α enhances NK cell cytotoxicity11, whereas IL-12 and IL-18 together promote optimal IFN-γ production, with IL-18 acting as a potent priming agent for IL-12-mediated STAT4 signaling in NK cells15–16. In addition, common γ-chain cytokines IL-2 and IL-15 have supportive roles in driving NK cell proliferation and survival, respectively17–19.
Although studies in CMV have contributed invaluable knowledge about the classic innate responses of NK cells, they have also highlighted the more unconventional adaptive feature of immune memory20. Two types of ‘memory’ NK cells have been described (antigen-dependent and antigen-independent), both of which are long-lived and produce robust secondary responses. The best-studied example of an antigen-specific NK cell response occurs via the recognition of mouse CMV (MCMV) by the activating receptor Ly49H on NK cells21–25. The antigen-independent NK cell response includes ‘cytokine-induced memory-like’ cells, which are generated through the presence of IL-12, IL-18 and IL-15 (ref. 24). Consistent with this, we have previously shown that IFN-α through STAT1, IL-12 through STAT4, IL-2 and IL-15 through STAT5, as well as IL-18, all contribute to optimal NK cell memory formation following MCMV infection16,19,25,26. Understanding the mechanisms by which cytokines shape NK cell memory is key to co-opting these adaptive features for new NK cell therapies. As such, we globally profiled NK cells in response to the cytokines that have the greatest potential to initiate these three hubs of STAT transduction: IFN-α to activate STAT1, IL-12 supported by IL-18 (IL-12/IL-18) to activate STAT4 and IL-2 plus IL-15 (IL-2/IL-15) to activate STAT5. Using these profiles, we deconstructed these cytokine pathways to better understand their complex interactions.
Results
Cytokines peak early during infection.
Because cytokine signaling is crucial for NK cell responses during MCMV infection, we profiled the cytokine milieu over the course of infection in spleen, peripheral blood and liver, known sites of active viral replication. In general, all cytokines peaked between days 1 and 2 (D1 and D2) post-infection (PI), which varied between tissues and in persistence (Fig. 1 and Extended Data Fig. 1). IFN-α, IL-12p70 and IL-18 all peaked at D2 PI in spleen and blood (Fig. 1a,b), but peaked on D1 PI in liver (Extended Data Fig. 1a). In contrast, IL-2 and IL-15 consistently peaked at D1 PI, but remained elevated in both spleen and blood until at least D2 PI (Fig. 1a,b). Although the majority of the cytokines showed rapid drops in levels after their peak, IL-18 in the blood and IL-15 in the blood and spleen, diminished gradually over time (Fig. 1a,b). Furthermore, we confirmed that NK cells sensed these signals, as the levels of phosphorylated STATs in NK cells increased following viral infection (Fig. 1c,d, Extended Data Fig. 1b,c). We conclude that maximum exposure of NK cells to tissue and circulating cytokines occurs within the first 24–48 h after viral infection and that NK cells likely receive these cytokine signals simultaneously.
Fig. 1 |. Cytokine levels and phosphorylation of STATs in NK cells in spleen and blood peak early during MCMV infection.
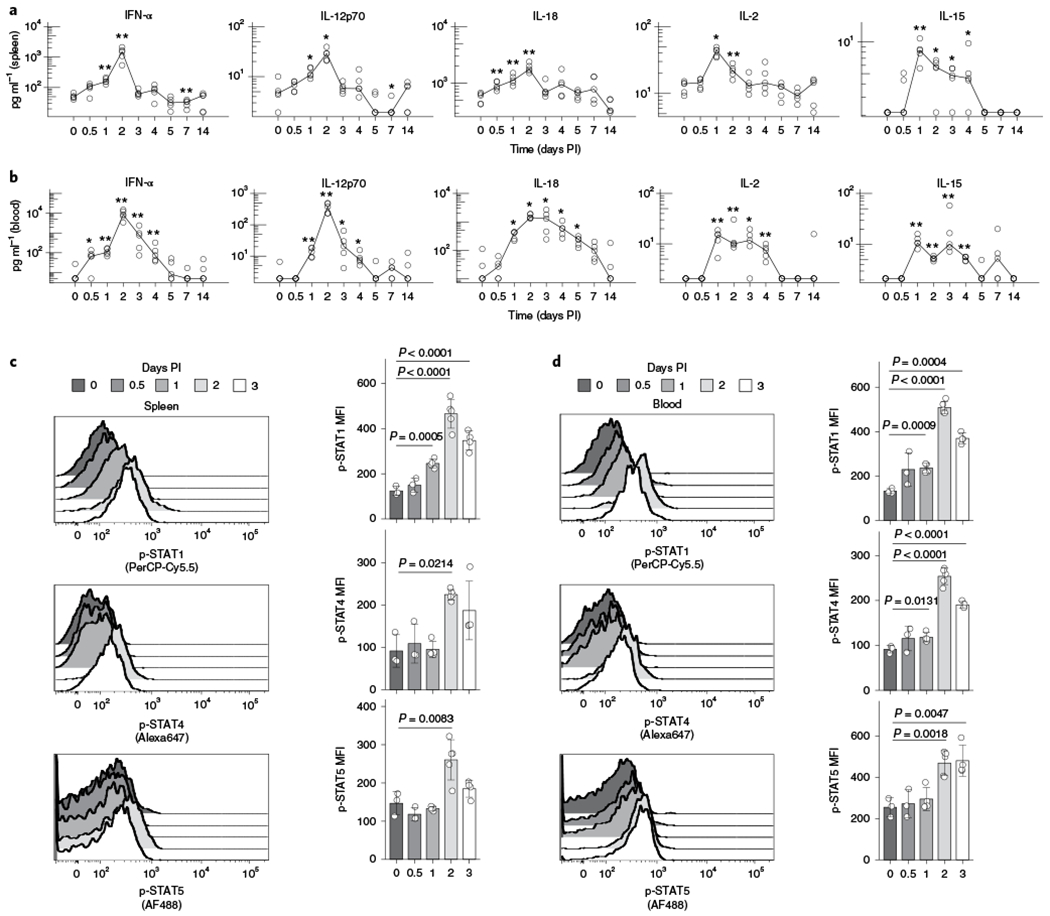
Spleens and blood were collected at days 0, 0.5, 1, 2, 3, 4, 5, 7 and 14 after MCMV infection. Spleens were lysed for protein extracts and serum was collected from blood samples for cytokine measurement. NK cells from spleens and blood were stained for p-STAT1 (Ser), p-STAT4 (Tyr) and p-STAT5 (Tyr). a, Graphs show cytokine levels (pg ml−1) of IFN-α, IL-12p70, IL-18, IL-2 and IL-15 in the spleen over time, with log10 scale on the y axis. Lines connect at medians of each time point. *P = 0.011–0.045, **P = 0.0073–0.0079 from two-sided Mann–Whitney–Wilcoxon test as compared to day 0. b, Same as a, in blood serum. c, Histograms (left) and bar plots (right) depict mean ±s.d. of phosphorylated STAT levels on NK cells (CD3ε−TCRβ−NK1.1+) in the spleen at indicated time points after infection. P values are calculated from two-sided Welch’s t-test as compared to day 0. d, Same as c, in blood serum. MFI, mean fluorescence intensity. n = 5 (a,b) and n = 3–5 (c,d).
Transcriptional cooperation between proinflammatory and homeostatic cytokines.
To dissect out how distinct cytokine signaling pathways contribute to overall compound responses, we applied several methods that globally profiled the transcriptomes, epigenomes and transcription factor binding of NK cells responding to these cytokines (Extended Data Fig. 1d). We first performed transcriptome analysis via RNA-sequencing (RNA-seq) on sorted splenic NK cells (Extended Data Fig. 2a) stimulated with individual or combinations of our three conditions: IFN-α, IL-12/IL-18 and IL-2/IL-15. Principal-component analysis (PCA) segregated IL-12/IL-18-treated from unstimulated cells along the first principal component (PC), indicating that IL-12/IL-18 signaling provided the dominant source of variance (Fig. 2a). IFN-α signaling segregated along the second PC and the combination of IL-12/IL-18 and IFN-α resulted in an overall net effect of the two conditions. Noticeably, IL-2/IL-15-responsive genes contributed to both PCs and when added in combination, provided a supportive contribution by driving the profiles further along the PC. Notably, in the presence of all three cytokine conditions, IL-2/IL-15 predominantly contributed to the IL-12/IL-18 PC despite the presence of IFN-α.
Fig. 2 |. Transcriptional cooperation and antagonism among proinflammatory and homeostatic cytokines.
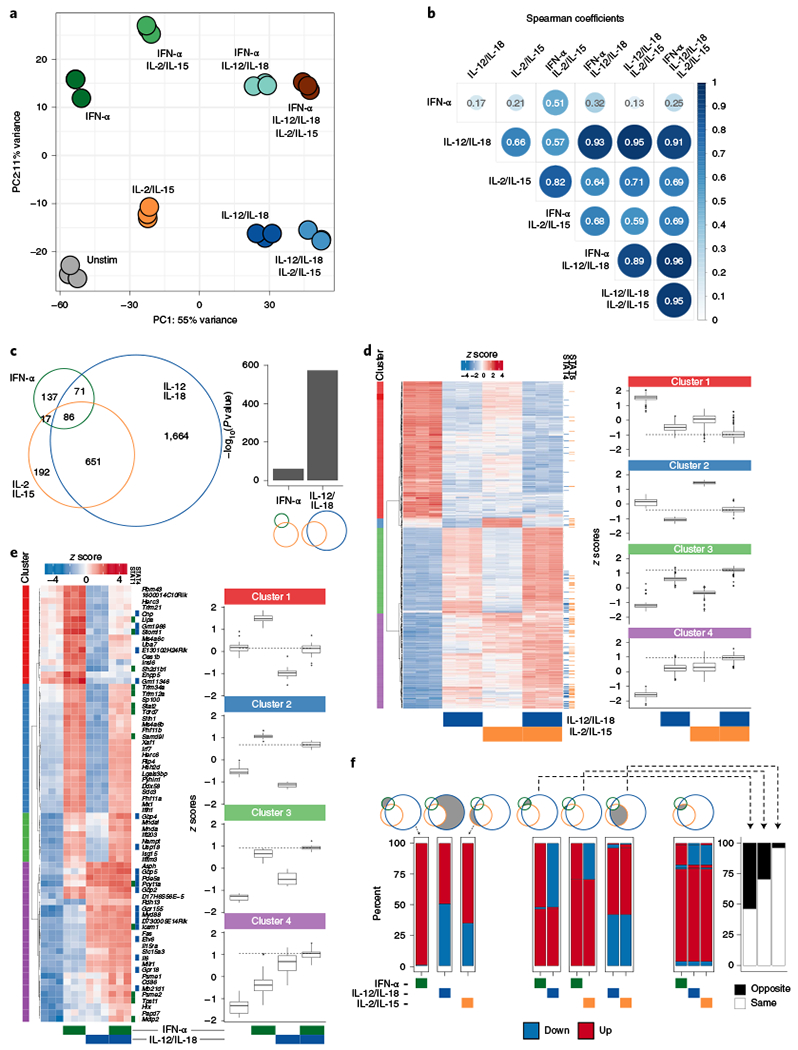
RNA-seq was performed on sorted NK cells (CD3ε−TCRβ−CD19−F4/80−NK1.1+) cultured for 3 h with IFN-α, IL-12/IL-18, IL-2/IL-15 or any combination of the three conditions (n = 3). a, PCA of RNA-seq log-transformed counts on all detectable genes. b, Heat map matrix of Spearman correlation coefficients using log2 FC of each condition as compared to unstimulated from all expressed genes (TPM > 5). Circle sizes are proportional to coefficients. c, Venn diagram depicts numbers of top expressed DE genes (FDR-adjusted P value <0.05, |log2 FC | > 1, TPM > 5) from IFN-α-, IL-12/IL-18- or IL-2/IL-15-stimulated versus unstimulated conditions. Bar graph shows −log10 (P value) of the one-tailed hypergeometric test testing over-representation of IL-2/IL-15 DE genes among IFN-α or IL-12/IL-18 DE genes. d, Heat map of row-scaled log-transformed expression values of the 651 common DE genes only between IL-12/IL-18 and IL-2/IL-15 (left). Tiles to the right of the heat map indicate whether STAT4 (blue) or STAT5 (orange) was bound to the gene by ChIP-seq. Box plots of z scores from each cluster are depicted in the right panel. Dotted lines show median z score of IL-12/IL-18 plus IL-2/IL-15 condition. Center represents median; box represents the limits, first and third percentiles; whiskers show 1.5 × interquartile range. e, As in d, showing the 71 common DE genes only between IFN-α and IL-12/IL-18. f, Stacked bar plots show percent of genes that are either upregulated (red) or downregulated (blue) as compared to unstimulated conditions among DE genes described in c. Bar plot shows percent of genes that change in the opposite (black) or same (white) FC direction (right). FDR, false discovery rate; FC, fold change; TPM, transcripts per million; Unstim, unstimulated.
The overview of these cytokine-responsive profiles suggested a dominant cooperation between proinflammatory IL-12/IL-18 and homeostatic IL-2/IL-15 signaling in NK cells. To test this directly, we first performed differential gene expression analysis on all the different combinations of stimulated versus unstimulated conditions (Supplementary Table 1). Using these fold changes as data points, we found that among the individual conditions, IL-12/IL-18 versus IL-2/IL-15 showed the highest correlation (0.66), greater than with either IL-12/IL-18 versus IFN-α (0.17) or IL-2/IL-15 versus IFN-α (0.21) (Fig. 2b). In agreement, when overlaying the most dynamic differentially expressed (DE) genes shared among conditions, the proportion of IL-2/IL-15 DE genes was significantly more represented among IL-12/IL-18 DE genes than IFN-α DE genes (Fig. 2c and Extended Data Fig. 2b).
Subsequently, we performed hierarchical clustering to summarize the gene expression behavior of the 651 common IL-12/IL-18:IL-2/IL-15 DE genes depicted in Fig. 2c and to compare the profiles of their individual conditions (such as IL-12/IL-18 or IL-2/IL-15 alone) to their combined conditions (such as IL-12/IL-18 plus IL-2/IL-15; Fig. 2d). In clusters 1 and 3, changes were commonly directional and generally more intense with IL-12/IL-18 compared to IL-2/IL-15, but most intense when combined (Fig. 2d). Genes in cluster 1 included Gzmk, Bnip3l, Il7r and Tox, whereas those in cluster 3 included Bcl2l1, Nfkbiz, Prdm1 and Irf4. Cluster 4 behaved similarly to cluster 3, but gene expression was more similar between the two conditions alone (Fig. 2d). Genes in cluster 4 included Id2, Nfil3 and Irf8. The smallest cluster, cluster 2, included Klrb1a, Flt3l and Styk1 and showed opposite effects, with the overall net effect of gene expression similar to baseline (Fig. 2d). Finally, we determined which genes were ‘synergistically’ affected by the presence of both IL-12/IL-18 and IL-2/IL-15 signaling, defined as DE genes in the IL-12/IL-18 plus IL-2/IL-15 condition compared to unstimulated, but not DE by either alone (Extended Data Fig. 2c). Notably, among the top 100 changes was the downregulation of Gata3, which has previously been associated with enhanced proliferation27 and may represent a mechanism by which IL-12/IL-18 and IL-2/IL-15 together modulate cell numbers.
Because IL-12 relays through canonical STAT pathways and IL-18 does not, we further dissected out their roles in this IL-12/IL-18:IL-2/IL-15 cooperation by performing RNA-seq on IL-12- versus IL-18-stimulated NK cells. Approximately two-thirds of the most dynamically changing genes were driven by the combined contribution of both IL-18 and IL-12, with the remaining genes mostly driven by IL-18 alone and a minority by IL-12 alone. Individual contributions mostly behaved cooperatively with IL-2/IL-15 signaling (Extended Data Fig. 2d). Overall, the transcriptional cooperation that occurs between IL-12/IL-18 and IL-2/IL-15 results in both positively and negatively regulated genes that primarily result in enhanced expression changes.
Transcriptional antagonism between proinflammatory cytokine networks.
Surprisingly, among our list of synergistic DE genes downregulated by IL-12/IL-18 plus IL-2/IL-15 was Stat1 (Extended Data Fig. 2c), reported by our network analysis (discussed below) to be bound by both STAT4 and STAT5. Given that STAT1 preferentially signals via IFNAR3, this downregulation of Stat1 by IL-12/IL-18 plus IL-2/IL-15 may reflect a cross-regulatory synergy that limits type I IFN signaling. Compared to unstimulated conditions, this effect was moderate, but upon IFN-α stimulation, IL-2/IL-15 and IL-12/IL-18 alone and together could reduce Stat1 transcript substantially (Extended Data Fig. 3a). Our data thus suggest that in addition to an IFN-α-STAT1-dependent inhibition of IL-12 signaling through STAT4 (refs. 5,28,29), IL-12/IL-18:IL-2/IL-15 cooperation can conversely inhibit Stat1 transcription, potentially to optimize IFN-γ production. These results are consistent with our observed upregulation of Stat1 transcript and STAT1-dependent genes in STAT4-deficient mice and increased IFN-γ in STAT1-deficient NK cells30. The latter was in contrast to what had been observed in vitro31 (Extended Data Fig. 3b), suggesting that additional in vivo signals may help NK cells bypass the requirement for IL-12-dependent STAT1 in its absence.
We explored the crosstalk between IFN-α and IL-12/IL-18 by first focusing on the 71 genes that they uniquely co-regulated (Fig. 2e). Hierarchical clustering highlighted two overarching trends: (1) approximately half of the genes (clusters 1 and 2) were antagonistic, with genes downregulated by IL-12/IL-18 but upregulated by IFN-α; (2) the rest of the genes (clusters 3 and 4) were cooperatively upregulated. In cluster 1, the antagonism generally resulted in a net-zero effect when the two conditions were combined. In cluster 2, which included known type I IFN-inducible genes Mx1, Stat2 and Irf7, IFN-α signaling was dominant and addition of IL-12/IL-18 moderately reduced expression. IL-12/IL-18 signaling was dominant in cluster 4, but still showed a similar yet modest upregulation by IFN-α alone. Notably, STAT4-bound targets were prominent within this cluster, which may represent STAT4 targets induced by IFN-α. We further examined the relative contribution of IL-12 and IL-18 and analyzed the behavior of these antagonistic genes in our IL-12 versus IL-18 RNA-seq dataset. IL-12 and/or IL-18 stimulation yielded gene expression changes that mirrored the behavior of combined stimulation by IL-12/IL-18 (Extended Data Fig. 3c), with a greater proportion induced by IL-18 only, suggesting a more active contribution.
We next examined the 86 genes that were co-regulated by all conditions to see how addition of IL-2/IL-15 contributed to the IFN-α;IL-12/IL-18 interaction. We found that each individual condition modulated gene expression mostly in the same direction, as shown in clusters 1, 3 and 4 (Extended Data Fig. 3d). Furthermore, gene expression levels were similar between conditions that contained IFN-α plus IL-12/IL-18, regardless of the addition of IL-2/IL-15, suggesting that for these genes, IL-2/IL-15 did little to support these changes (Extended Data Fig. 3d).
In summary, analysis of the IFN-α;IL-12/IL-18 transcriptional axis reveals a program whereby IFN-α generally activates gene transcription, with a substantial proportion of these genes being repressed by IL-12/IL-18. Separately, IL-2/IL-15 can supplement this antagonism with a synergistic downregulation of Stat1 transcript. This antagonism is in contrast to the IL-12/IL-18: IL-2/IL-15 axis, where a far greater proportion of genes behaves cooperatively (Fig. 2f).
Individual cytokine conditions promote distinct modes of epigenetic coordination.
We next asked how these cytokines affected the epigenetic landscape by performing assay for transposase-accessible chromatin with high-throughput (ATAC)-sequencing (ATAC-seq) on NK cells stimulated with the same conditions as in Fig. 2, focusing on regions that were differentially accessible (DA) compared to unstimulated cells (Supplementary Table 2). PCA on the top 25% DA regions revealed that the largest changes were caused by IL-12/IL-18 and second by IL-2/IL-15 (Fig. 3a). Unexpectedly, IFN-α contributed little to the variance, showing only six regions that were significantly different (Fig. 3b).
Fig. 3 |. IL-12/IL-18 and IL-2/IL-15 are the predominant mediators of changes in chromatin accessibility.
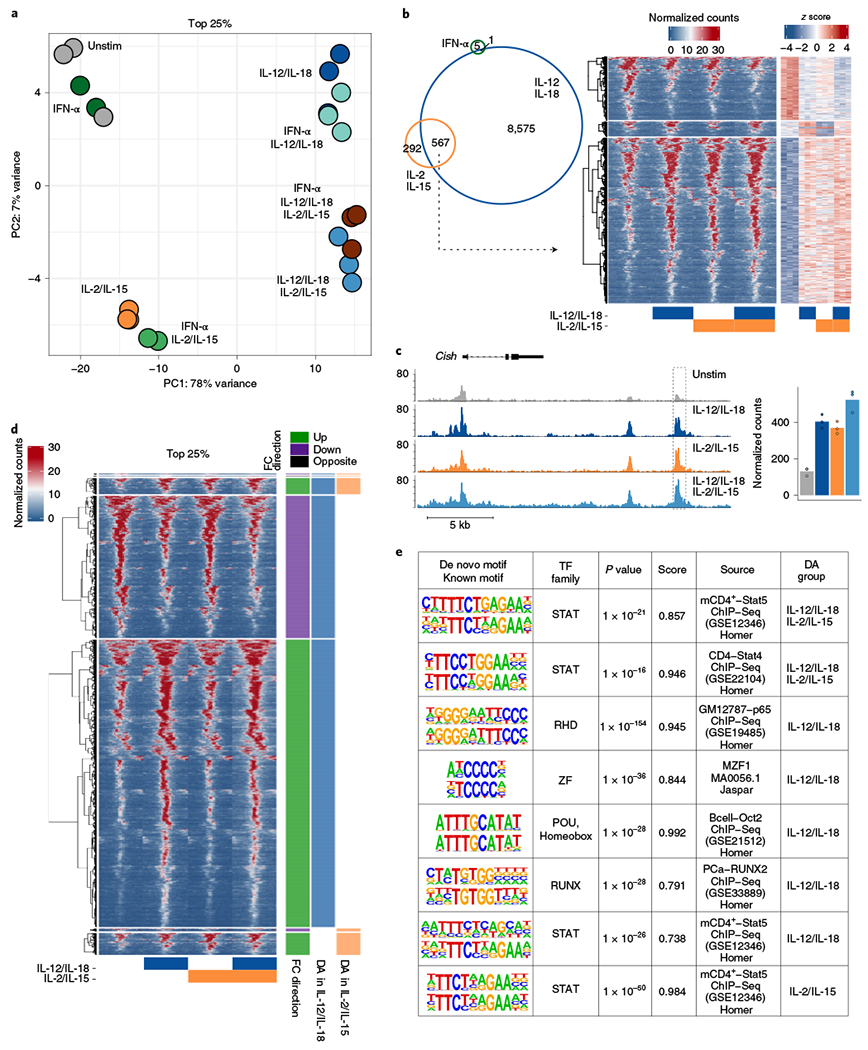
ATAC-seq was performed on sorted NK cells (CD3ε−TCRβ−CD19−F4/80−NK1.1+) cultured for 3 h with IFN-α, IL-12/IL-18, IL-2/IL-15 or any combination of the three cytokine conditions. DA regions were ranked on FDR-adjusted P values from each condition when compared to unstimulated conditions to determine top 25% (n = 2–3). a, PCA of ATAC-seq log-transformed counts on top 25% of DA regions from all conditions. b, Venn diagram depicts numbers of all DA regions (FDR-adjusted P value <0.05) from IFN-α-, IL-12/IL-18- or IL-2/IL-15-stimulated versus unstimulated conditions. Heat map shows peak-centered normalized counts of common DA regions from either IL-12/IL-18 or IL-2/IL-15, as shown in the Venn diagram, with row-matched heat map of z scores (right). c, Gene track shows Cish locus as histogram of normalized reads (y axis) plotted by genome position (x axis). Dashed box highlights the peak region. Bar graph depicts total normalized counts within the peak region. d, Heat map shows peak-centered normalized counts of top 25% DA regions from either IL-12/IL-18- or IL-2/IL-15-stimulated conditions as compared to unstimulated. Clusters are categorized by the direction of the log2 FC versus unstimulated conditions and whether they were top DA in IL-12/IL-18-stimulated conditions (blue), top DA in IL-2/IL-15-stimulated conditions (orange) or both. Peaks are plotted in 50-bp bins across a 2-kb window. e, Table shows results for de novo motif analysis by HOMER software (Methods). From left to right, columns show discovered motif sequence (top) with the best-matched known motif (bottom), best-matched known transcription factor (TF) family, P value, similarity score, source of data used to derive known motif and DA group defined in d. For the IL-12/IL-18 group, the top motifs five ranked by P value are shown.
We then investigated whether the epigenetic landscape also exhibited an IL-12/IL-18:IL-2/IL-15 cooperation by comparing how common DA regions behaved when conditions were combined (Fig. 3b). Their combination moderately enhanced the changes observed with either condition alone (Fig. 3b, right), as exemplified by an intergenic region downstream of the Cish locus (Fig. 3c). These data suggest that IL-12/IL-18 and IL-2/IL-15 signaling can coordinate epigenetic changes that modify chromatin accessibility.
We then extended our analysis to focus on the most robust DA regions that were modulated by either IL-12/IL-18 or IL-2/IL-15. Upon inspection, IL-12/IL-18 DA regions consisted of both decreases and increases in accessibility, whereas common and IL-2/IL-15 DA regions primarily consisted of increases (Fig. 3d). To provide insight into which transcription factors may function at these DA regions, we performed a de novo motif analysis, grouped by whether they were a top DA region only in IL-12/IL-18 conditions, only in IL-2/IL-15 or both, as depicted in Fig. 3d. All three groups identified enriched motifs most closely resembling a STAT motif, supporting a model in which STAT4 and STAT5 promote chromatin accessibility changes through IL-12/IL-18 and IL-2/IL-15, respectively (Fig. 3e). Among the most significant motifs identified within the IL-12/IL-18 DA regions was a Rel-homology domain, associated with the nuclear factor (NF)-κB complex, potentially downstream of IL-18 signaling3. Consequently, we performed ATAC-seq on IL-12- versus IL-18-stimulated NK cells to deconstruct their individual epigenetic contributions. As expected, the top IL-12-induced regions showed enrichment for STAT motifs, whereas the top IL-18-induced regions showed enrichment for NF-κB motifs, confirming the contribution of IL-18 toward these epigenetic changes (Extended Data Fig. 4a).
We previously observed that IFN-α-induced STAT1 primarily localized to promoter regions, in contrast to IL-12/IL-18-induced STAT4 and IL-2/IL-15-induced STAT5, which localized to putative enhancer regions30 (Fig. 4a). Given this STAT1 localization pattern, yet lack of accessibility changes in response to IFN-α (Fig. 3a), we assayed for H3K4me3, a permissive histone mark enriched at promoter regions32. In response to IFN-α, we detected a general increase in H3K4me3 signal as measured by chromatin immunoprecipitation (ChIP)-seq, demonstrating that IFN-α can indeed augment permissive epigenetic alterations at promoter sites (Fig. 4b,c and Supplementary Table 3). Of these changes, a substantial proportion exhibited a significant reduction in signal in STAT1-deficient cells (cluster 1), whereas the remainder showed a more modest and collective trend of decreased activity (cluster 2; Fig. 4b,d). The latter included the loci of Stat1 and Stat2, genes bound by STAT1 and upregulated by IFN-α33 (Fig. 4d) and may represent instances where STAT1 alone is insufficient for complete epigenetic remodeling. In either scenario, these epigenetic changes at the same regions were undetectable by chromatin accessibility (Fig. 4e). Overall, our studies highlight distinct modes of epigenetic alteration between STAT1-dependent type I IFN signaling and signaling induced by IL-12/IL-18 and IL-2/IL-15.
Fig. 4 |. IFN-α promotes changes in H3K4me3 enrichment at promoter regions.
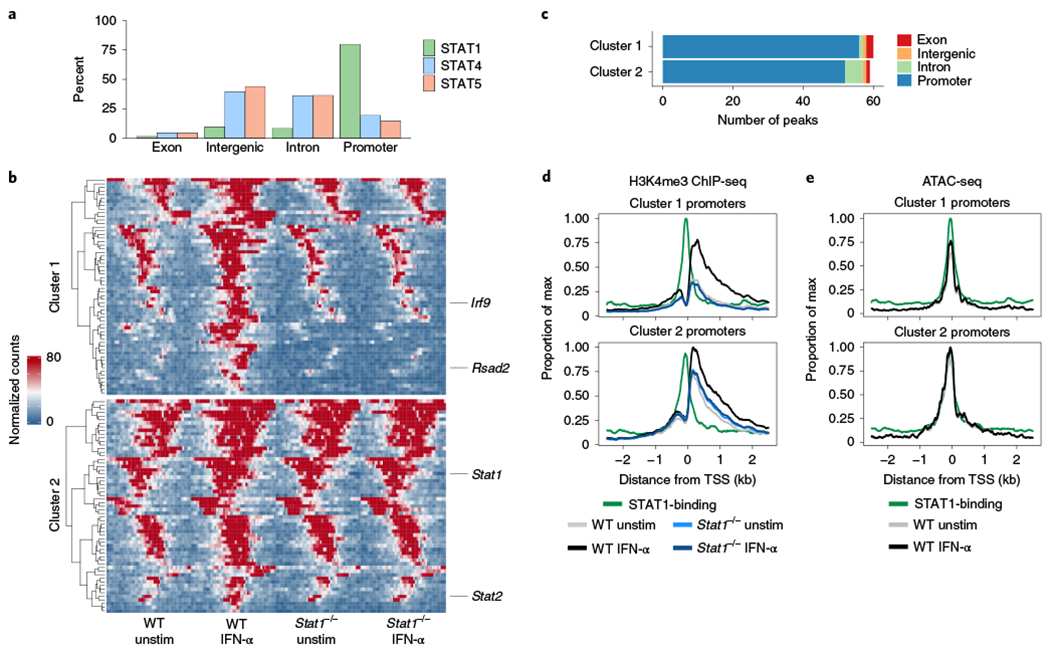
H3K4me3 ChIP-seq was performed on sorted NK cells (CD3ε−TCRβ−CD19−F4/80−NK1.1+) cultured for 3 h with or without IFN-α from WT or Stat1−/− spleens (n = 2–5 replicates per ChIP condition). a, Bar graph shows percentage of peaks bound by indicated STAT by ChIP-seq categorized by region type. b, Heat map shows peak-centered normalized counts of DA regions (FDR-adjusted P value <0.05). Clusters 1 and 2 show regions that are significantly different comparing IFN-α-stimulated to unstimulated, with cluster 1 showing significant differences when comparing WT stimulated to Stat1−/− stimulated. Peaks are plotted in 100-bp bins across a 5-kb window. c, Bar plot shows number of peaks within each cluster categorized by region type. d, Line plots depict meta coverage of all promoter regions in either cluster 1 or cluster 2. e, Line plots depict meta coverage for ATAC-seq signal for same regions described in d. TSS, transcriptional start site; WT, wild type.
Cytokine–STAT network converges to promote a negative feedback loop.
Because of the array of cytokines that can activate STATs and the multivariate pathways that STATs can initiate, we compiled a highly focused network of cytokine-induced STAT targets. We first analyzed several ChIP-seq datasets generated by our group and others that pulled down STAT1, STAT4 and STAT5 in response to IFN-α, IL-12/IL-18 and IL-15 (with and without IL-2), respectively33–35. Although IL-18 alone did not induce STAT4 phosphorylation, many STAT4-bound regions were co-regulated by IL-18 in addition to IL-12 (Extended Data Figs. 3b and 4b), suggesting an epigenetic coordination in facilitating STAT4 activity. Thus, we continued our analyses using the combination of IL-12/IL-18 as a collaborative proinflammatory stimulus that optimized STAT4 activity. We filtered on genes that were both bound by each STAT and highly changed by its paired cytokine-stimulated conditions. These STAT–cytokine-induced gene pairs were then tabulated and visualized as a network to show cross STAT–cytokine interactions (Supplementary Table 4 and Fig. 5a).
Fig. 5 |. Integration of cytokine-induced transcriptional and STAT-binding profiles reveal cross-regulatory interactions.
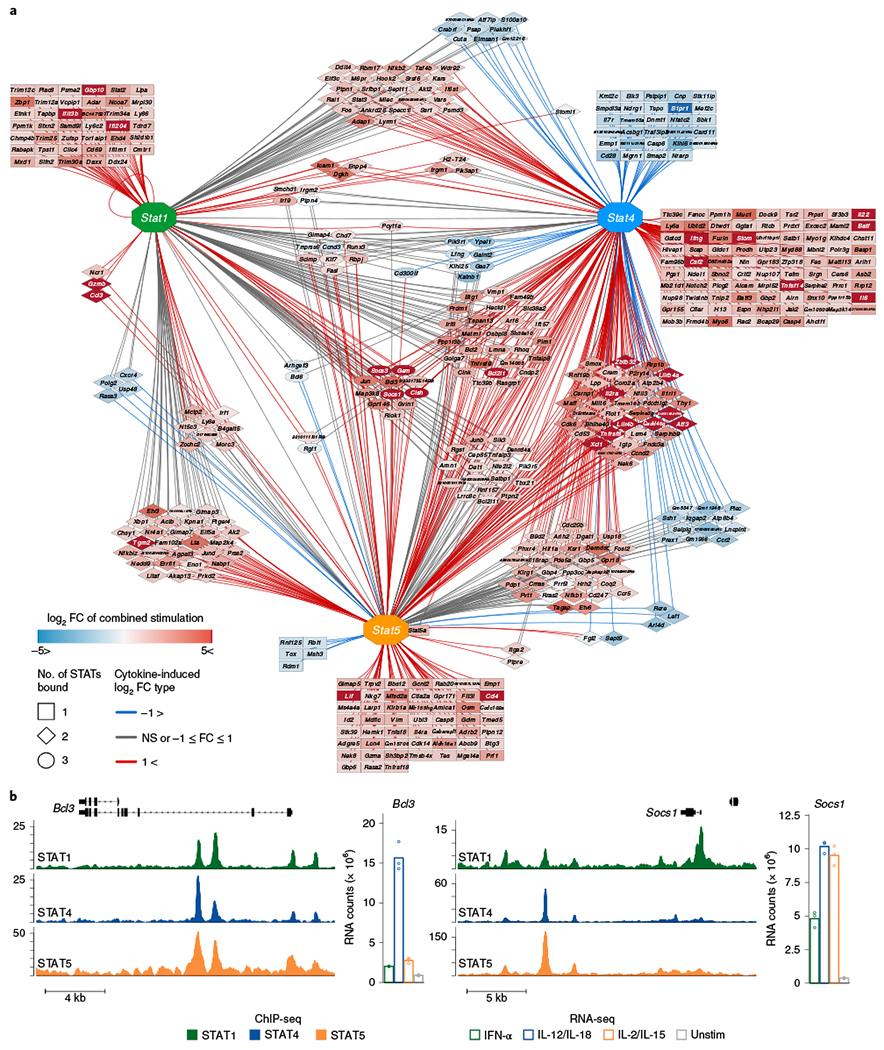
ChIP-seq was performed on DNA from sorted NK cells that were stimulated and pulled down with either IFN-α and STAT1 (ref. 33), with IL-12/IL-18 and STAT4 (ref. 34) or with either IL-2/IL-15 (this paper) or IL-15 alone35 and STAT5. RNA-seq was performed as described in Fig. 2 (n = 2–3 per stimulated WT STAT ChIP). a, Shown are top cytokine-induced DE genes (FDR-adjusted P value <0.05, |log2 FC|>1, TPM > 5) that were also bound by their paired STAT. All connections depict binding of connected STAT within or proximal to the gene. Edges depict nature of transcriptional changes as compared to unstimulated conditions: red, upregulation; blue, downregulation; gray, nonsignificant (NS) or low FC. Nodes depict target genes, with color gradient proportional to the magnitude of FC from the experimentally combined cytokine condition, when applicable. b, Gene track shows ChIP-seq signal at indicated loci. Shown are normalized reads scaled to 1× coverage (y axis) plotted by genome position (x axis). Bar graph depicts normalized counts of indicated genes from RNA-seq.
This network analysis confirmed several previously described STAT gene relationships, including the autoregulation of Stat1 (ref. 33), STAT4 induction of Ifng36 and STAT5 induction of Prf1 (ref. 37). In addition, the analysis depicted several groups of genes that were either co-bound or co-regulated by other STAT–cytokine pathways (Fig. 5a). For example, Bcl2, a reported target of STAT5 (ref. 35) was not only upregulated by IL-2/IL-15 and bound by STAT5, but also upregulated by IL-12/IL-18, bound by both STAT4 and STAT1. Irf9, a component of the ISGF3 complex, was upregulated by IFN-α and bound by STAT1, as previously described33, as well as co-bound by both STAT4 and STAT5.
We then focused on genes that were commonly bound by all STATs and induced by all cytokines (Fig. 5a). Notably, we found that all three STATs in response to their respective cytokines converged to upregulate genes encoding for several negative regulators of signal transduction, including Cish, Bcl3, Socs1 and Socs3 (Fig. 5a,b). This finding highlights a cross-regulatory mechanism of redundant transduction that may be in place to ensure the limitation of excessive signaling.
Combined cytokine cocktail best correlates with early infection in vivo.
Given the presence of cytokines in the spleen during early in vivo MCMV infection (Fig. 1a), we investigated the extent to which our in vitro systems globally compared to the in vivo setting. Consequently, we re-analyzed previously published RNA-seq and ATAC-seq datasets on Ly49H+ NK cells collected ex vivo throughout MCMV infection30, as well as extended our epigenetic profiling to include an in vivo time course that measured H3K4me3. To correlate global profiles between in vivo and in vitro conditions, all NK cells from infected mice were compared to naive (D0) and then matched to cytokine-induced NK cells that were compared to unstimulated conditions (Supplementary Tables 1, 5 and 6). As expected, all the cytokine-stimulated conditions showed the highest correlations with D2 PI among all other days (Extended Data Fig. 5a–c). When comparing all the different cytokine conditions to D2 PI, we found that the presence of all cytokines consistently showed the highest correlation value for transcription and accessibility, but not for H3K4me3 signal (Fig. 6a–d and Extended Data Fig. 5d,e). Transcriptionally, IFN-α plus IL-12/IL-18 were equally as correlated as all conditions (Fig. 6c), whereas IL-12/IL-18 signaling alone seemed to best mirror in vivo measurements of H3K4me3 (Extended Data Fig. 5e).
Fig. 6 |. Combination of proinflammatory and homeostatic cytokines best correlates with early MCMV infection in vivo.
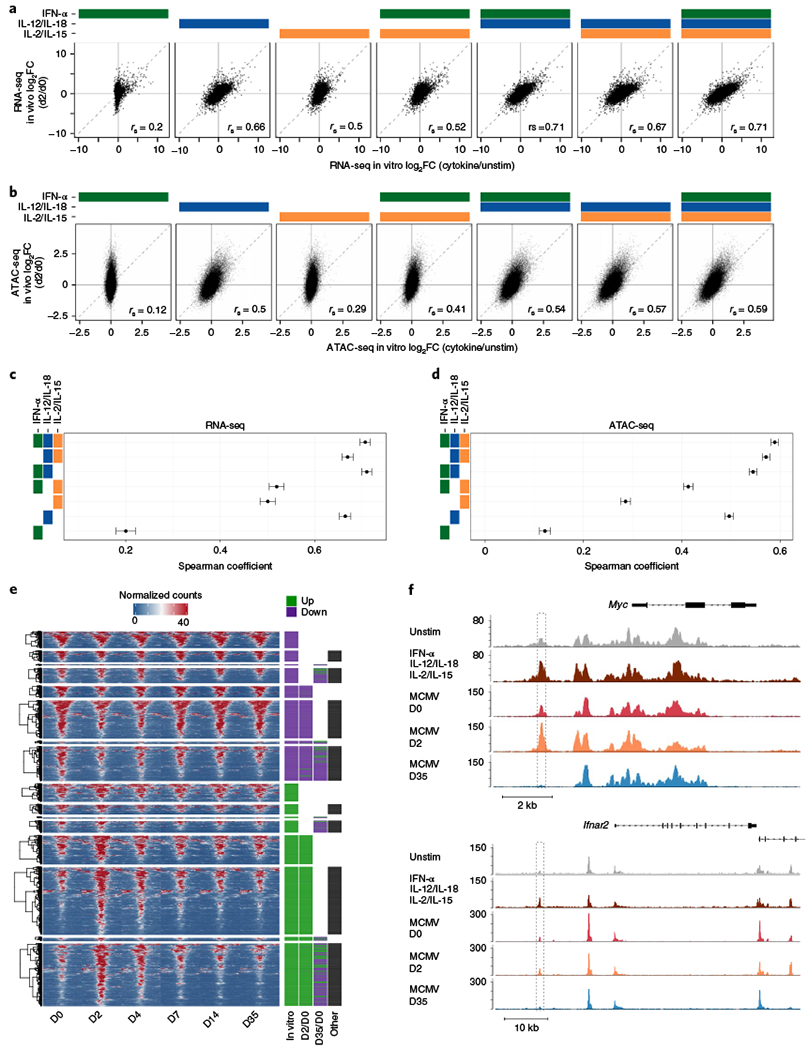
For in vitro studies, RNA-seq and ATAC-seq were performed as described in Figs. 2 and 3, respectively. For in vivo studies, RNA-seq and ATAC-seq were performed on sorted on Ly49H+ NK cells (CD3ε−TCRβ−CD19−F4/80−NK1.1+Ly49H+) at indicated time points after MCMV infection, as previously described30. For in vitro studies, n = 2–3 and for in vivo studies, n = 2–4. a, Scatter-plots of RNA-seq log2 FC comparing cytokine-stimulated versus unstimulated (x axis) conditions to d2 PI versus d0 (y axis). b, As in a, for ATAC-seq. c, Center dots indicate Spearman correlations calculated from RNA-seq values depicted in a. Ranges show 95% confidence interval calculated by Fisher’s z-transformation. d, As in c, for ATAC-seq. e, Heat map shows peak-centered normalized counts of in vivo time-course regions that overlap with in vitro top 25% DA regions (FDR-adjusted P value <0.05) ranked on P value and derived from comparing IFN-α + IL-12/IL-18+ IL-2/IL-15 versus unstimulated conditions. Clusters are categorized by the FC direction of the in vitro DA peak reference (in vitro), whether the peak is DA (FDR-adjusted P value <0.05, |log2 FC| > 0.5) in in vivo d2 PI versus d0 comparisons (D2/D0), whether the peak is DA in the memory time point (D35/D0) and whether the peak is DA in d4, d7 or d14 PI versus d0, as indicated with the black box (other). Purple annotations indicate decreases in accessibility and green indicates increases. Peaks are plotted in 50-bp bins across a 2-kb window. f, Gene tracks show examples of cytokine-regulated memory peaks as histograms of normalized reads (y axis) plotted by genome position (x axis). Dashed boxes highlight peak regions.
To gain insight into how these early cytokine-induced epigenetic changes behave in memory NK cells, we tracked how accessibility of the cytokine-induced DA regions changed throughout MCMV infection (Fig. 6e). Given that the presence of all conditions best represented in vivo accessibility, we followed the fate of the top 25% DA regions altered by IFN-α, IL-12/IL-18 and IL-2/IL-15 in combination. As expected, most in vitro DA regions coincided with in vivo DA regions that changed at D2 PI, whereas a minority showed exclusive differences in days that were not D2 or D35 PI (Fig. 6e). Notably, in vivo D2 regions overall behaved similarly as their matched in vitro peak, as both consistently became more open or more closed (Fig. 6e). In contrast, cytokine-mapped in vivo memory D35 regions generally adopted a more closed configuration, as exemplified with the Myc and Ifnar2 loci (Fig. 6f). These changes may explain the observation that memory NK cells become less responsive to bystander cytokines compared to naive NK cells38,39.
We next tested how these cytokine cocktails affected in vivo effector functions that are often modeled in vitro. In accordance with our transcriptional data (Extended Data Fig. 3d), the combination of IL-12/IL-18 and IL-2/IL-15 drove the majority of the IFN-γ production, with a moderate boost when all conditions were combined (Extended Data Fig. 6a). Combining conditions yielded trends of better cytotoxicity than single conditions, especially when both IFN-α and IL-2/IL-15 were included, consistent with the co-induction of Gzmb by the two signaling pathways (Extended Data Fig. 6b and Fig. 5a). During extended stimulation, IL-15 was the main driver of proliferation, whereas IL-12 inhibited proliferation in this in vitro setting devoid of antigen (Extended Data Fig. 6c), in contrast to MCMV infection25, consistent with previous studies40,41. Together, these studies highlight a division of labor across cytokine conditions that support NK cell activity; however, additional conditions present in vivo are required to fully optimize their effector potential.
Highly-induced changes by cytokines are conserved between human and mice.
Given the clinical relevance of cytokine-induced memory NK cells as a form of immunotherapy42, we aimed to provide a cross-species analysis of the cytokine-induced transcriptome in mice and humans. To this end, we performed RNA-seq on NK cells sorted from six healthy donors and stimulated with either IFN-α, IL-12/IL-18 or IL-2/IL-15 at concentrations validated for human lymphocytes (Extended Data Fig. 7a,b). In contrast to mice, human NK cells responded more robustly to IFN-α (Extended Data Fig. 7c,d), perhaps due to the increased dose compared to mouse studies. Nevertheless, IL-12/IL-18- versus IL-2/IL-15-stimulated human NK cells clustered closer to each other in PCA and, similar to mice, showed the highest correlation (0.58), supporting the presence of a conserved cooperation between the two conditions (Extended Data Fig. 7c,e). Analysis of the top DE genes validated several known inducible genes shared between mouse and human, including MX1 in response to IFN-α, IFNG in response to IL-12/IL-18 and SOCS2 in response to IL-2/IL-15 (ref. 43) (Extended Data Fig. 7f).
Using mappable and expressed orthologs (Extended Data Fig. 8a,b and Supplementary Table 7), we compared global trends between mouse and human by performing PCA on matched cytokine-stimulated samples (Fig. 7a). Relative to unstimulated conditions, patterns diverged between human and mouse, as IFN-α and IL-12/IL-18 segregated to a comparable extent in human, whereas IL-12/IL-18 separated to a greater degree in mouse (Fig. 7a and Extended Data Fig. 7d). Similar trends were seen when PCA was performed on replicate-corrected values, which inherently accounted for differences in species and highlighted cytokine-induced differences found within each matched mouse or donor (Extended Data Fig. 8c). This analysis depicted high similarity between IL-2/IL-15 samples between mouse and human and baseline differences between unstimulated mouse and human NK cells.
Fig. 7 |. Highly modulated genes induced by cytokines are conserved between mice and humans.
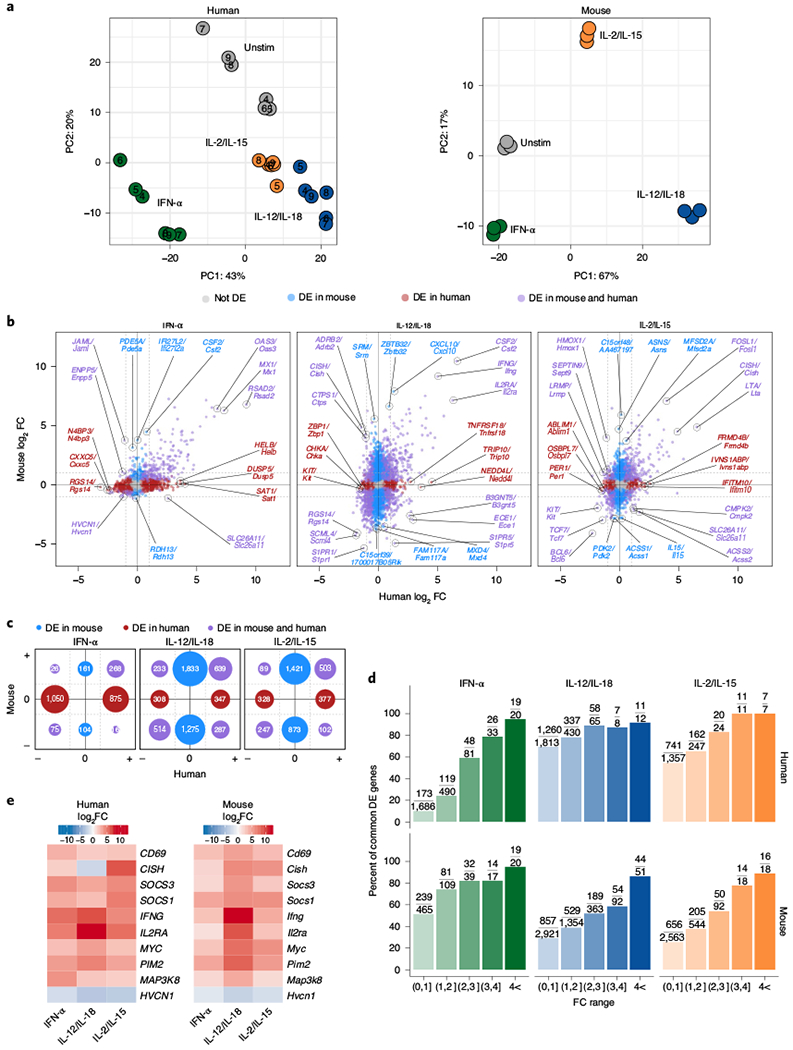
For human data, RNA-seq was performed on sorted NK cells (CD3ε−CD14−CD56+) purified from peripheral blood mononuclear cells (PBMCs) of healthy donors and cultured for 3 h with IFN-α, IL-12/1L-18 or IL-2/IL-15. Mouse data were collected as described in Fig. 2. All genes shown are analyzed from commonly expressed mapped orthologs (Methods). All DE genes are compared to unstimulated conditions. For mouse, n = 3 and for human, n = 6. a, PCA of RNA-seq log-transformed counts in humans (left, corrected for donor) and mice (right). b, Scatter-plots of RNA-seq log2 FC comparing DE orthologs from human datasets (x axis) and mouse datasets (y axis). Red indicates orthologs that were DE (FDR-adjusted P value <0.05) only in human, blue highlights orthologs that were only DE in mouse and purple shows those that were DE in both. Top three genes ranked on average FC from each group and direction of FC are marked, c, Graphical schematic of total number of DE genes depicted in b. Location and colors of circles mirror fold change directions of DE genes and DE category, respectively. Circle sizes are proportional to number of genes. d, Bar plot shows percentage of orthologs that are common DE genes out of total human (top) or mouse (bottom) DE genes found within the FC range. Absolute numbers are shown as fractions above each bar plot. e, Heat map of top DE genes that are both common to mouse and human and common to all three cytokine stimulations that all show a |log2 FC|> 1.
Next, we directly compared the relative changes that occurred in response to each cytokine condition between mice and humans. Each condition displayed genes that were uniquely DE in either mice or humans (Fig. 7b,c). For example, Csf2 was upregulated in response to IFN-α in mice but not in humans. Likewise, IL-12/IL-18 upregulated TNFRSF18 in human NK cells but not in mouse cells. However, genes that showed the strongest changes were enriched for genes that were commonly DE between mice and humans, as the proportion of common DE genes generally increased as the magnitude of the fold change increased (Fig. 7d). We therefore conclude that genes that are the most responsive to in vitro cytokine stimulations have a high representation of genes that show common levels of modulation between humans and mice.
Finally, our previous analyses on the crosstalk between these cytokine signaling pathways prompted us to ask whether similar interactions occur in human NK cells. Consequently, we integrated all three cytokine signaling pathways between mouse and human to look for any commonalities. Notably, four of the ten most dynamically regulated and conserved genes were also found in our STAT–cytokine network analysis (Fig. 5a): SOCS1/Socs1, SOCS3/Socs3, CISH/Cish and MAP3K8/Map3k8 (Fig. 7e and Extended Data Fig. 8d). Of note, BCL3 was also significantly altered across all conditions, but to a lesser extent (Extended Data Fig. 8d). This shared induction of suppressive proteins suggests that there exists an integrated and conserved self-regulatory system in place to counter STAT signaling in humans and mice.
Discussion
The complexity of signals that NK cells receive creates a barrier in understanding individual contributions of these signals and how they collectively contribute to the net effect. We therefore approached this problem by comprehensively profiling NK cells stimulated with either isolated or combined signals from three major cytokine–STAT pathways and reconstructing their networks in a step-wise manner. This method illuminated (1) a global cooperation between proinflammatory IL-12/IL-18 and homeostatic IL-2/IL-15 signaling; (2) a synergistic mechanism between the IL-12/IL-18 and IL-2/IL-15 axes to limit IFN-α signaling through STAT1; (3) divergent mechanisms of epigenetic regulation promoted between STATs; and (4) a cross-regulatory program that spanned all three cytokine–STAT pathways. We then assessed how these isolated in vitro systems compare to early in vivo settings of MCMV infection and found that presence of all three cytokine signals collectively best represents in vivo activation among the different conditions tested. Finally, we observed that the transcriptional changes showing the most dynamic range in gene expression were conserved between mouse and human.
Our study provides a starting point toward a more complete representation and understanding of the complex inputs that program NK cells during viral infection. While our study covers three major cytokine–STAT signaling pathways required for optimal NK cell responses during MCMV infection19,25,26, additional STAT molecules such as STAT3 and STAT6 may contribute. Moreover, temporal and spatial regulation of cytokine signals is another variable that can fine-tune the NK cell response. For example, IFN-α has been reported to be expressed in two waves during viral infection, peaking initially around 8–12 h PI12. Thus, the sequential introduction of these cytokines may provide alternate responses. Finally, we postulate that the conclusions drawn from these in vitro projections vary depending on pathogen. In contrast to MCMV, lymphocytic choriomeningitis virus (LCMV) induces high amounts of type I IFN that limit IL-12 (ref. 44) and thus in vivo global correlations will differ. Ultimately, cytokine dosage and temporal regulation likely impact the magnitude and kinetics of the effects that we see in the transcriptional and epigenetic landscape, so the observations that we describe are limited to a best approximation based on the available data and literature. Nevertheless, we have provided groundwork for future studies to fully resolve these details.
A pertinent consideration when comparing our mouse and human transcriptomes is the extent of how ‘naive’ these human NK cells are to begin with. Unlike laboratory mice, humans are constantly exposed to a variety of pathogens. It is tempting to speculate that human NK cells may actually reflect a cellular state closer to that of an effector or memory-like NK cell and therefore respond differently to cytokines, suggested by findings in mice38. More precise studies that tease out the dose- and timing-dependent differences between cytokine conditions are certainly warranted. Regardless, NK cells are a promising form of immunotherapy that offers an off-the-shelf alternative to cell-based therapies. Recent studies in mice have pioneered a proof-of-principle approach of generating in vitro cytokine-induced memory cells24,42,45,46. Our current study provides an important resource that begins to uncover the underlying molecular mechanisms driving potent effector and memory NK cell responses in both mouse and human, which can be utilized to support therapeutic strategies.
Recently, we and others have highlighted a common underlying molecular program that is shared between differentiating NK cells and CD8+ T cells during infection30,47,48. Therefore, we believe that the global profiles provided in this study using NK cells will bridge a better understanding of how T cells are concurrently receiving these cytokine cues during host immune responses. The potential relevance may be applied to immunotherapy of chimeric antigen receptor T cells, where cytokine signaling via IL-12 and IL-15 can facilitate T cell response and expansion49. Given the shared epigenetic features between memory CD8+ T cells to naive NK cells30, the response to these cytokines may contain parallels in these cell types and cooperation between STAT4 and STAT5 may represent a way to enhance the efficacy of chimeric antigen receptor T cells.
In summary, our study provides an essential resource to the scientific community that can guide targeted experimentation and broaden our collective understanding of cytokine signaling. These global transcriptional and epigenetic profiles have the potential to complement both basic and translational studies, to propel us toward the goal of implementing safer and more effective immunotherapies.
Methods
Mice.
All mice used in this study were bred at Memorial Sloan Kettering Cancer Center in accordance with the guidelines of the Institutional Animal Care and Use Committee. The following strains were used, all on the C57BL/6 genetic background: WT CD45.2 (the Jackson Laboratory), WT CD45.1 (B6.SJL; Taconic), Stat1−/− (ref. 4), NKp46-CreERT2 transgenic mice39, Rosa26-lox-STOP-lox-tdTomato50. Male and female 6–8-week-old mice were used at the onset of experiments.
Viral infection.
WT or NKp46-CreERT2 Rosa26-tdTomato were infected with MCMV (Smith strain) by intraperitoneal injection of 7.5 × 10³ plaque-forming units in 0.5 ml.
In vivo measurement of cytokine levels during MCMV infection.
WT mice were infected and killed on days 0.5, 1, 2, 3, 4, 5, 7 and 14 after viral infection. Uninfected age-matched mice were used as controls. For protein extraction, spleens and livers were mechanically disrupted and homogenized in nine volumes of Greenberger lysis buffer (300 mM NaCl, 15 mM Tris, 2 mM MgCl2, 2 mM Triton-X-100, pH 7.4) plus cOmplete, Mini, EDTA-free Protease Inhibitor Cocktail Tablets (Roche). Protein lysis buffer volumes were normalized to tissue weight. Blood serum was collected by centrifugation of whole blood at 1,000g for 20 min. Cytokine content was quantified by BioLegend LEGENDplex bead-based immunoassay for a customized panel of cytokines according to the manufacturer’s protocol.
Isolation of mouse NK cells and flow cytometry.
Spleens were dissociated using glass slides and filtered through a 100-μm strainer. Flow cytometry and cell sorting were performed on the LSR II and Aria II cytometers (BD Biosciences), respectively. Before cell sorting, NK cells were enriched by incubation of whole splenocytes with the following antibodies at 20 μg ml−1:CD3ε (17A2), CD4 (GK1.5), CD8 (2.43), Ter119 (TER-119), CD19 (1D3), Ly6G (1A8) (BioXCell) and magnetic depletion using goat anti-rat beads (QIAGEN). For all in vitro cytokine stimulations, NK cells were sorted using the following fluorophore-conjugated antibodies (BD Biosciences, eBioscience, BioLegend, Tonbo, R&D Systems) at a 1:200 dilution, unless otherwise indicated: CD3ε (17A2), TCRβ (H57-597), CD19 (6D5), F4/80 (BM8), NK1.1 (PK136) and Fixable Viability Dye eFluor 506 (1:400 dilution). For infection time points, NK cells were additionally sorted using Ly49H (1:200 dilution; 3D10, eBioscience/BD Biosciences) and CD69 (d2 only, 1:100 dilution, H1.2F3, BioLegend) from WT mice on days 0, 2, 4 and 7. For the memory time point, NK cells were collected at D35 PI from NKp46-CreERT2 Rosa26-tdTomato mice that were gavaged with 4 mg tamoxifen (Sigma) in corn oil 1 d before infection. Memory NK cells were sorted additionally using Ly49H and tdTomato. For RNA-seq and ChIP-seq, cell populations were sorted to >95% purity. Data were analyzed with FlowJo software (Tree Star). Intracellular IFN-γ was stained using BD Cytofix/Cytoperm (BD Biosciences) per manufacturer’s instructions. For detection of phosphorylated STATs, cells were fixed with 4% PFA for 10 min at 37 °C after cell surface staining, washed with PBS, permeabilized with ice-cold 100% methanol for 10 min and washed again with PBS + 2% FBS. Cells were stained with the following antibodies: p-STAT1 (1:100 dilution, pSer727, A15158B, BioLegend), p-STAT1 (1:50 dilution, pTyr701, 4a, BD Biosciences), p-STAT4 (1:100 dilution, pY693, 38/p-Stat4, BD Biosciences) and p-STAT5 (1:100 dilution, pY694, C71E5, Cell Signaling Technology).
In vitro stimulation of mouse NK cells.
A total of 2–4 × 10⁴ mouse NK cells were purified and stimulated for 3 h in RPMI plus medium supplement (10% FBS, 1× sodium pyruvate, 1× l-glutamine, 1× pen/strep, 1× MEM-NEAA) with 20 ng ml−1 mouse IL-2 (Thermo Fisher Scientific), 20 ng ml−1 mouse IL-15 (R&D Systems), 20 ng ml−1 mouse IL-12 (R&D Systems), 10 ng ml−1 mouse IL-18 (MBL) and/or 100 IU mouse IFN-α (R&D Systems). Cells were cultured in medium alone as unstimulated controls.
Cytotoxicity assay.
Purified splenic NK cells were co-cultured with YAC-1 cells labeled with Calcein AM (Thermo Fisher Scientific, C1430) at a 12:1 effector:target ratio for 4 h at 37 °C, 5% CO2 in RPMI plus medium supplement, 2-mercaptoethanol and 10 mM HEPES (pH 7.0) in the absence or presence of indicated cytokines. Calcein AM-labeled YAC-1 cells in medium only or in the presence of 2% Triton-X-100 were used as negative and positive control, respectively. After 4 h, supernatants were collected and the amount of released calcein was measured with Spark Multiplate reader (TECAN) at excitation wavelength of 485 ± 9 nm and emission wavelength of 525 ± 15 nm. Percent lysis was calculated by (DFluorescenceexperimental − negative control/DFluorescencepositive control − negative control) × 100.
In vitro proliferation assay.
Sorted splenic NK cells were stained with CellTrace Violet (Thermo Fisher Scientific, C34557) per manufacturer’s protocol. After staining, labeled NK cells were cultured in Iscove’s modified Dulbecco’s medium plus medium supplement, 10 mM HEPES (pH 7.0), 2-mercaptoethanol and human IL-15 (50 ng ml−1; Miltenyi Biotech) unless otherwise stated and in the absence or presence of indicated cytokines for 3 d.
Isolation of human NK cells and flow cytometry.
Peripheral blood was collected from healthy donors using protocols approved by the Memorial Sloan Kettering Cancer Center Institutional Review Board (nos. 06-107 and 95-054). Specific processing on these samples was performed under Biospecimen Research Protocol Institutional Review Board no. 16-1564. Donors provided informed written consent. PBMCs were isolated by Ficoll gradient purification. Flow cytometry and cell sorting were performed on the LSR II and Aria II cytometers (BD Biosciences), respectively. NK cells were sorted and/or phenotyped from PBMCs by using the following fluorophore-conjugated antibodies at a 1:50 dilution, unless otherwise indicated: DAPI, CD3ε (1:200 dilution, UCHT1, BD Biosciences), CD56 (1:100 dilution, N901, Beckman Coulter) and CD14 (M5E2, BD Biosciences), CD57 (HCD57, BioLegend) and NKG2C (134591, R&D). Cells were sorted to >95% purity.
In vitro stimulation of human NK cells.
A total of 1 × 10⁵ human NK cells were purified and stimulated for 3 h in RPMI plus medium supplement with 100 U ml−1 recombinant human IL-2 (Proleukin, Prometheus), 50 ng ml−1 recombinant human IL-15 (Miltenyi), 20 ng ml−1 recombinant human IL-12 (Peprotech), 50 ng ml−1 recombinant human IL-18 (MBL) or 1,000 U ml−1 recombinant human IFN-α (Peprotech).
Chromatin immunoprecipitation sequencing.
For the H3K4me3 ChIP performed on in vitro stimulated samples, 1–2 × 10⁵ NK cells were sorted from mouse spleens and stimulated as described above. For the STAT5 ChIP, 4–5 × 10⁶ NK cells were stimulated with or without IL-2 and IL-15 at concentrations described above. For the H3K4me3 ChIP performed on MCMV-infected NK cells, infected WT or NKp46-CreERT2 Rosa26-tdTomato mice were killed on day 0, 2, 4, 7 or 35 and 1–5 × 10⁵ NK cells were sorted from the spleens as described above. DNA and proteins were cross-linked for 8 min at room temperature using 1% formaldehyde. Cross-linked cells incubated in cell lysis buffer (25 mM HEPES (pH 7.0), 1.5 mM MgCl2, 10 mM KCl, 0.1% NP-40, 1 mM dithiothreitol and 1× proteinase inhibitor) and nuclei were isolated by centrifugation at 5,400 r.p.m. for 5.5 min. For the H3K4me3 ChIP, chromatin was sheared using a micrococcal nuclease (New England Biolabs) digestion followed by a 5-min sonication using the Bioruptor Twin sonicator (Diagenode). For the STAT5 ChIP, chromatin was sheared using a Covaris ultrasonicator. ChIP was performed using 1.5 μg of rabbit polyclonal anti-trimethyl-histone H3 (Lys4) antibody (H3K4me3, Millipore, 07-473) or 8 μg anti-STAT5 (R&D Systems, AF2168) and Dynabeads Protein G (Invitrogen). Immunoprecipitated DNA was quantified by PicoGreen and the size was evaluated by Agilent BioAnalyzer. Whenever possible, fragments between 100 and 600 bp were size-selected using AMPure XP beads (Beckman Coulter, A63882) and Illumina libraries were prepared using the KAPA HTP Library Preparation kit (Kapa Biosystems, KK8234) according to the manufacturer’s instructions with up to 10 ng input DNA and 8–11 cycles of PCR. Barcoded libraries were run on a HiSeq 2500 in Rapid or High Output mode or a HiSeq 4000 in a 50 bp/50 bp paired-end run, using the HiSeq Rapid SBS kit v.2, HiSeq SBS kit v.4 or HiSeq 3000/4000 SBS kit, respectively (Illumina). An average of 46 million paired reads were generated per sample.
RNA-sequencing.
RNA was isolated from sorted and stimulated cell populations using TRIzol (Invitrogen) or the PicoPure RNA Isolation Kit (Thermo Fisher Scientific). After RiboGreen quantification and quality control by Agilent BioAnalyzer, 0.705–2 ng total RNA with RNA integrity numbers ranging from 6.5 to 10 underwent amplification using the SMART-Seq v.4 Ultra Low Input RNA kit (Clontech, 63488), with 12 cycles of amplification. Subsequently, 10 ng of amplified complementary DNA was used to prepare libraries with the KAPA Hyper Prep kit (Kapa Biosystems, KK8504) using eight cycles of PCR. Samples were barcoded and run on a HiSeq 4000 or HiSeq 2500 in Rapid mode in a 50 bp/50 bp paired-end run, using the HiSeq 3000/4000 SBS kit or HiSeq Rapid SBS kit v.2, respectively (Illumina). An average of 37 million paired reads were generated per sample and the percent of messenger RNA bases per sample ranged from 42% to 70%.
ATAC-sequencing.
ATAC-seq was performed as described previously51. Briefly, sorted, stimulated cells were washed in cold PBS and lysed. The transposition reaction was incubated at 37 °C for 30 min. DNA was cleaned with the MinElute PCR Purification kit (QIAGEN catalog no. 28004) and material was amplified for five cycles. After evaluation by real-time PCR, 8–11 additional PCR cycles were performed. The final product was cleaned by AMPure XP beads (Beckman Coulter catalog no. A63882) at a 1× ratio and size selection was performed at a 0.5× ratio. Libraries were sequenced on a HiSeq 4000 in a 50 bp/50 bp paired-end run, using the HiSeq 3000/4000 SBS kit (Illumina). An average of 36 million paired reads were generated per sample.
RNA-seq, ChIP-seq and ATAC-seq data processing.
Paired reads were trimmed for adaptors and removal of low-quality reads using Trimmomatic (v.0.36)52. For RNA-seq generated in this study and generated previously30, transcript quantification was based on the mm10 University of California, Santa Cruz (UCSC) Known Gene models53 and performed using the quasi-mapping-based mode of Salmon (v.0.10.2)54 correcting for potential GC bias. Transcripts were summarized to gene level using tximport (v.1.8.0 or v.1.10.1)55. For ChIP-seq and ATAC-seq, trimmed reads were mapped to the Mus musculus genome (mm10 assembly) using Bowtie2 (v.2.2.9 or v.2.3.4)56 to generate BAM files used for peak calling and counting. Reads or read-pairs for ATAC-seq or ChIP-seq, respectively, were mapped to the atlas and counted with the summarizeOverlaps function from the GenomicAlignments package (v.1.10.1 or v.1.18.1)57.
Stat5 ChIP-seq peak calling and atlas generation.
ChIP-seq analysis was performed on one replicate generated in this study and two replicates generated in a previous study35 (accession GSE100674). Reads were trimmed and mapped as described above. Peak calling was performed on each IP-input paired sample using MACS2 (v.2.1.1.20160309)58, using arguments ‘-f BAM -p 0.05 -m 2 50’, for single-end peak calling. For each condition, irreproducible discovery rate (IDR) calculations using scripts provided by the ENCODE project (https://www.encodeproject.org/software/idr/; v.2.0.2 and v.2.0.3) were performed on all pairs of replicates using an oracle peak list derived from all samples within that condition, keeping reproducible peaks showing an IDR value of 0.05 or less in all pairs. A union of IDR-thresholded peaks generated from both unstimulated and stimulated conditions comprised the final annotated peak list of 1,201 peaks.
H3K4me3 ChIP-seq peak calling and atlas generation.
Peak calling was performed on each IP-input paired sample with MACS2, with arguments ‘– BAMPE –q 0.05’. Peaks that exhibited a q value score higher than the 25th percentile were retained. Samples that yielded >6,000 of these filtered peaks were merged to generate a union of all lists, with overlapping ranges combined into a single feature that fully encompassed each overlapping peak. For each analysis, a separate peak atlas was produced based on samples relevant to that analysis. For in vivo atlas, only in vivo samples were included to generate the atlas. For in vitro cytokine-stimulated samples, two sets of samples were included for atlas generation based on the comparisons that were performed: one comparing only IFN-α induced H3K4me3 histone modifications in WT and Stat1−/− NK cells and the other comparing IFN-α, IL-12/IL-18, IL-2/IL-15 or a combination of the three in only WT samples. In both cases, unstimulated samples were included only if a paired stimulated sample relevant to the analysis was also available. Thus three separate atlases were generated, one provided in Supplementary Table 3 for the STAT1KO NK cells and the other two incorporated into the merged atlas in Supplementary Table 6.
ATAC-seq peak calling and atlas generation.
Peak calling and atlas generation were described previously30. For in vitro datasets, the following modifications were applied: reproducible peaks showing an IDR value of 0.05 or less in at least one replicate pair were retained. A union of both inclusively merged overlapping peaks and unique reproducible peaks for each condition was used to generate the final atlas and was used for further analysis.
Peak annotation.
Peak assignment was performed using ChipPeakAnno (v.3.8.9)59 Promoter regions were defined as peaks that overlapped a region that was −2 kb to +0.5 kb from the TSS, whereas intronic and exonic peaks were defined as any peak that overlapped with annotated intronic and exonic regions, respectively.
All other peaks (intergenic) were assigned to the gene of the nearest TSS based on the distance from the start of the peak. Priority was given to transcripts that were canonical, based on the UCSC Known Canonical database.
Differential analyses RNA-seq, ChIP-seq and ATAC-seq.
Differential analyses were executed with DESeq2 (v.1.14.1 or v.1.22.2)60 using the UCSC Known Gene models as reference annotations, with genes as features for RNA-seq and peak regions from atlases (described above) as features for ChIP-seq and ATAC-seq. Features were considered differential if they showed an FDR-adjusted P value <0.05, adjusted for multiple hypothesis correction. For ChIP-seq and human RNA-seq, calculations for generalized linear models were fitted according to a design that controlled for differences between experimental replicates and donors, respectively.
Correlation analyses.
Spearman coefficients were calculated using log2 FC modeled by DESeq2 when comparing cytokine-stimulated samples versus unstimulated or PI samples versus naive. For RNA-seq, genes showing an average TPM > 5 (‘expressed’) across all dataset conditions were used as data points. For in vitro versus in vivo RNA-seq analysis, expressed genes common to both datasets were used to calculate test statistics. For in vitro versus in vivo ATAC-seq analysis, the peak ranges for in vitro samples (this paper) and previously defined peak ranges for in vivo samples30 were merged to produce a single combined atlas. Peaks present in either datasets were retained and merged into a single feature that fully encompassed the overlap. This combined atlas consisted of 50,502 peaks. Reads mapping to the new atlas were recounted and differential accessibility analyses were performed on in vivo and in vitro samples to calculate log2 FC. Overall, 30,852 detectable peaks (average read count >50) were used for correlation analysis. Similar analyses were performed for H3K4me3 ChIP-seq, which consisted of a combined atlas of 22,511 peaks. A total of 12,053 detectable peaks (average count of >150) were used for correlation analysis.
Motif analysis.
Peak ranges for the top 25% ranked on the basis of FDR-adjusted P value were retrieved for each IL-12/IL-18 or IL-2/IL-15 versus unstimulated comparison. These peaks were then compared to designate IL-12/IL-18 unique, IL-2/IL-15 unique or IL-12/IL-18-IL-2/IL-15 common groups. Similar designations were conducted for IL-12 versus IL-18 comparison. De novo analysis and known motif search was performed on each of these groups using the findMotifsGenome function from HOMER (v.4.10.4)61, with the parameters ‘-size given -len 6,8,10,12 -mset vertebrates -mask’ for de novo analysis. Motifs showing a motif score >0.7 and those that were not considered possible false-positives were retained.
Mapping orthologs between mouse and human.
Ortholog mappings were downloaded in bulk from the Hugo Gene Nomenclature Committee Orthology Predictions Search62,63. Only mouse–human ortholog pairs annotated by the National Center for Biotechnology Information were used for matching, which resulted in 16,503 unique mappings. From this list, 16,279 orthologs pairs were found in both the hg38 and mm10 UCSC Known Gene annotation models. Genes that had an average TPM > 5 (summarized across either all mouse or all human samples) were considered ‘expressed’ and retained for ortholog comparisons. Ultimately, 7,086 expressed ortholog pairs annotated within the UCSC Known Gene models were considered for downstream visualization.
Principal component analysis.
For all RNA-seq PCA, genes were first subset by removing any genes that were not ‘detectable’ (genes that showed 0 or 1 read counts cumulatively across all samples). Log2-transformed values were calculated from remaining raw count numbers using the rlog function from DESeq2 and used as input for PCA calculated by the prcomp function in R using default arguments. All human samples depicted in PCA were first corrected for donor effects using the removeBatchEffect function from limma (v.3.30.13), providing donor information as a factor. The function (in effect) fits a linear model to the data, including both batches and regular treatments, then removes the component due to the batch effects (in this case, donor variation).
Network visualization.
Generation of annotated ChIP-seq atlases for STAT1 and STAT4 were previously described33,34. Cytokine-induced genes, defined as any gene that was significantly changed when comparing cytokine-stimulated samples to unstimulated, were paired with their respective STAT (STAT1 with IFN-α, STAT4 with IL-12/IL-18 and STAT5 with IL-2/IL-15). STAT gene interactions were visualized only if a STAT bound within or near a gene (based on ChIP-seq data) and its paired cytokine-induced gene showed a log2 FC magnitude >1. Additional edges were added to indicate whether the gene was either bound by another STAT or both bound and significantly induced by another STAT-paired cytokine. Graphical output was produced by Cytoscape (v.3.7.1).
Heat maps and genomic tracks.
For peak-centered heat maps, BAM files were converted to bigWig files using either bedtools (v.2.26.0)64 and UCSC’s bedGraphToBigWig (v.4) or the bamCoverage function from deepTools (v.3.2.1)65. To improve visualization, binned counts greater than the 75th percentile + 1.5 × interquartile range or + 3 × interquartile range were capped at that value. All heat maps were plotted using ComplexHeatmap (v.1.18.1 or v.1.99.7)66, while genomic tracks were plotted using the Gviz R package (v.1.18.2)67. Reads for heat maps and tracks were normalized using size factors calculated by DESeq2, unless indicated otherwise.
Quantification and statistical analysis.
All statistical analyses were performed using R (v.3.3.3 or v.3.5.3) or Prism (GraphPad). Statistical significance was determined using an unpaired two-tailed Mann–Whitney–Wilcoxon test, unpaired two-tailed Welch’s t-test, unpaired and paired two-tailed Student’s t-test and one-tailed hypergeometric test, as indicated in figure legends. Data are shown as mean ± s.d. P < 0.05 was considered statistically significant.
Extended Data
Extended Data Fig. 1 |. Cytokines peak early during MCMV infection.
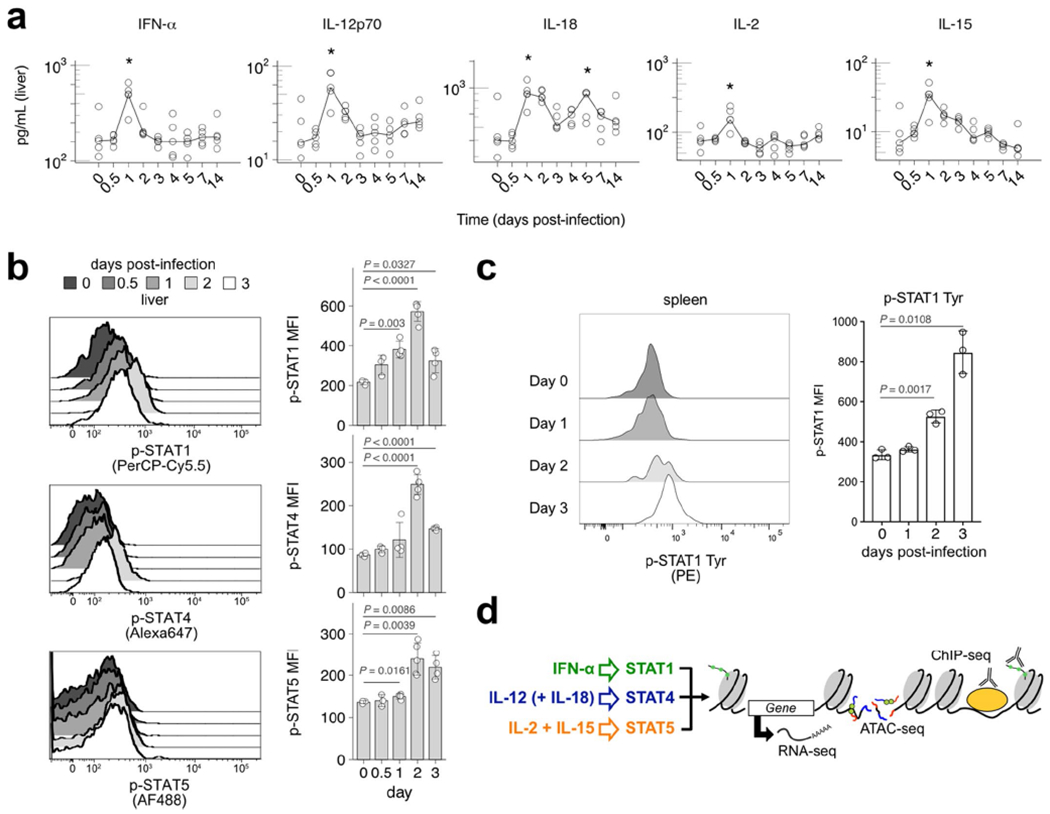
Livers and spleen were harvested at days 0, 0.5, 1, 2, 3, 4, 5, 7 and 14 after MCMV infection. Organs were lysed for protein extracts, and then measured for cytokine levels. Plots show cytokine levels of IFN-α, IL-12p70, IL-18, IL-2, and IL-15 over time. For (a), n = 5, and for (b-c), n = 3-5. a, Plots show cytokine levels in the liver of IFN-α, IL-12p70, IL-18, IL-2, and IL-15 over time, with log10 scale on y-axis. Lines connect at medians of each time point. * p = 0.016-0.032 from two-sided Mann-Whitney-Wilcoxon test comparing to day 0. b, Graphs show mean ± SD of phosphorylated STAT MFI values (p-STAT1 [Ser], p-STAT4, [Tyr] and p-STAT5 [Tyr]) proteins from liver CD3ε− TCRβ− NK1.1+ NK cells. P-values are calculated by two-sided Welch’s t-test. c, Graphs show mean ± SD of p-STAT1 (Tyr) MFI values from spleen CD3ε− TCRβ− NK1.1+ NK cells. P-values are calculated by two-sided Welch’s t-test. d, Schematic of global profiling strategy. MFI = mean fluorescence intensity.
Extended Data Fig. 2 |. IL-2/IL-15 synergizes with IL-12/18.
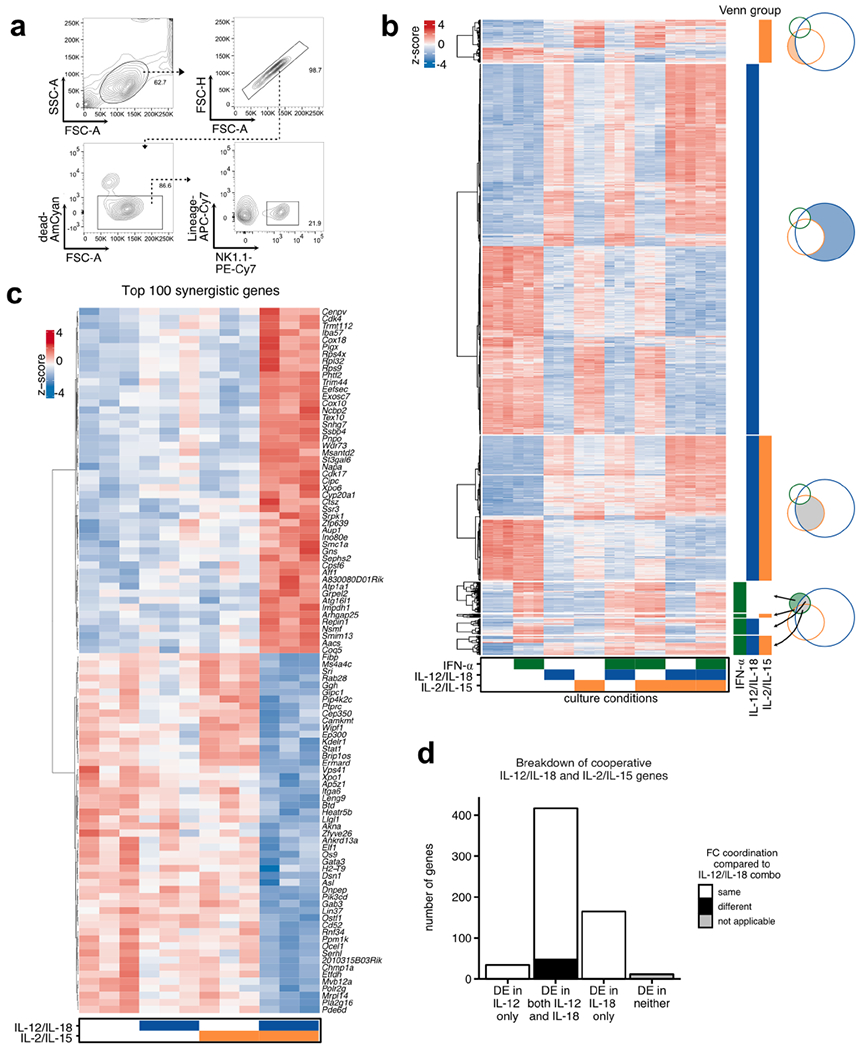
RNA-seq was performed on sorted NK cells (CD3ε− TCRβ− CD19− F4/80− NK1.1+) cultured for 3 h with indicated cytokine conditions. n = 3. a, Flow plots show gating strategy for sorted murine NK cells before stimulation. b, Heatmap shows row-scaled log-transformed expression values from RNA-seq data of the all DE genes that show an FDR-adjusted p-value < 0.05, |log2 FC| > 1, and TPM > 5, as grouped in Fig. 2c. c, Heatmap shows row-scaled log-transformed expression values from top 100 synergistic genes, defined as DE (FDR-adjusted p-value < 0.05; TPM > 5) in IL-12/IL-18 plus IL-2/IL-15 versus unstimulated conditions, but not DE (FDR-adjusted p-value > 0.05; TPM > 5) in either IL-12/IL-18 or IL-2/IL-15 compared to unstimulated conditions. Genes were ranked by p-value from IL-12/IL-18 plus IL-2/IL-15 versus unstimulated comparison. d, Bar plot depicts number of cooperative IL-12/18:IL-2/IL-15 genes that show the same or different directional log2FC (versus unstimulated conditions) among indicated DE (FDR-adjusted p-value < 0.05) genes compared to combined stimulation by IL-12/IL-18. Genes that are designated as “different” display at least one condition where the FC does not modulate in the same direction as combined IL-12/18 conditions. DE = differentially expressed; FDR = false discovery rate; FC = fold change.
Extended Data Fig. 3 |. IL-12/18 antagonizes IFN-α signaling.
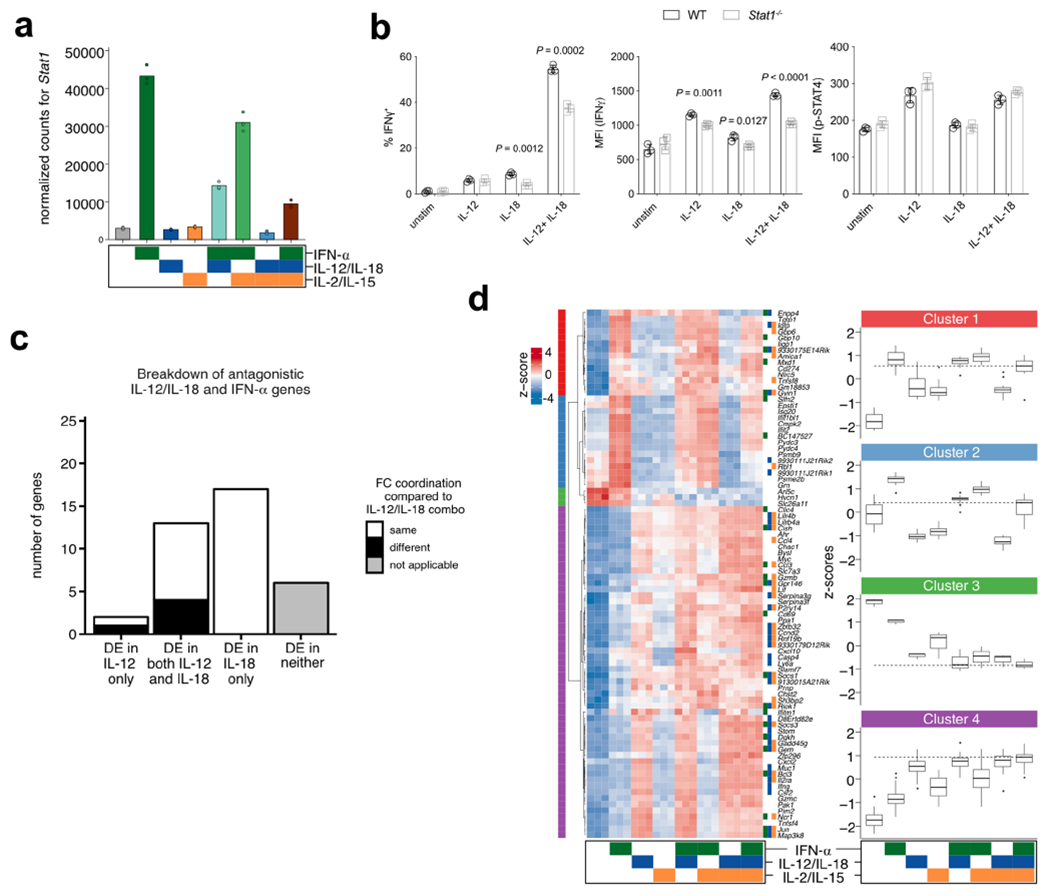
RNA-seq or flow cytometry was performed on sorted NK cells (CD3ε− TCRβ− CD19− F4/80− NK1.1+) cultured for 3 h with indicated cytokine conditions. n = 3. a, Bar plots show mean of normalized counts of Stat1 transcript across various cytokine conditions assayed by RNA-seq. b, Graphs depict percent of NK cells positive for intracellular IFN-γ staining (left), mean fluorescence intensity (MFI) of IFN-γ+ cells (middle), and MFI of p-STAT4 (Tyr; right). Bar indicates mean ± SD. P-values are calculated by unpaired two-sided Student’s t-test comparing WT to Stat1−/−. c, Bar plot depicts number of antagonistic IL-12/18:IFN-α genes, as shown in Extended Data Fig. 2d. d, Left panel shows heatmap of row-scaled log-transformed expression values of the 86 common differentially expressed genes between IFN-α, IL-12/IL-18 and IL-2/IL-15, hierarchically clustered into 4 groups. Box plots of z-scores from each cluster are depicted in the right panel. Centre, median; box limits, first and third percentiles; whiskers, 1.5 × interquartile range. Dotted lines show median z-score of IFN-α plus IL-12/IL-18 plus IL-2/15 condition. Tiles to the left of gene names indicate whether the genes are bound by STAT1 (green), STAT4 (blue), or STAT5 (orange) by ChIP-seq.
Extended Data Fig. 4 |. Epigenetic contribution of IL-12 versus IL-18.
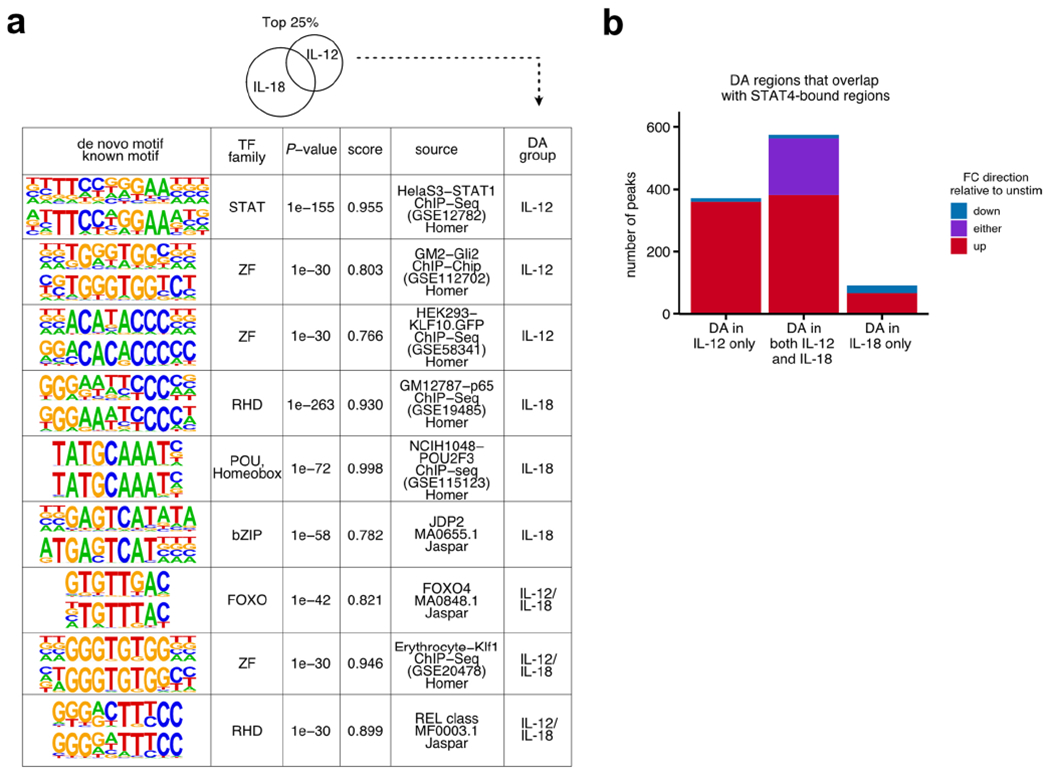
ATAC-seq was performed on sorted NK cells (CD3ε− TCRβ− CD19− F4/80− NK1.1+) cultured for 3 h with IL-12, IL-18, or IL-12 + L-18. n = 3. a, Tables show results for de novo motif analysis by HOMER software on top 25% DA regions (see Methods). From left to right, columns show discovered motif sequence (top) with the best matched known motif (bottom), best matched known transcription factor family, p-value, similarity score, source of data used to derive known motif, and DA group. For all groups, top 3 ranked on p-value are shown. b, Bar plot depicts number of DA regions (FDR-adjusted p-value < 0.05) that overlap with STAT4-bound ChIP-seq regions, broken down by DA group. Colors indicate FC direction of DA regions.FDR = false discovery rate; DA = differentially accessible.
Extended Data Fig. 5 |. Presence of all cytokine conditions best correlates with early in vivo MCMV infection.
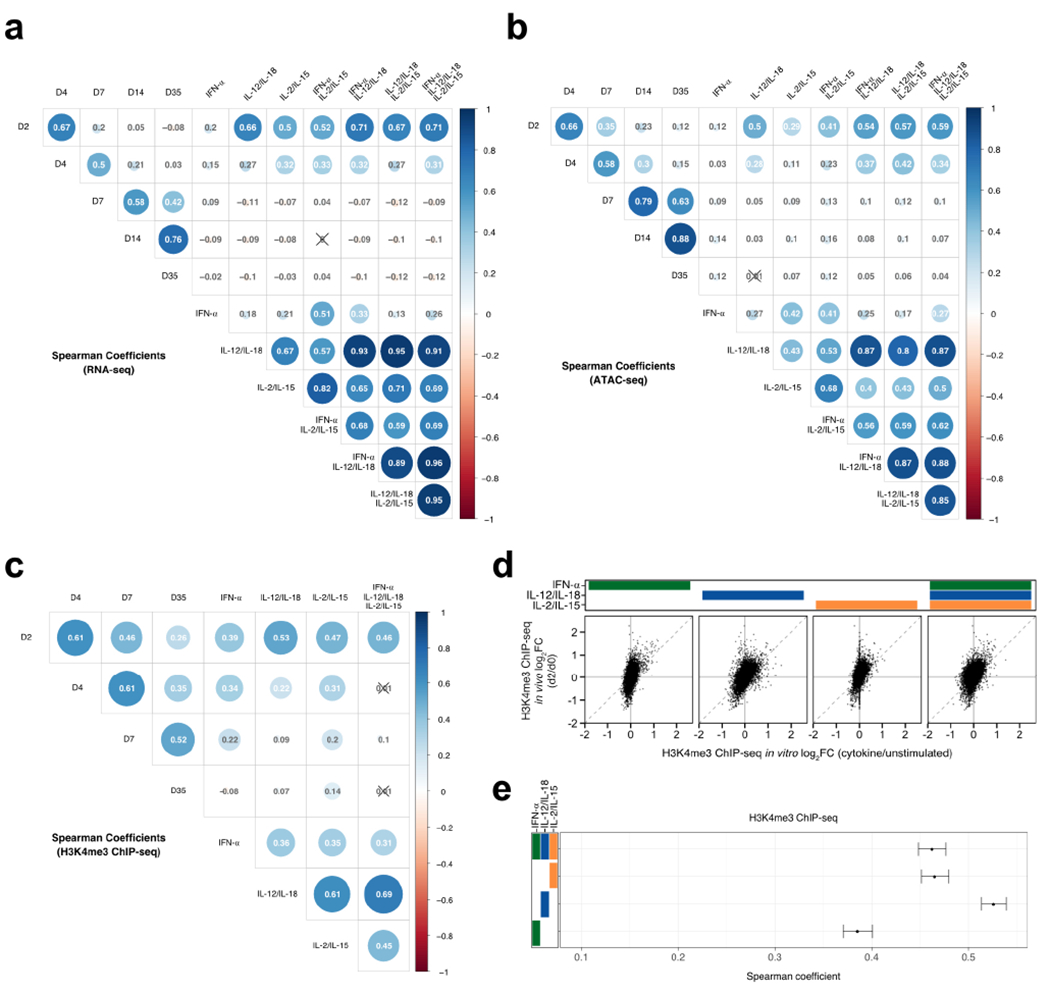
For in vitro studies, RNA-seq and ATAC-seq was performed as described in Figs. 2 and 3, respectively. H3K4me3 ChIP-seq was performed on sorted NK cells (CD3ε− TCRβ− CD19− F4/80− NK1.1+) cultured for 3h with IFN-α, IL-12/IL-18, IL-2/IL-15, or a combination of all three. For in vivo studies, RNA-seq and ATAC-seq was performed on sorted Ly49H+ NK cells (TCRβ−CD19−CD3ε−F4/80−NK1.1+Ly49H+) at indicated timepoints after MCMV infection. H3K4me3 ChIP-seq was performed on sorted Ly49H+ NK cells (TCRβ−CD19−CD3ε−F4/80−NK1.1+Ly49H+) at indicated time points after MCMV infection from either WT mice or NKp46-CreERT2 Rosa26-tdTomato reporter mice (gated additionally on TdTom+). Heatmaps show matrices of Spearman correlation coefficients using log2 FC comparing cytokine-stimulated versus unstimulated conditions or d2 versus d0 post-infection using (a) RNA-seq data, (b) ATAC-seq, or (c) H3K4me3 ChIP-seq data. Circle sizes are proportional to coefficients. X-ed out values indicate p > 0.05. For in vitro studies, n = 2-8, and for in vivo studies, n = 2-4. (d) Scatter plots of ChIP-seq log2 FC comparing cytokine-stimulated versus unstimulated (x-axis) conditions to d2 versus d0 post-infection (y-axis). (e) Center dots indicate Spearman correlations calculated from ChIP-seq values depicted in (c). Ranges show 95% confidence interval calculated by Fisher’s z-transformation.
Extended Data Fig. 6 |. Combination of various cytokine conditions supports optimal NK cell effector responses in vitro.
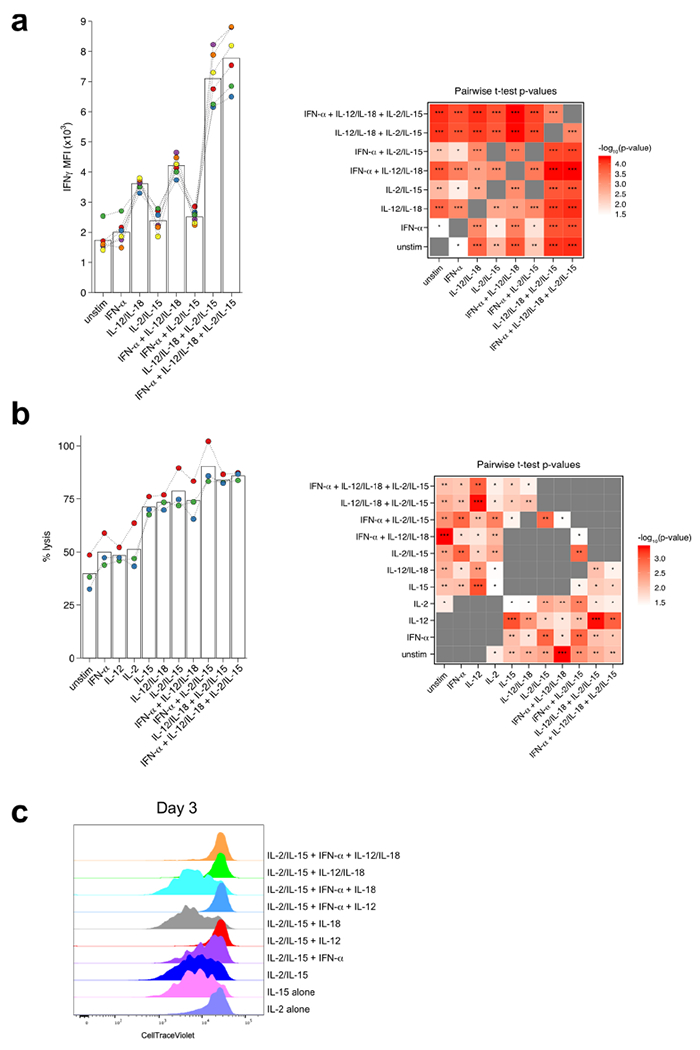
a, Bar plots show intracellular IFN-γ after 3 h of indicated cytokine stimulation on sorted NK cells (CD3ε− TCRβ− CD19− F4/80− NK1.1+). Calculated p-values for all pairwise conditions are represented as a heatmap. n = 6. b, Bar plots show calculated percent lysis of Calcein AM-labeled YAC-1 cells incubated with sorted NK cells (CD3ε− TCRβ− CD19− F4/80− NK1.1+) in the indicated cytokine conditions. Calculated p-values for all pairwise conditions are represented as a heatmap. n = 3. c, Representative histograms of Cell Trace Violet staining on sorted NK cells from 3-day in vitro cultures under indicated conditions. Representative of 3 independent experiments. Dotted lines connect biological replicates, which are colored. * p < 0.05, ** p < 0.01, *** p < 0.001 by two-tailed paired Student’s t-test.
Extended Data Fig. 7 |. Transcriptional profiles of cytokine signaling in human NK cells.
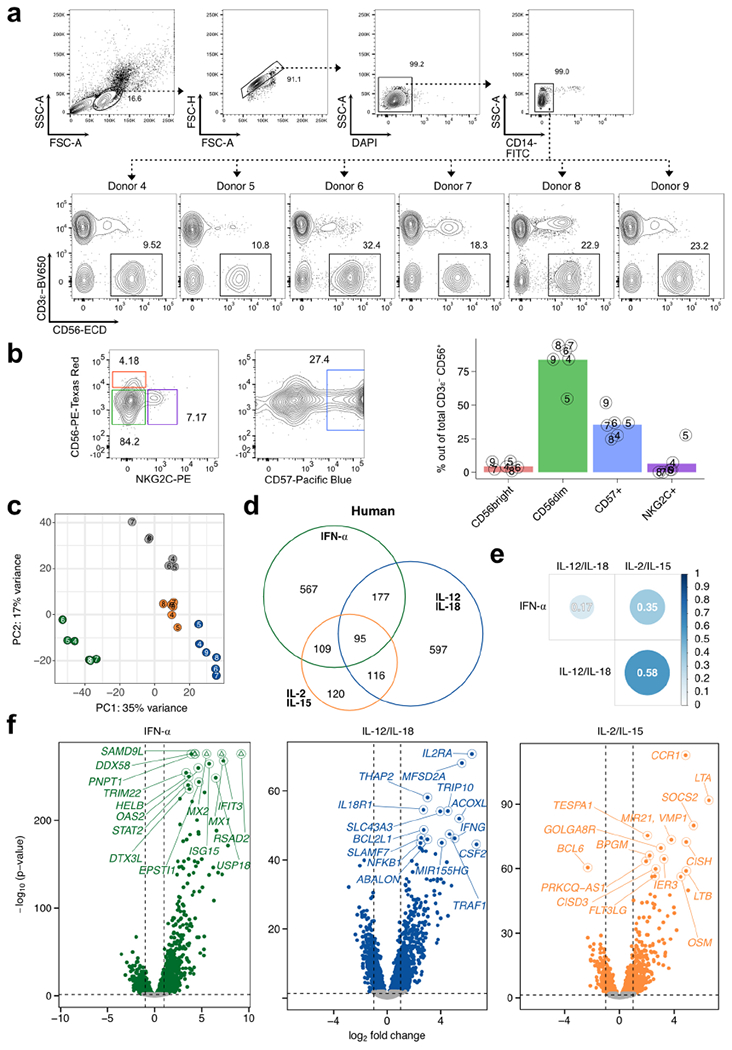
RNA-seq was performed on sorted NK cells (CD3ε− CD14− CD56+) derived from PBMCs of healthy donors and cultured for 3 h with IFN-α, IL-12/IL-18, or IL-2/IL-15. n = 6. a, Sorting strategy of human NK cells and NK cell percentages for each donor. b, Representative flow cytometric plot (left) and summarized proportions (right) of different NK cell subsets defined by cell surface phenotype. Bar plots show mean, and numbers indicate donor identifier. c, Principal component analysis of RNA-seq donor-corrected, log-transformed counts of all detectable genes in humans. d, Venn diagram of all commonly expressed, mappable DE (FDR-adjusted p-value < 0.05, |log2 FC|>1) human orthologs when comparing cytokine-stimulated versus unstimulated conditions. e, Heatmap matrix of Spearman correlation coefficients using log2 FC of each condition compared to unstimulated from all commonly expressed, mappable human DE genes. Circle sizes are proportional to coefficients. f, Volcano plots highlight top 15 DE genes (FDR-adjusted p-value < 0.05) ranked on p-value. x-axis depicts log2 FC and y-axis depicts −log10 (p-value) (Wald test). Shown are all expressed genes (TPM>5) comparing indicated cytokine stimulation versus unstimulated. Horizontal dashed line delineates p = 0.05, vertical dashed lines mark log2 FC of −1 and 1. Colored dots show DE genes. Triangles indicate capped p-values. DE = differentially expressed; FDR = false discovery rate; FC = fold change; TPM = transcripts-per-million.
Extended Data Fig. 8 |. Highly modulated genes induced by cytokines are conserved between mouse and human.
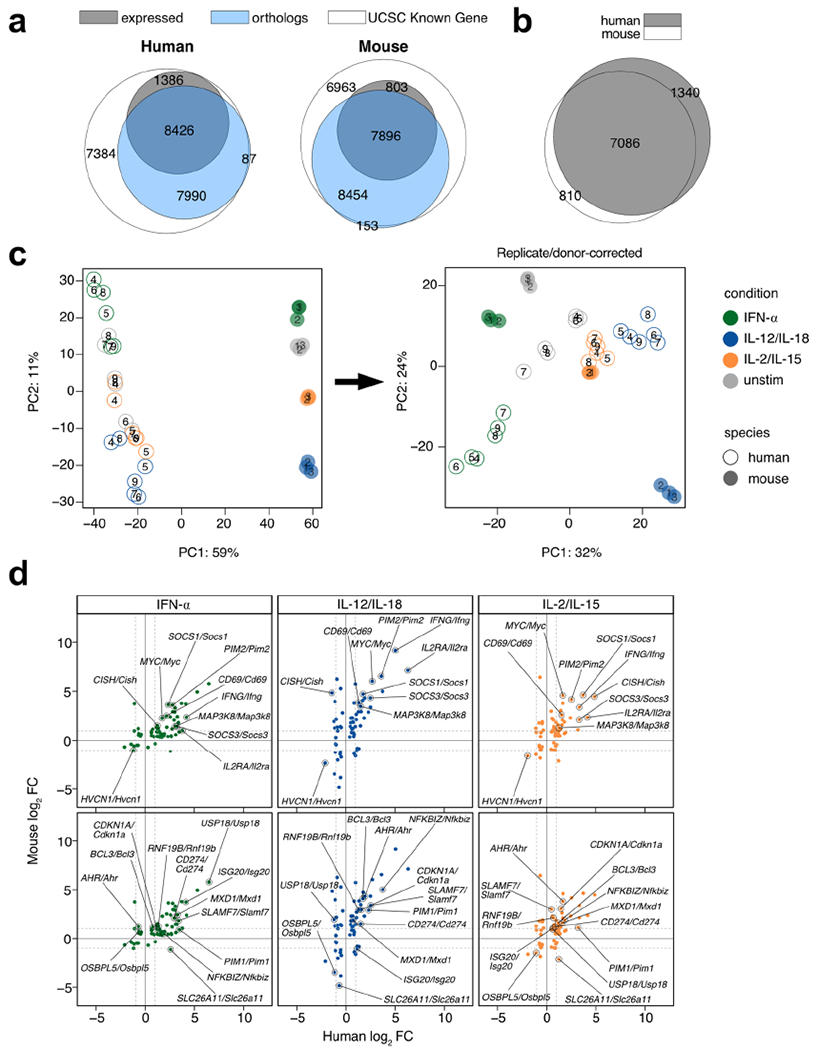
For human data, RNA-seq was performed on sorted NK cells (CD3ε− CD14− CD56+) derived from PBMCs of healthy donors and cultured for 3 h with IFN-α, IL-12/IL-18, or IL-2/IL-15. Mouse data was performed as described in Fig. 2. For mouse, n = 3, and for human, n = 6. a, Venn diagram of all genes in the UCSC Known Gene reference annotation (white), all mappable orthologs annotated by NCBI and retrieved through HGNC (blue), and counted genes that showed an average TPM >5 across all conditions. Numbers show absolute numbers. b, Venn diagram of mappable and expressed orthologs from mouse and human. Numbers show absolute numbers. Intersection depicts commonly expressed mappable orthologs used for downstream DE analysis. c, Principal component analysis of RNA-seq uncorrected log-transformed counts on (left) and those corrected for replicate/donor variation (right) on commonly expressed mappable orthologs. d, Scatter plots of RNA-seq log2 FC comparing cytokine-stimulated versus unstimulated from human datasets (x-axis) and mouse datasets (y-axis). Shown are genes commonly DE in all three cytokine conditions across human and mouse. Plots highlight genes that show |log2 FC|> 1 in all three conditions (top) or two of the three conditions (bottom). DE = differentially expressed; FC = fold change; TPM = transcripts-per-million.
Supplementary Material
Acknowledgements
We thank members of the Sun laboratory for comments, discussions, technical support and experimental assistance. We thank V. Pascual (Weill Cornell Medicine) for sharing reagents. We thank L. Lanier (University of California, San Francisco) for providing mice and critical feedback of our manuscript. We acknowledge the use of the Integrated Genomics Operation Core, funded by the National Cancer Institute Cancer Center Support Grant (P30CA08748); Cycle for Survival; and the Marie-Josee and Henry R. Kravis Center for Molecular Oncology. G.M.W. and S.G. were supported through research fellowships by the Deutsche Forschungsgemeinschaft (DFG Forschungsstipendium WI-4927/1-2 and GR 5503/1-1). N.M.A. was supported by a Medical Scientist Training Program grant from the National Institute of General Medical Sciences (T32GM007739 to the Weill Cornell–Rockefeller–Sloan Kettering Tri-Institutional MD–PhD Program) and by an F30 Predoctoral Fellowship from the National Institute of Allergy and Infectious Diseases (F30 AI136239). J.B.L. was supported by the Francois Wallace Monahan Fellowship. K.C.H. was supported by the National Institutes of Health (AI125651, HL129472 and AI069197) and the Leukemia Lymphoma Society Scholar Award. J.C.S. was supported by the Ludwig Center for Cancer Immunotherapy, the American Cancer Society, the Burroughs Wellcome Fund and the National Institutes of Health (AI100874, AI130043 and P30CA008748). C.M.L. was supported by the Cancer Research Institute as a Cancer Research Institute–Carson Family Fellow.
Footnotes
Online content
Any methods, additional references, Nature Research reporting summaries, source data, extended data, supplementary information, acknowledgements, peer review information; details of author contributions and competing interests; and statements of data and code availability are available at https://doi.org/10.1038/s41590-021-00909-1.
Reporting summary. Further information on research design is available in the Nature Research Reporting Summary linked to this article.
Competing interests
The authors declare no competing interests.
Extended data is available for this paper at https://doi.org/10.1038/s41590-021-00909-1.
Supplementary information The online version contains supplementary material available at https://doi.org/10.1038/s41590-021-00909-1.
Peer review informationNature Immunology thanks Lisa Forbes, Dagmar Gotthardt and Chiara Romagnani for their contribution to the peer review of this work. L. A. Dempsey was the primary editor on this article and managed its editorial process and peer review in collaboration with the rest of the editorial team.
Data availability
Data generated in this study have been deposited in the Gene Expression Omnibus (Super-Series accession numbers GSE140044 and GSE164116).
References
- 1.Jost S & Altfeld M Control of human viral infections by natural killer cells. Annu. Rev. Immunol 31, 163–194 (2013). [DOI] [PubMed] [Google Scholar]
- 2.Long EO, Kim HS, Liu D, Peterson ME & Rajagopalan S Controlling natural killer cell responses: integration of signals for activation and inhibition. Annu. Rev. Immunol 31, 227–258 (2013). [DOI] [PMC free article] [PubMed] [Google Scholar]
- 3.Lin JX & Leonard WJ Fine-tuning cytokine signals. Annu. Rev. Immunol 37, 295–324 (2019). [DOI] [PMC free article] [PubMed] [Google Scholar]
- 4.Meraz MA et al. Targeted disruption of the Stat1 gene in mice reveals unexpected physiologic specificity in the JAK–STAT signaling pathway. Cell 84, 431–442 (1996). [DOI] [PubMed] [Google Scholar]
- 5.Nguyen KB et al. Critical role for STAT4 activation by type 1 interferons in the interferon-γ response to viral infection. Science 297, 2063–2066 (2002). [DOI] [PubMed] [Google Scholar]
- 6.Pfeffer LM et al. STAT3 as an adapter to couple phosphatidylinositol 3-kinase to the IFNAR1 chain of the type I interferon receptor. Science 276, 1418–1420 (1997). [DOI] [PubMed] [Google Scholar]
- 7.Meinke A, Barahmand-Pour F, Wohrl S, Stoiber D & Decker T Activation of different Stat5 isoforms contributes to cell-type-restricted signaling in response to interferons. Mol. Cell. Biol 16, 6937–6944 (1996). [DOI] [PMC free article] [PubMed] [Google Scholar]
- 8.Gollob JA et al. Altered interleukin-12 responsiveness in Th1 and Th2 cells is associated with the differential activation of STAT5 and STAT1. Blood 91, 1341–1354 (1998). [PubMed] [Google Scholar]
- 9.Bukowski JF, Woda BA, Habu S, Okumura K & Welsh RM Natural killer cell depletion enhances virus synthesis and virus-induced hepatitis in vivo. J. Immunol 131, 1531–1538 (1983). [PubMed] [Google Scholar]
- 10.Biron CA, Byron KS & Sullivan JL Severe herpesvirus infections in an adolescent without natural killer cells. N. Engl. J. Med 320, 1731–1735 (1989). [DOI] [PubMed] [Google Scholar]
- 11.Orange JS & Biron CA Characterization of early IL-12, IFN-αβ, and TNF effects on antiviral state and NK cell responses during murine cytomegalovirus infection. J. Immunol 156, 4746–4756 (1996). [PubMed] [Google Scholar]
- 12.Schneider K et al. Lymphotoxin-mediated crosstalk between B cells and splenic stroma promotes the initial type I interferon response to cytomegalovirus. Cell Host Microbe 3, 67–76 (2008). [DOI] [PMC free article] [PubMed] [Google Scholar]
- 13.Pien GC, Satoskar AR, Takeda K, Akira S & Biron CA Cutting edge: selective IL-18 requirements for induction of compartmental IFN-γ responses during viral infection. J. Immunol 165, 4787–4791 (2000). [DOI] [PubMed] [Google Scholar]
- 14.Orange JS, Wang B, Terhorst C & Biron CA Requirement for natural killer cell–produced interferon-γ in defense against murine cytomegalovirus infection and enhancement of this defense pathway by interleukin 12 administration. J. Exp. Med 182, 1045–1056 (1995). [DOI] [PMC free article] [PubMed] [Google Scholar]
- 15.Chaix J et al. Cutting edge: priming of NK cells by IL-18. J. Immunol 181, 1627–1631 (2008). [DOI] [PMC free article] [PubMed] [Google Scholar]
- 16.Madera S & Sun JC Cutting edge: stage-specific requirement of IL-18 for antiviral NK cell expansion. J. Immunol 194, 1408–1412 (2015). [DOI] [PMC free article] [PubMed] [Google Scholar]
- 17.Biron CA, Young HA & Kasaian MT Interleukin 2-induced proliferation of murine natural killer cells in vivo. J. Exp. Med 171, 173–188 (1990). [DOI] [PMC free article] [PubMed] [Google Scholar]
- 18.Nguyen KB et al. Coordinated and distinct roles for IFN-αβ, IL-12, and IL-15 regulation of NK cell responses to viral infection. J. Immunol 169, 4279–4287 (2002). [DOI] [PubMed] [Google Scholar]
- 19.Wiedemann GM et al. Divergent role for STAT5 in the adaptive responses of natural killer cells. Cell Rep. 33, 108498 (2020). [DOI] [PMC free article] [PubMed] [Google Scholar]
- 20.Sun JC, Beilke JN & Lanier LL Adaptive immune features of natural killer cells. Nature 457, 557–561 (2009). [DOI] [PMC free article] [PubMed] [Google Scholar]
- 21.Daniels KA et al. Murine cytomegalovirus is regulated by a discrete subset of natural killer cells reactive with monoclonal antibody to Ly49H. J. Exp. Med 194, 29–44 (2001). [DOI] [PMC free article] [PubMed] [Google Scholar]
- 22.Arase H, Mocarski ES, Campbell AE, Hill AB & Lanier LL Direct recognition of cytomegalovirus by activating and inhibitory NK cell receptors. Science 296, 1323–1326 (2002). [DOI] [PubMed] [Google Scholar]
- 23.Smith HR et al. Recognition of a virus-encoded ligand by a natural killer cell activation receptor. Proc. Natl Acad. Sci. USA 99, 8826–8831 (2002). [DOI] [PMC free article] [PubMed] [Google Scholar]
- 24.Cooper MA et al. Cytokine-induced memory-like natural killer cells. Proc. Natl Acad. Sci. USA 106, 1915–1919 (2009). [DOI] [PMC free article] [PubMed] [Google Scholar]
- 25.Sun JC et al. Proinflammatory cytokine signaling required for the generation of natural killer cell memory. J. Exp. Med 209, 947–954 (2012). [DOI] [PMC free article] [PubMed] [Google Scholar]
- 26.Madera S et al. Type I IFN promotes NK cell expansion during viral infection by protecting NK cells against fratricide. J. Exp. Med 213, 225–233 (2016). [DOI] [PMC free article] [PubMed] [Google Scholar]
- 27.Ali AK, Oh JS, Vivier E, Busslinger M & Lee SH NK cell-specific Gata3 ablation identifies the maturation program required for bone marrow exit and control of proliferation. J. Immunol 196, 1753–1767 (2016). [DOI] [PubMed] [Google Scholar]
- 28.Nguyen KB et al. Interferon-αβ-mediated inhibition and promotion of interferon-γ: STAT1 resolves a paradox. Nat. Immunol 1, 70–76 (2000). [DOI] [PubMed] [Google Scholar]
- 29.Miyagi T et al. High basal STAT4 balanced by STAT1 induction to control type 1 interferon effects in natural killer cells. J. Exp. Med 204, 2383–2396 (2007). [DOI] [PMC free article] [PubMed] [Google Scholar]
- 30.Lau CM et al. Epigenetic control of innate and adaptive immune memory. Nat. Immunol 19, 963–972 (2018). [DOI] [PMC free article] [PubMed] [Google Scholar]
- 31.Putz EM et al. CDK8-mediated STAT1-S727 phosphorylation restrains NK cell cytotoxicity and tumor surveillance. Cell Rep. 4, 437–444 (2013). [DOI] [PMC free article] [PubMed] [Google Scholar]
- 32.Zhao XD et al. Whole-genome mapping of histone H3 Lys4 and 27 trimethylations reveals distinct genomic compartments in human embryonic stem cells. Cell Stem Cell 1, 286–298 (2007). [DOI] [PubMed] [Google Scholar]
- 33.Geary CD et al. Non-redundant ISGF3 components promote NK cell survival in an auto-regulatory manner during viral infection. Cell Rep. 24, 1949–1957 (2018). [DOI] [PMC free article] [PubMed] [Google Scholar]
- 34.Rapp M et al. Core-binding factor β and Runx transcription factors promote adaptive natural killer cell responses. Sci. Immunol 2, eaan3796 (2017). [DOI] [PMC free article] [PubMed] [Google Scholar]
- 35.Villarino AV et al. Subset- and tissue-defined STAT5 thresholds control homeostasis and function of innate lymphoid cells. J. Exp. Med 214, 2999–3014 (2017). [DOI] [PMC free article] [PubMed] [Google Scholar]
- 36.Barbulescu K et al. IL-12 and IL-18 differentially regulate the transcriptional activity of the human IFN-γ promoter in primary CD4+ T lymphocytes. J. Immunol 160, 3642–3647 (1998). [PubMed] [Google Scholar]
- 37.Pipkin ME et al. Interleukin-2 and inflammation induce distinct transcriptional programs that promote the differentiation of effector cytolytic T cells. Immunity 32, 79–90 (2010). [DOI] [PMC free article] [PubMed] [Google Scholar]
- 38.Min-Oo G & Lanier LL Cytomegalovirus generates long-lived antigen-specific NK cells with diminished bystander activation to heterologous infection. J. Exp. Med 211, 2669–2680 (2014). [DOI] [PMC free article] [PubMed] [Google Scholar]
- 39.Nabekura T & Lanier LL Tracking the fate of antigen-specific versus cytokine-activated natural killer cells after cytomegalovirus infection. J. Exp. Med 213, 2745–2758 (2016). [DOI] [PMC free article] [PubMed] [Google Scholar]
- 40.Mehrotra PT, Wu D, Crim JA, Mostowski HS & Siegel JP Effects of IL-12 on the generation of cytotoxic activity in human CD8+ T lymphocytes. J. Immunol 151, 2444–2452 (1993). [PubMed] [Google Scholar]
- 41.Hennessy RJ et al. Quantifying NK cell growth and survival changes in response to cytokines and regulatory checkpoint blockade helps identify optimal culture and expansion conditions. J. Leukoc. Biol 105, 1341–1354 (2019). [DOI] [PubMed] [Google Scholar]
- 42.Romee R et al. Cytokine-induced memory-like natural killer cells exhibit enhanced responses against myeloid leukemia. Sci. Transl. Med 8, 357ra123 (2016). [DOI] [PMC free article] [PubMed] [Google Scholar]
- 43.Lee SH et al. Suppressor of cytokine signaling 2 regulates IL-15-primed human NK cell function via control of phosphorylated Pyk2. J. Immunol 185, 917–928 (2010). [DOI] [PubMed] [Google Scholar]
- 44.Cousens LP, Orange JS, Su HC & Biron CA Interferon-αβ inhibition of interleukin 12 and interferon-γ production in vitro and endogenously during viral infection. Proc. Natl Acad. Sci. USA 94, 634–639 (1997). [DOI] [PMC free article] [PubMed] [Google Scholar]
- 45.Ni J, Miller M, Stojanovic A, Garbi N & Cerwenka A Sustained effector function of IL-12/15/18-preactivated NK cells against established tumors. J. Exp. Med 209, 2351–2365 (2012). [DOI] [PMC free article] [PubMed] [Google Scholar]
- 46.Romee R et al. Cytokine activation induces human memory-like NK cells. Blood 120, 4751–4760 (2012). [DOI] [PMC free article] [PubMed] [Google Scholar]
- 47.Bezman NA et al. Molecular definition of the identity and activation of natural killer cells. Nat. Immunol 13, 1000–1009 (2012). [DOI] [PMC free article] [PubMed] [Google Scholar]
- 48.Schlums H et al. Cytomegalovirus infection drives adaptive epigenetic diversification of NK cells with altered signaling and effector function. Immunity 42, 443–456 (2015). [DOI] [PMC free article] [PubMed] [Google Scholar]
- 49.Sadelain M Chimeric antigen receptors: driving immunology towards synthetic biology. Curr. Opin. Immunol 41, 68–76 (2016). [DOI] [PMC free article] [PubMed] [Google Scholar]
- 50.Madisen L et al. A robust and high-throughput Cre reporting and characterization system for the whole mouse brain. Nat. Neurosci 13, 133–140 (2010). [DOI] [PMC free article] [PubMed] [Google Scholar]
- 51.Buenrostro JD, Giresi PG, Zaba LC, Chang HY & Greenleaf WJ Transposition of native chromatin for fast and sensitive epigenomic profiling of open chromatin, DNA-binding proteins and nucleosome position. Nat. Methods 10, 1213–1218 (2013). [DOI] [PMC free article] [PubMed] [Google Scholar]
- 52.Bolger AM, Lohse M & Usadel B Trimmomatic: a flexible trimmer for Illumina sequence data. Bioinformatics 30, 2114–2120 (2014). [DOI] [PMC free article] [PubMed] [Google Scholar]
- 53.Speir ML et al. The UCSC Genome Browser database: 2016 update. Nucleic Acids Res. 44, D717–D725 (2016). [DOI] [PMC free article] [PubMed] [Google Scholar]
- 54.Patro R, Duggal G, Love MI, Irizarry RA & Kingsford C Salmon provides fast and bias-aware quantification of transcript expression. Nat. Methods 14, 417–419 (2017). [DOI] [PMC free article] [PubMed] [Google Scholar]
- 55.Soneson C, Love MI & Robinson MD Differential analyses for RNA-seq: transcript-level estimates improve gene-level inferences. F1000Res 4, 1521 (2015). [DOI] [PMC free article] [PubMed] [Google Scholar]
- 56.Langmead B & Salzberg SL Fast gapped-read alignment with Bowtie 2. Nat. Methods 9, 357–359 (2012). [DOI] [PMC free article] [PubMed] [Google Scholar]
- 57.Lawrence M et al. Software for computing and annotating genomic ranges. PLoS Comput. Biol 9, e1003118 (2013). [DOI] [PMC free article] [PubMed] [Google Scholar]
- 58.Zhang Y et al. Model-based analysis of ChIP-Seq (MACS). Genome Biol. 9, R137 (2008). [DOI] [PMC free article] [PubMed] [Google Scholar]
- 59.Zhu LJ et al. ChIPpeakAnno: a Bioconductor package to annotate ChIP-seq and ChIP-chip data. BMC Bioinf. 11, 237 (2010). [DOI] [PMC free article] [PubMed] [Google Scholar]
- 60.Love MI, Huber W & Anders S Moderated estimation of fold change and dispersion for RNA-seq data with DESeq2. Genome Biol. 15, 550 (2014). [DOI] [PMC free article] [PubMed] [Google Scholar]
- 61.Heinz S et al. Simple combinations of lineage-determining transcription factors prime cis-regulatory elements required for macrophage and B cell identities. Mol. Cell 38, 576–589 (2010). [DOI] [PMC free article] [PubMed] [Google Scholar]
- 62.Wright MW, Eyre TA, Lush MJ, Povey S & Bruford EA HCOP: the HGNC comparison of orthology predictions search tool. Mamm. Genome 16, 827–828 (2005). [DOI] [PubMed] [Google Scholar]
- 63.Seal RL, Gordon SM, Lush MJ, Wright MW & Bruford EA genenames.org: the HGNC resources in 2011. Nucleic Acids Res. 39, D514–D519 (2011). [DOI] [PMC free article] [PubMed] [Google Scholar]
- 64.Quinlan AR & Hall IM BEDTools: a flexible suite of utilities for comparing genomic features. Bioinformatics 26, 841–842 (2010). [DOI] [PMC free article] [PubMed] [Google Scholar]
- 65.Ramirez F et al. deepTools2: a next generation web server for deep-sequencing data analysis. Nucleic Acids Res. 44, W160–W165 (2016). [DOI] [PMC free article] [PubMed] [Google Scholar]
- 66.Gu Z, Eils R & Schlesner M Complex heatmaps reveal patterns and correlations in multidimensional genomic data. Bioinformatics 32, 2847–2849 (2016). [DOI] [PubMed] [Google Scholar]
- 67.Hahne F & Ivanek R Visualizing genomic data using Gviz and bioconductor. Methods Mol. Biol 1418, 335–351 (2016). [DOI] [PubMed] [Google Scholar]
Associated Data
This section collects any data citations, data availability statements, or supplementary materials included in this article.
Supplementary Materials
Data Availability Statement
Data generated in this study have been deposited in the Gene Expression Omnibus (Super-Series accession numbers GSE140044 and GSE164116).


