Abstract
Cells organize biochemical processes into biological condensates. P-bodies are cytoplasmic condensates enriched in enzymes important for mRNA degradation and have been identified as sites of both storage and decay. How these opposing outcomes can be achieved in condensates remains unresolved. mRNA decapping immediately precedes degradation and the Dcp1/Dcp2 decapping complex is enriched in P-bodies. Here, we show Dcp1/Dcp2 activity is modulated in condensates and depends on the interactions promoting phase separation. We find Dcp1/Dcp2 phase separation stabilizes an inactive conformation in Dcp2 to inhibit decapping. The activator Edc3 causes a conformational change in Dcp2 and rewires the protein-protein interactions to stimulate decapping in condensates. Disruption of the inactive conformation dysregulates decapping in condensates. Our results indicate regulation of enzymatic activity in condensates relies on a coupling across length scales ranging from microns to Ångstroms. We propose this regulatory mechanism may control the functional state of P-bodies and related phase-separated compartments.
INTRODUCTION
Organizing cellular processes into biomolecular condensates is a mechanism to regulate biochemistry in distinct ways: altering molecular conformation and organization to promote specificity, increasing local concentration to accelerate enzymatic activity, and coupling interactions to enforce reaction directionality1–10. The emergent properties afforded by formation of extensive interaction networks in condensates can also enhance enzymatic activity beyond local concentration effects11,12. Such enhancements could arise from the coupling of enzyme allostery to interactions spanning the diameter of condensates. How the collective properties across length scales are coupled to enzyme catalysis is poorly understood.
Cellular mRNA is highly regulated through the assembly of messenger ribonucleoprotein (mRNP) complexes and many mRNPs accumulate in biomolecular condensates under normal and stressed conditions13,14. P-bodies are a conserved class of biomolecular condensates enriched in proteins involved in 5’–3’ mRNA decay15–17. Although the molecular composition and interactions within P-bodies is well studied, their biological function is controversial. Several studies suggest P-bodies are sites of decay because colocalized mRNA are cleared over time16,18–20. Alternatively, P-bodies may function as sites of mRNA storage due to the absence of decay intermediates in sequencing and live cell imaging data15,21,22. Moreover, mRNAs exhibit context-dependent degradation in P-bodies and can be restored to the translating pool upon recovery from cell stress23–26. Given their heterotypic and dynamic nature, isolating and studying P-bodies is challenging and presents a hurdle in understanding their function.
Like other biomolecular condensates, P-body assembly relies on a network of redundant multivalent interactions between resident proteins mediated by intrinsically disordered regions (IDRs)27. Many 5’–3’ decay proteins contain structured domains flanked by IDRs important for interaction with RNA and protein cofactors28. This includes the conserved decapping complex—comprised of the catalytic subunit Dcp2 and its obligate activator Dcp1—responsible for removing the 7-methylguanosine (m7G) cap from mRNA, committing the transcript to degradation29–31. Excision of disordered regions in the eukaryotic decapping complex inhibit its localization to P-bodies and leads to transcript dysregulation and conditional lethality32–34.
The localization and regulation imparted by IDRs in the decapping complex are mediated through conserved short-linear interaction motifs28,32,33. Recently, positive and negative regulatory motifs were identified in the C-terminal IDR of yeast Dcp2 that affect decapping in vitro and in vivo35,36. This established a model where Dcp2 is autoinhibited and coactivators alleviate autoinhibition to increase mRNA binding and catalysis36,37. However, the molecular mechanisms for regulation of autoinhibition are not well understood.
Edc3 is an activator of decapping responsible for regulating specific mRNAs and deadenylation-independent 5’–3’ decay in budding yeast34,38. Edc3 interacts with positive regulatory motifs in the C-terminus of Dcp2 to alleviate autoinhibition35,36,39,40. Edc3 localizes to P-bodies and forms multivalent interactions with RNA and the Dcp-2 C-terminus to promote liquid-liquid phase separation33,41,42. Initial studies suggested Edc3-mediated phase separation of Dcp1/Dcp2 inhibited decapping42. These studies indirectly measured Dcp1/Dcp2 activity in condensates as monitoring decapping in condensates is challenging. It remains unclear how phase separation regulates decapping.
In this study, we address the relationship between molecular organization and function in minimal decapping condensates containing Dcp1/Dcp2 and Edc3. Using a dual-labeled fluorescent RNA to simultaneously monitor the 5’-cap and RNA body, we measure rates of decapping in condensates. We find Dcp1/Dcp2 is inactive in condensates and addition of Edc3 reorganizes the underlying network of interactions to activate Dcp1/Dcp2 90-fold. Activation in condensates is greater than in solution because of increased repression of Dcp1/Dcp2 activity in the absence of Edc3, not because enzyme turnover is accelerated. We show Edc3 promotes a Dcp1/Dcp2 conformational change to enhance decapping and suggest the condensate environment biases an equilibrium in Dcp1/Dcp2 that represses enzyme activity. Our findings suggest condensate composition tunes enzyme conformational dynamics to affect activity, which may be an emergent property of biomolecular condensates used for controlling RNA degradation and other biochemical reactions in cells.
RESULTS
Phase separation of Dcp1/Dcp2 is potentiated by Edc3
We recently reconstituted the decapping complex from S. pombe that includes a C-terminal boundary at residue 504 in Dcp2 optimized for expression and necessary for regulation of activity (Dcp2ext, Fig. 1a and Supplementary Table 1)36. Dcp2ext contains structured, N-terminal regulatory (NRD) and catalytic (CD) domains and regulatory motifs in a C-terminal IDR. In the absence of activators, Dcp1/Dcp2ext is autoinhibited by inhibitory motifs (IMs) and Edc3 interacts with flanking helical leucine rich motifs (HLMs) to promote decapping (Fig. 1a,b). Dcp1/Dcp2ext undergoes phase separation at higher concentrations (Fig. 1c). Because prior studies examined Dcp1/Dcp2 condensates using a construct lacking IMs, we characterized how these elements contribute to phase separation of Dcp1/Dcp2ext in parallel with those formed in complex with Edc333,42.
Fig. 1 |. Edc3 enhances Dcp1/Dcp2ext phase separation.
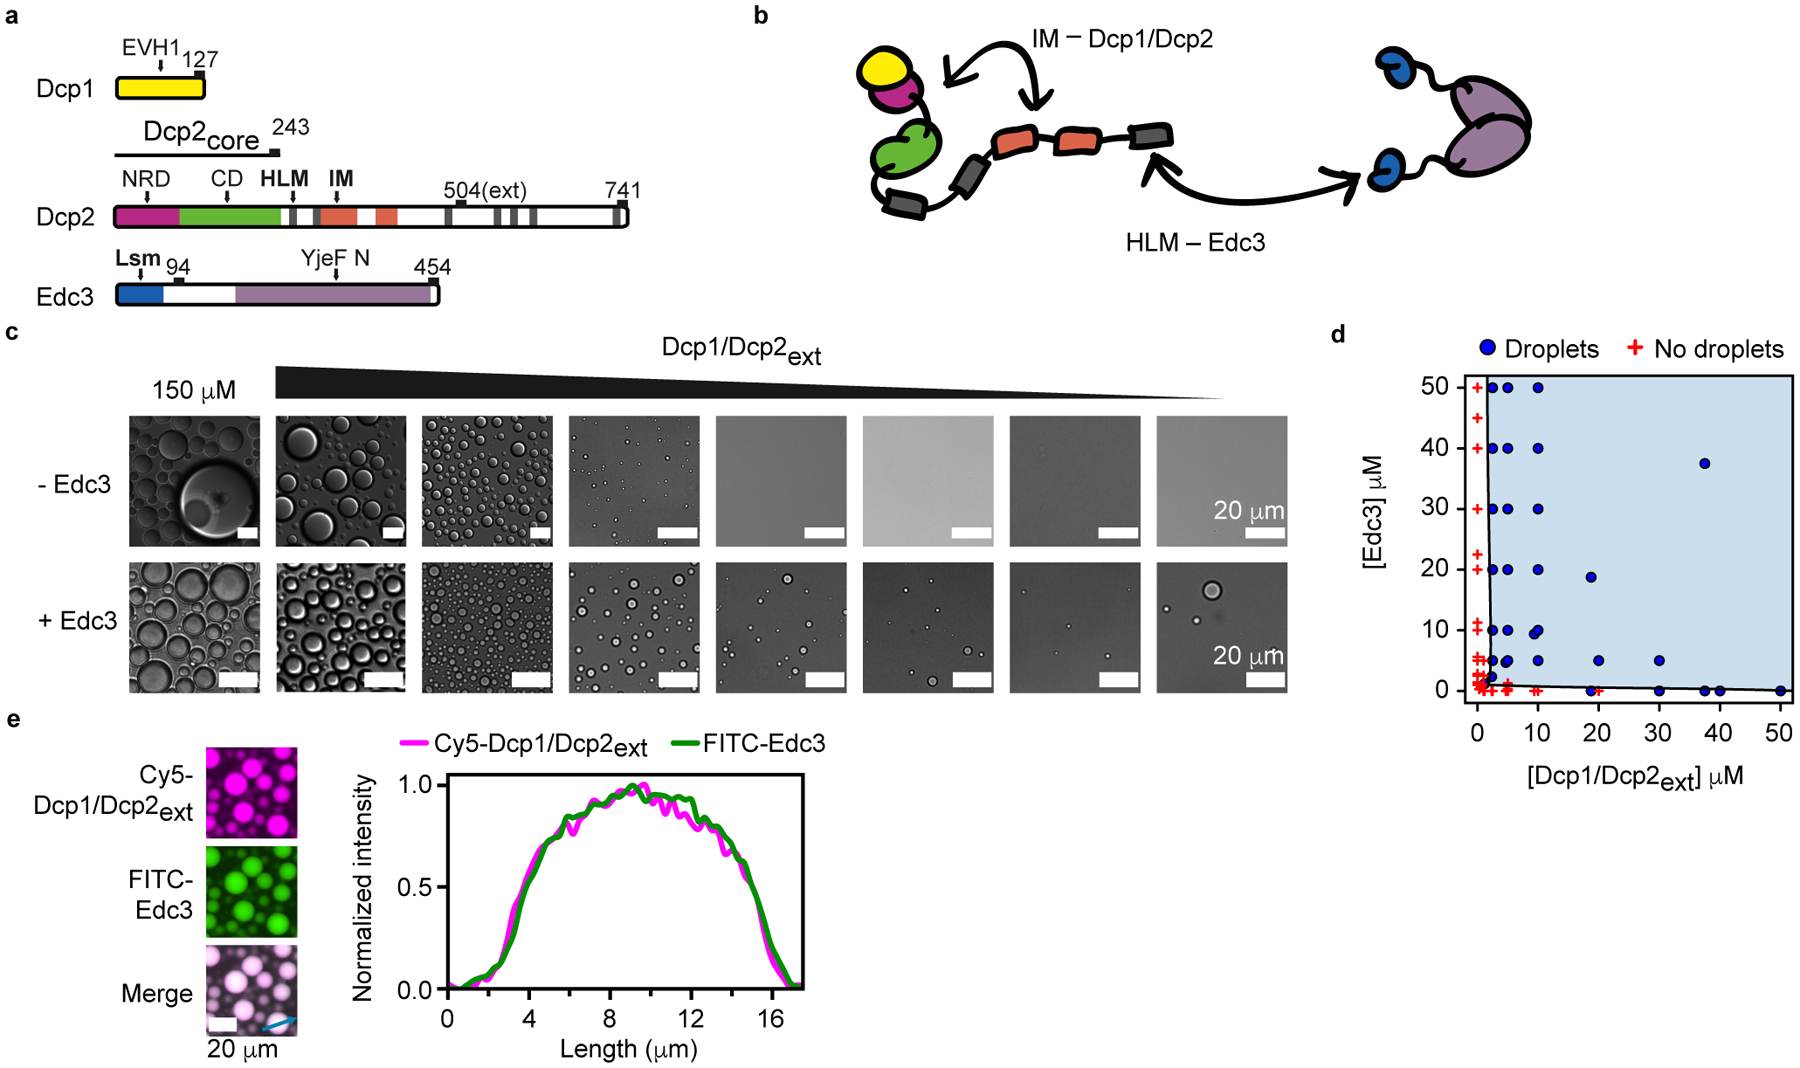
a, Schematic for Dcp1, Dcp2, and Edc3. Domains and motifs are labeled and white space is indicative of disordered regions. Dcp2 contains structured core domains, Dcp2core, and the construct used in this study, Dcp2ext, contains regulatory elements in the C-terminal IDR. b, Cartoon of Dcp1/Dcp2ext and Edc3 highlighting interactions between IMs and core domains of Dcp1/Dcp2ext and between HLMs and Edc3. Cartoons are colored as shown in a. c, Dcp1/Dcp2ext undergoes liquid-liquid phase separation and addition of stoichiometric Edc3 reduces the critical concentration for phase separation twenty-fold. Each sequential micrograph is a two-fold dilution of the preceding. d, Phase diagram of Dcp1/Dcp2ext and Edc3 in vitro. e, Dcp1/Dcp2ext and Edc3 are equally enriched and homogenously distributed in droplets. Protein concentration is 50 μM. Representative micrographs are shown from three independent experiments with similar results.
Droplets containing Dcp1/Dcp2ext underwent fusion and varied in size from <50 μm2 to >500 μm2, indicative of a liquid-like biomolecular condensate (Supplementary Fig. 1a,b). The low-complexity regions of the Dcp2 C-terminus (residues 274–504) are sufficient to promote phase separation, however the structured NRD and CD may antagonize this behavior in the absence of Dcp1 (Supplementary Fig. 1c,d). Dcp1/Dcp2ext droplets are able to recruit RNA (Supplementary Fig. 1e). Our data demonstrate Dcp1/Dcp2ext can form large, microscopic condensates mediated by the C-terminus.
Because Edc3 forms multivalent interactions with HLMs in the Dcp2 C-terminus, we tested how Edc3 influenced the critical concentration for phase separation. Edc3 reduced the critical concentration of Dcp1/Dcp2ext phase separation 20-fold (Fig. 1c,d). Dcp1/Dcp2ext and Edc3 colocalized to droplets, were homogenously distributed, undergo fusion and recruit RNA (Fig. 1e and Supplementary Fig. 1a,e). Droplets containing Edc3 did not exceed 100 μm2, in contrast to the numerous >100 μm2 droplets observed for Dcp1/Dcp2ext (Fig. 1c and Supplementary Fig. 1b). Edc3 altered Dcp1/Dcp2ext exchange in condensates in a concentration-dependent manner (Supplementary Fig. 2a,b and Supplementary Table 2). These data indicate the properties of Dcp1/Dcp2ext condensates change upon addition of Edc3, raising the possibility that protein interactions promoting droplet formation differ.
Edc3 alters interactions driving Dcp1/Dcp2 condensation
Short-linear interaction motifs typically mediate phase separation and we hypothesized IMs and HLMs in the C-terminus of Dcp2 may differentially contribute to Dcp1/Dcp2ext condensation in the absence or presence of Edc3 (Fig. 2a). To test this, we developed a series of truncations in Dcp2 and Edc3 and looked for the presence of droplets using microscopy (Fig. 2b).
Fig. 2 |. Interactions underlying Dcp1/Dcp2ext and Dcp1/Dcp2ext/Edc3 phase separation differ.
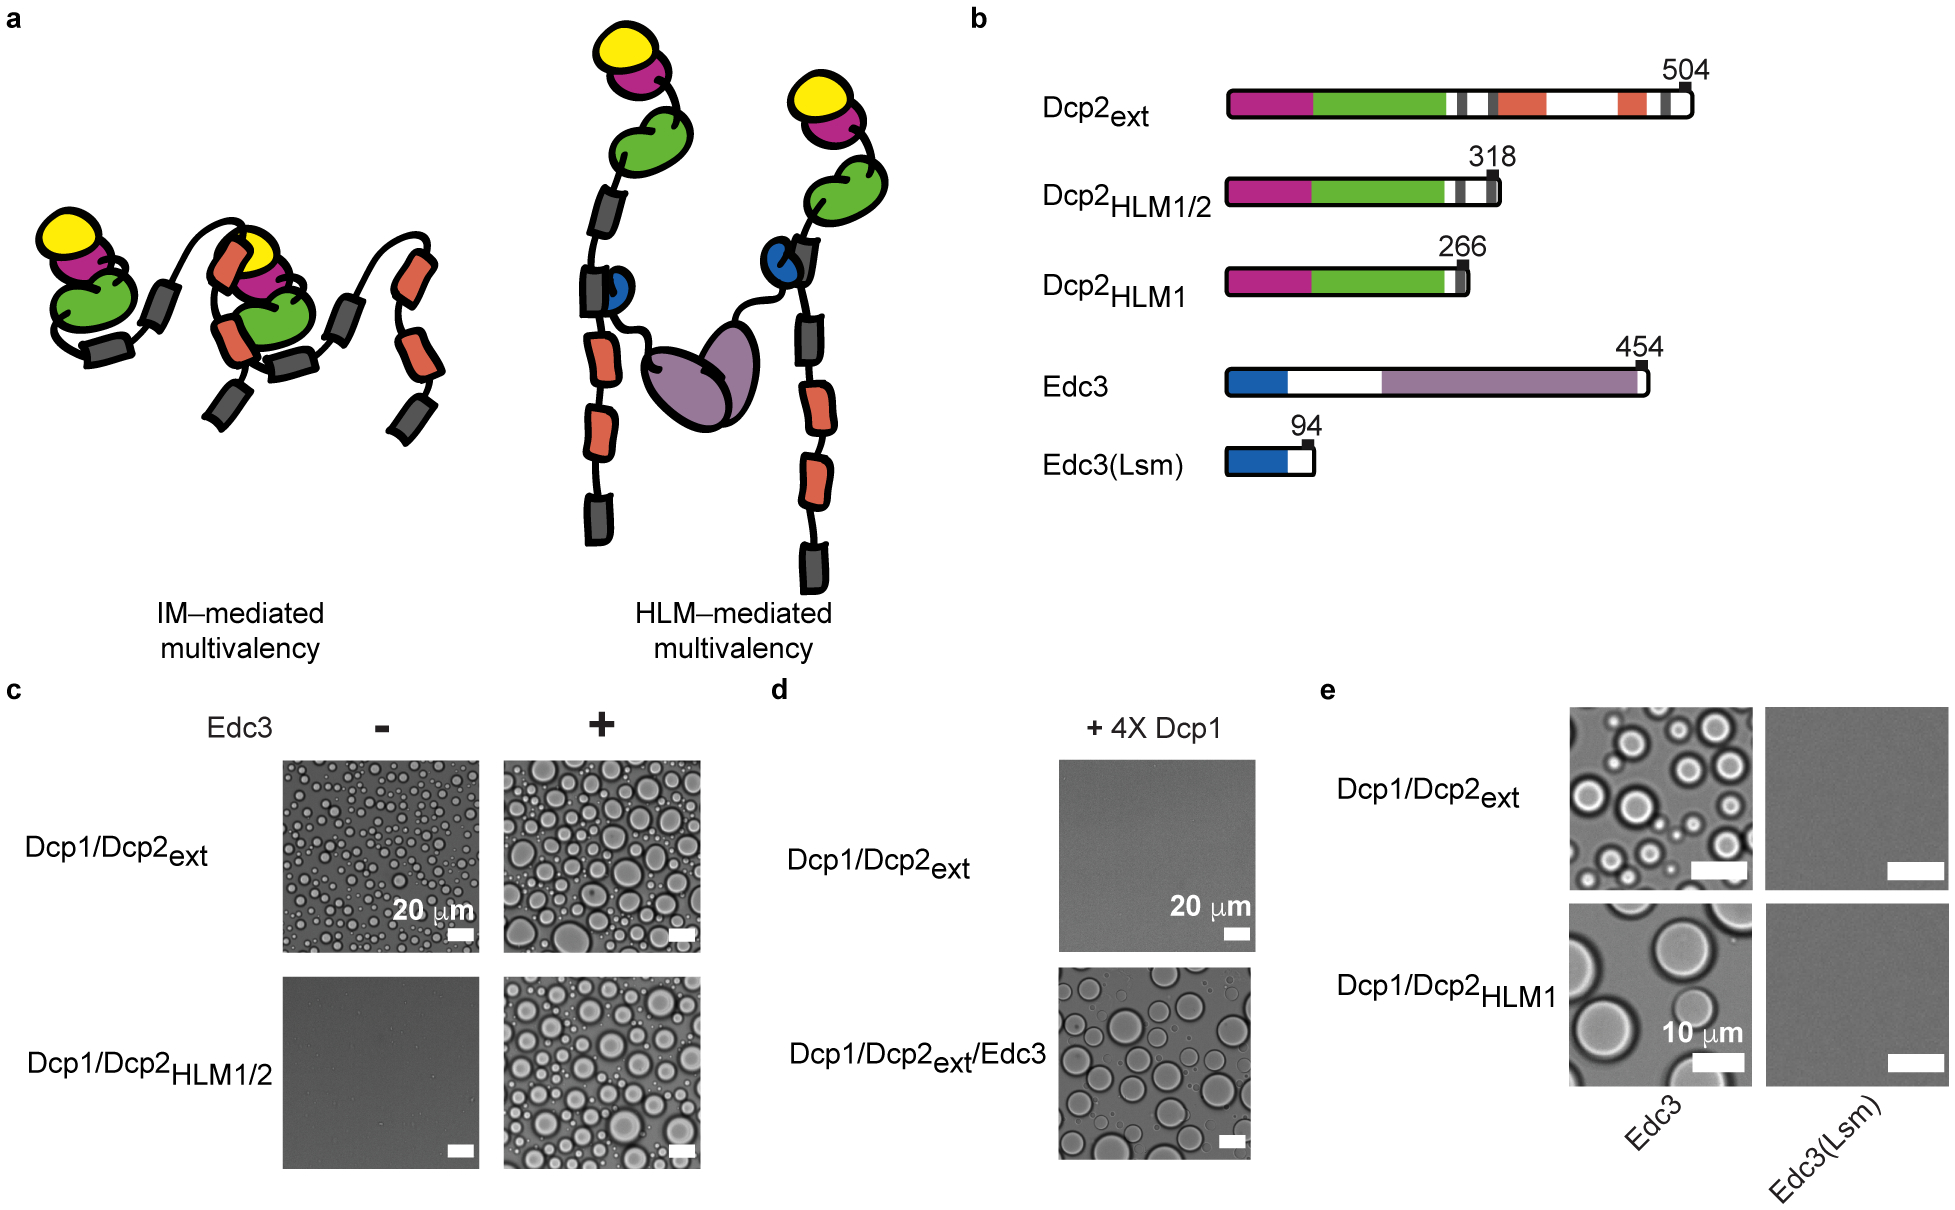
a, Interaction between IMs of one Dcp2 molecule and a neighboring Dcp1/Dcp2extin trans mediates Dcp1/Dcp2ext phase separation whereas Edc3 interacts with HLMs to bridge across Dcp2 molecules. b, Dcp2 and Edc3 truncations used to determine interactions important for phase separation. c, Removal of inhibitory motifs in the C-terminus of Dcp2 ablates phase separation of the decapping complex but Dcp1/Dcp2HLM1/2 can still undergo phase separation when Edc3 is added. Concentration of Dcp1/Dcp2HLM1/2 is 300 μM, Dcp1/Dcp2ext is 100 μM, Dcp1/Dcp2HLM1/2/Edc3 and Dcp1/Dcp2ext/Edc3 are at 50 μM. d, Addition of four-fold molar excess Dcp1 disrupts Dcp1/Dcp2ext phase separation but not Dcp1/Dcp2ext/Edc3 droplet formation. Concentration of Dcp1 is 200 μM, Dcp1/Dcp2ext and Dcp1/Dcp2ext/Edc3 is 50 μM. e, Dimerization of Edc3 is necessary to promote phase separation of Dcp1/Dcp2 containing a single or multiple HLMs. Dcp1/Dcp2HLM1 and Edc3 were stoichiometrically mixed at 150 μM. Dcp1/Dcp2ext and Edc3 were mixed at 50 μM. Representative micrographs are shown from three independent experiments with similar results.
If Dcp1/Dcp2ext phase separation is driven by interactions between IMs and the structured regions of Dcp1/Dcp2ext in trans, then their removal should abrogate phase separation. However, if Edc3 results in a molecular reorganization of droplets to favor interactions between Edc3 and HLMs, then phase separation of Dcp1/Dcp2/Edc3 should be independent of IMs (Fig. 2a). In support, a construct lacking IMs, Dcp2HLM1/2, abolished phase separation of Dcp1/Dcp2 but not Dcp1/Dcp2/Edc3 (Fig. 2c).
Dcp1 can interact with an IM and a region of the Dcp2 C-terminus and may function as an interface for the multivalency required for Dcp1/Dcp2ext phase separation (Fig. 2a)36,43. This predicts excess Dcp1 would outcompete intermolecular Dcp1—Dcp2 interactions to prevent phase separation of Dcp1/Dcp2ext, but not affect Edc3-driven phase separation because Edc3—HLM interactions are independent of Dcp1. Indeed, four-fold molar excess Dcp1 prevented Dcp1/Dcp2ext phase separation while addition of Edc3 resulted in droplet formation (Fig. 2d). Moreover, Edc3-dependent phase separation required Edc3 dimerization (Fig. 2e). Thus, Dcp2 IMs and Dcp1 are crucial for Dcp1/Dcp2ext phase separation while Dcp2 HLMs and Edc3 promote Dcp1/Dcp2ext/Edc3 droplet formation. This suggests molecular composition changes the network of interactions critical for condensate formation.
Edc3 activates decapping in droplets
Since the molecular organization of Dcp1/Dcp2ext and Dcp1/Dcp2ext/Edc3 droplets involves interactions important for autoinhibition and activation, we asked whether condensates exhibit different decapping activity. To directly quantify Dcp1/Dcp2ext decapping in droplets, we synthesized a 38mer-RNA substrate containing a 5’-m7GDP conjugated to fluorescein and 3’ adenosine conjugated to Cy5, allowing for simultaneous monitoring of the 5’-cap and RNA body by microscopy (Fig. 3a and Extended Data Fig. 1a–d). We mixed this substrate with a concentration of Dcp1/Dcp2ext above its critical concentration and did not observe appreciable loss in fluorescence intensity after 20 minutes, suggesting RNA is decapped at less than 0.006 min−1 (Fig. 3b,c). However, droplet formation with excess Edc3 resulted in a decrease in m7GDP from droplets at a rate of 0.56 min−1 (Fig. 3d,e). Thus, Edc3 enhanced Dcp1/Dcp2ext in droplets 90-fold and m7GDP loss from droplets is dependent on enzyme catalysis (Extended Data Fig. 1e,f). Addition of substoichiometric Edc3 to pre-formed Dcp1/Dcp2ext droplets caused a dose-dependent loss of m7GDP signal from droplets at rates up to 22-fold greater than Dcp1/Dcp2ext droplets (Fig. 3f,g). Localization of the RNA body did not change, suggesting it is retained within condensates (Fig. 3c,e). Changes in RNA abundance from limiting amounts to excess relative to Dcp1/Dcp2ext had a two-fold effect on initial decapping rates in Dcp1/Dcp2ext/Edc3 droplets (Extended Data Fig. 1g). We conclude decapping can occur within droplets but critically depends on Edc3.
Fig. 3 |. The ability of phase-separated Dcp1/Dcp2ext to decap RNA is modulated by Edc3.
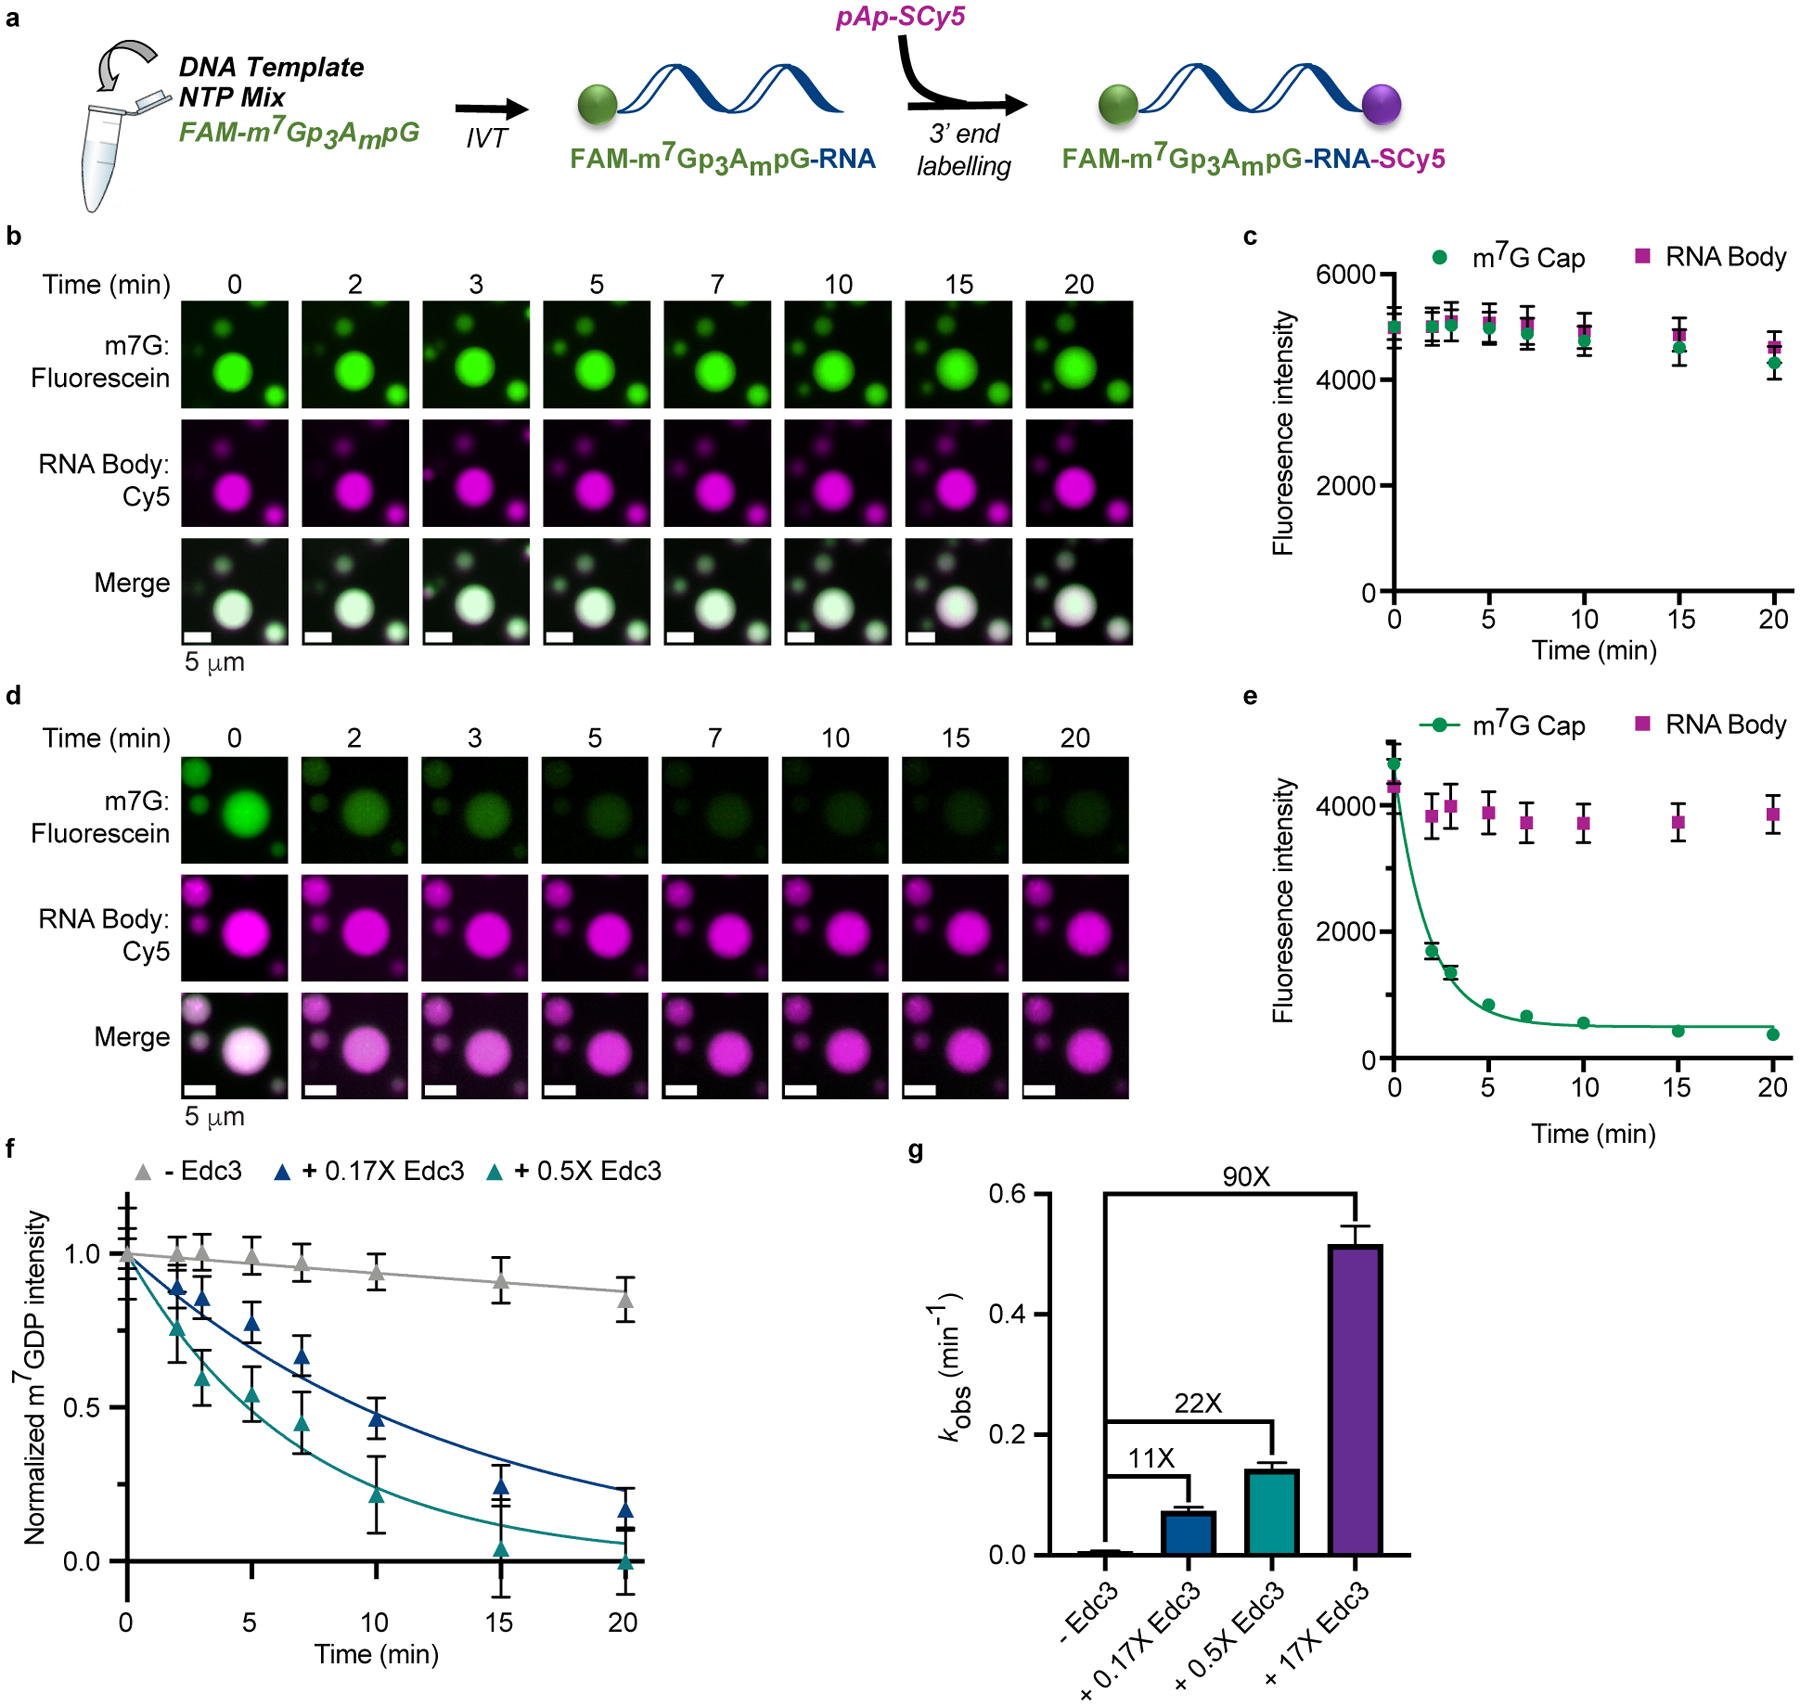
a, Synthesis scheme for two-color fluorescent 38mer RNA capped with fluorescein m7G cap (FAM-m7GDP) and labeled at the 3’ end with Cy5-adenosine. b, c, Addition of dual-labeled RNA to Dcp1/Dcp2ext (60 μM total protein concentration) droplets shows minimal signal loss in both FAM-m7GDP and Cy5-RNA over twenty minutes. d, e, Time-dependent loss of FAM-m7GDP and Cy5-RNA signal from droplets formed by 5 μM Dcp1/Dcp2ext and 80 μM Edc3. f, Addition of substoichiometric Edc3 to preformed Dcp1/Dcp2ext droplets (60 μM total Dcp1/Dcp2ext concentration) results in dose-dependent loss of FAM-m7GDP signal from droplets. m7GDP intensity is normalized to initial fluorescence signal. g, Edc3 activates Dcp1/Dcp2ext up to 90-fold in condensates. Representative micrographs and data are from twenty droplets examined over two independent experiments with similar results. Data are presented as mean ± s.e.m.
Edc3 activates decapping 90-fold in droplets, suggesting Dcp1/Dcp2ext/Edc3 condensates increase decapping activity relative to the surrounding solution. Alternatively, Dcp1/Dcp2ext condensates may repress activity. To distinguish these possibilities, we measured the maximal rate of decapping of dual-labeled substrate using Dcp1/Dcp2core, which is not autoinhibited and does not undergo phase separation36. The rate observed in Dcp1/Dcp2ext/Edc3 droplets does not greatly differ from that observed for Dcp1/Dcp2core in solution (Supplementary Fig. 3a,b). However, the rate of decapping determined in Dcp1/Dcp2ext droplets is 30-fold slower than Dcp1/Dcp2core. Thus, we conclude the droplet environment leads to repression of Dcp1/Dcp2ext in the absence of Edc3 and does not favor enhanced decapping activity by Edc3. Furthermore, our results suggest a high concentration of Dcp1/Dcp2ext in droplets is not sufficient for active decapping but requires interaction with Edc3.
Edc3 couples activation of decapping to phase separation
To differentiate between Dcp1/Dcp2ext activity inside and outside condensates, we performed two single-turnover decapping experiments using capped, radiolabeled RNA (Fig. 4a). First, we measured decapping in a mixture containing Dcp1/Dcp2ext inside (dense phase) and outside (dilute phase) droplets after addition of capped RNA (bulk decapping). Second, we separated the dilute and dense phases by centrifugation, added capped substrate to the dilute phase, and monitored product formation (dilute phase decapping). Differences in decapping activity between the two samples can be attributed to contributions from Dcp1/Dcp2ext sequestered in droplets.
Fig. 4 |. Edc3 couples activation of decapping to phase separation.
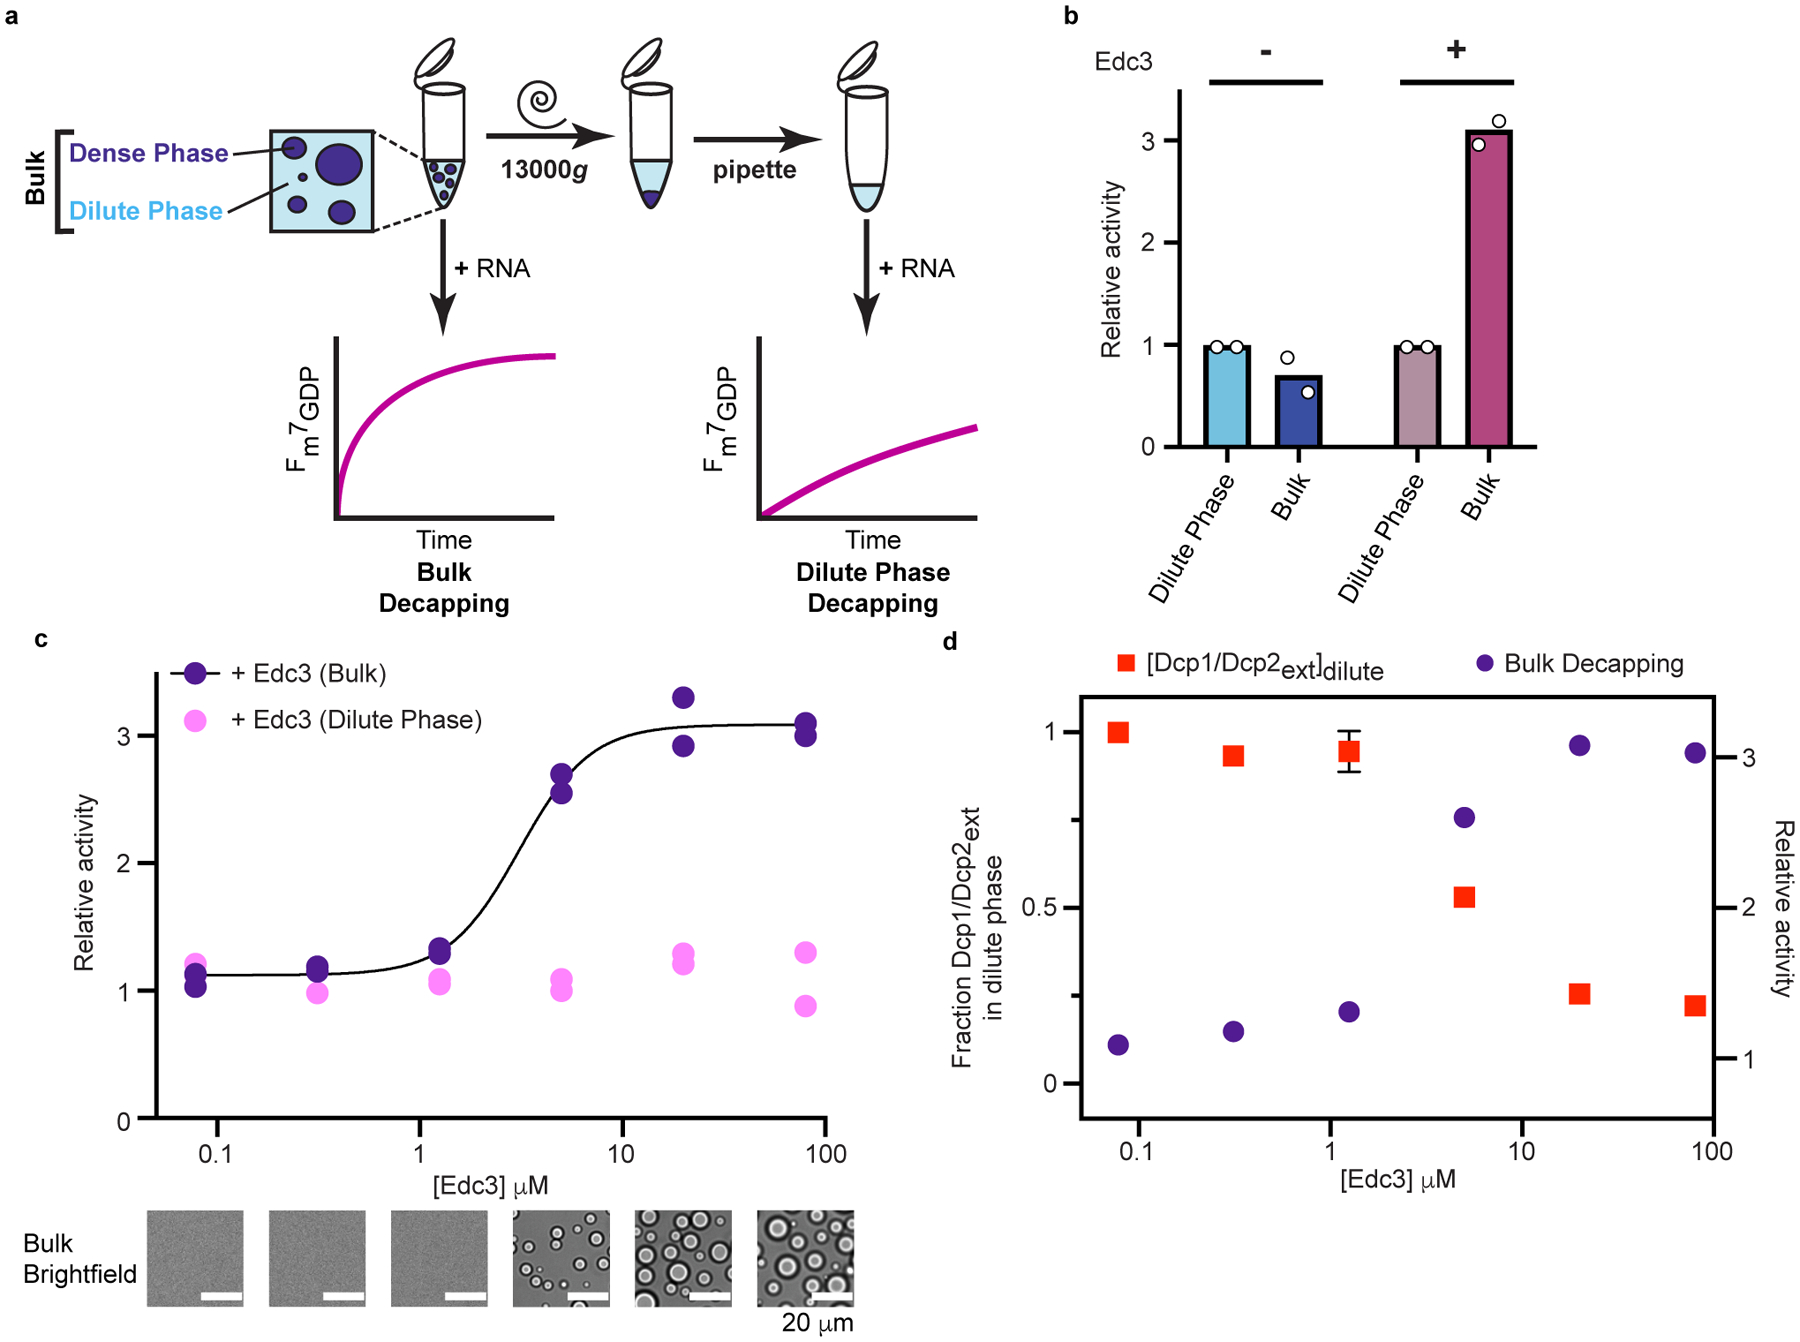
a, Schematic of in vitro decapping assay to determine contribution of decapping activity from Dcp1/Dcp2ext in droplets (Dense Phase) and outside droplets (Dilute Phase). b, Dcp1/Dcp2ext localized in droplets does not strongly contribute to overall activity (blue bars) but removal of Dcp1/Dcp2ext/Edc3 droplets strongly diminishes activity (pink bars). Concentration of Dcp1/Dcp2ext is 100 μM and 5 μM in absence pr presence of 80 μM Edc3, respectively. Relative activity refers to ratio of observed rate to dilute phase. c, Activation of decapping by Edc3 is concomitant with formation of microscopically visible droplets. Removal of droplets abrogates activation by Edc3. d, Edc3 activation coincides with depletion of Dcp1/Dcp2ext (red squares) from solution. Curve showing mean Edc3 activation is reproduced from c for purposes of comparison. Relative activity refers to ratio of observed rate to Dcp1/Dcp2ext in dilute phase without Edc3. Decapping data are from two independent experiments. Pelleting data are presented as mean ± s.e.m. for three independent experiments. Representative micrographs are from three independent experiments with similar results.
We used this activity partitioning assay to determine the contribution of Dcp1/Dcp2ext phase separation to overall activity in the absence or presence of Edc3. Decapping rates were comparable in Dcp1/Dcp2ext dilute and bulk phases, demonstrating Dcp1/Dcp2ext in droplets does not significantly contribute to overall activity and confirms Dcp1/Dcp2ext droplets are inactive (Fig. 4b and Supplementary Table 3). Enhanced repression is not observed using this assay because it is masked by Dcp1/Dcp2ext decapping in the dilute phase. This is in contrast to droplets containing Edc3 and Dcp1/Dcp2ext, whereby activity in bulk solution is three-fold greater than the dilute phase (Fig. 4b and Supplementary Table 3). Because Dcp1/Dcp2ext activity in the dilute phase is relatively insensitive to Edc3, we conclude regulation of decapping activity predominantly occurs in condensates.
To examine Edc3 activation and phase separation more closely, we performed activity partitioning experiments at increasing Edc3 concentrations and monitored for the appearance of droplets using microscopy. Cooperative activation of decapping by Edc3 correlated with phase separation, is dependent on Edc3 dimerization, and requires interaction with HLMs (Fig. 4c, Extended Data Fig. 2a,b, Supplementary Tables 4 and 5). In contrast to bulk solution, increasing Edc3 concentration did not change rates of decapping in the dilute phase, indicating Edc3 strongly activates Dcp1/Dcp2ext through condensate formation (Fig. 4c).
We characterized the ability of Edc3 to enrich Dcp1/Dcp2ext and RNA in droplets using a pelleting assay in conjunction with fluorescence microscopy. A decrease in Dcp1/Dcp2ext from dilute phase occurred at Edc3 concentrations coinciding with condensate formation (Fig. 4d and Extended Data Fig. 2c,d). The K1/2 of Dcp1/Dcp2ext depletion (4.3 μM) agrees with the K1/2 of Edc3 activation (3.3 μM), indicating decapping activation and phase separation are coupled. Depletion of Edc3 from the dilute phase was not responsible for the differential activity observed because Edc3 accumulated in the dilute phase (Extended Data Fig. 2c). Edc3 did not affect RNA partitioning but did increase RNA mobility in condensates and enhance Dcp1/Dcp2ext partitioning with RNA (Extended Data Fig. 3a–c). Our results suggest Edc3 reorganizes interactions in condensates and couples catalytic activation to phase separation to compartmentalize decapping activity.
Edc3 shifts a conformational equilibrium in Dcp1/Dcp2
Dcp1/Dcp2 is dynamic and exists in multiple states preceding formation of a catalytically active complex (Fig. 5a)44. In the absence of activators and substrate, Dcp1/Dcp2core is in equilibrium between an inactive form where the cap binding site and RNA binding channel are occluded and a precatalytic form that can bind RNA and is on-pathway to decapping45–48. We used NMR spectroscopy to understand how the Dcp2 C-terminus and Edc3 affect the Dcp1/Dcp2 equilibrium to inhibit and activate decapping under conditions where Dcp1/Dcp2ext does not phase separate and then asked if a similar mechanism is responsible for activation in condensates.
Fig. 5 |. The Dcp2 C-terminus stabilizes an autoinhibited conformation required for regulation of decapping in condensates.
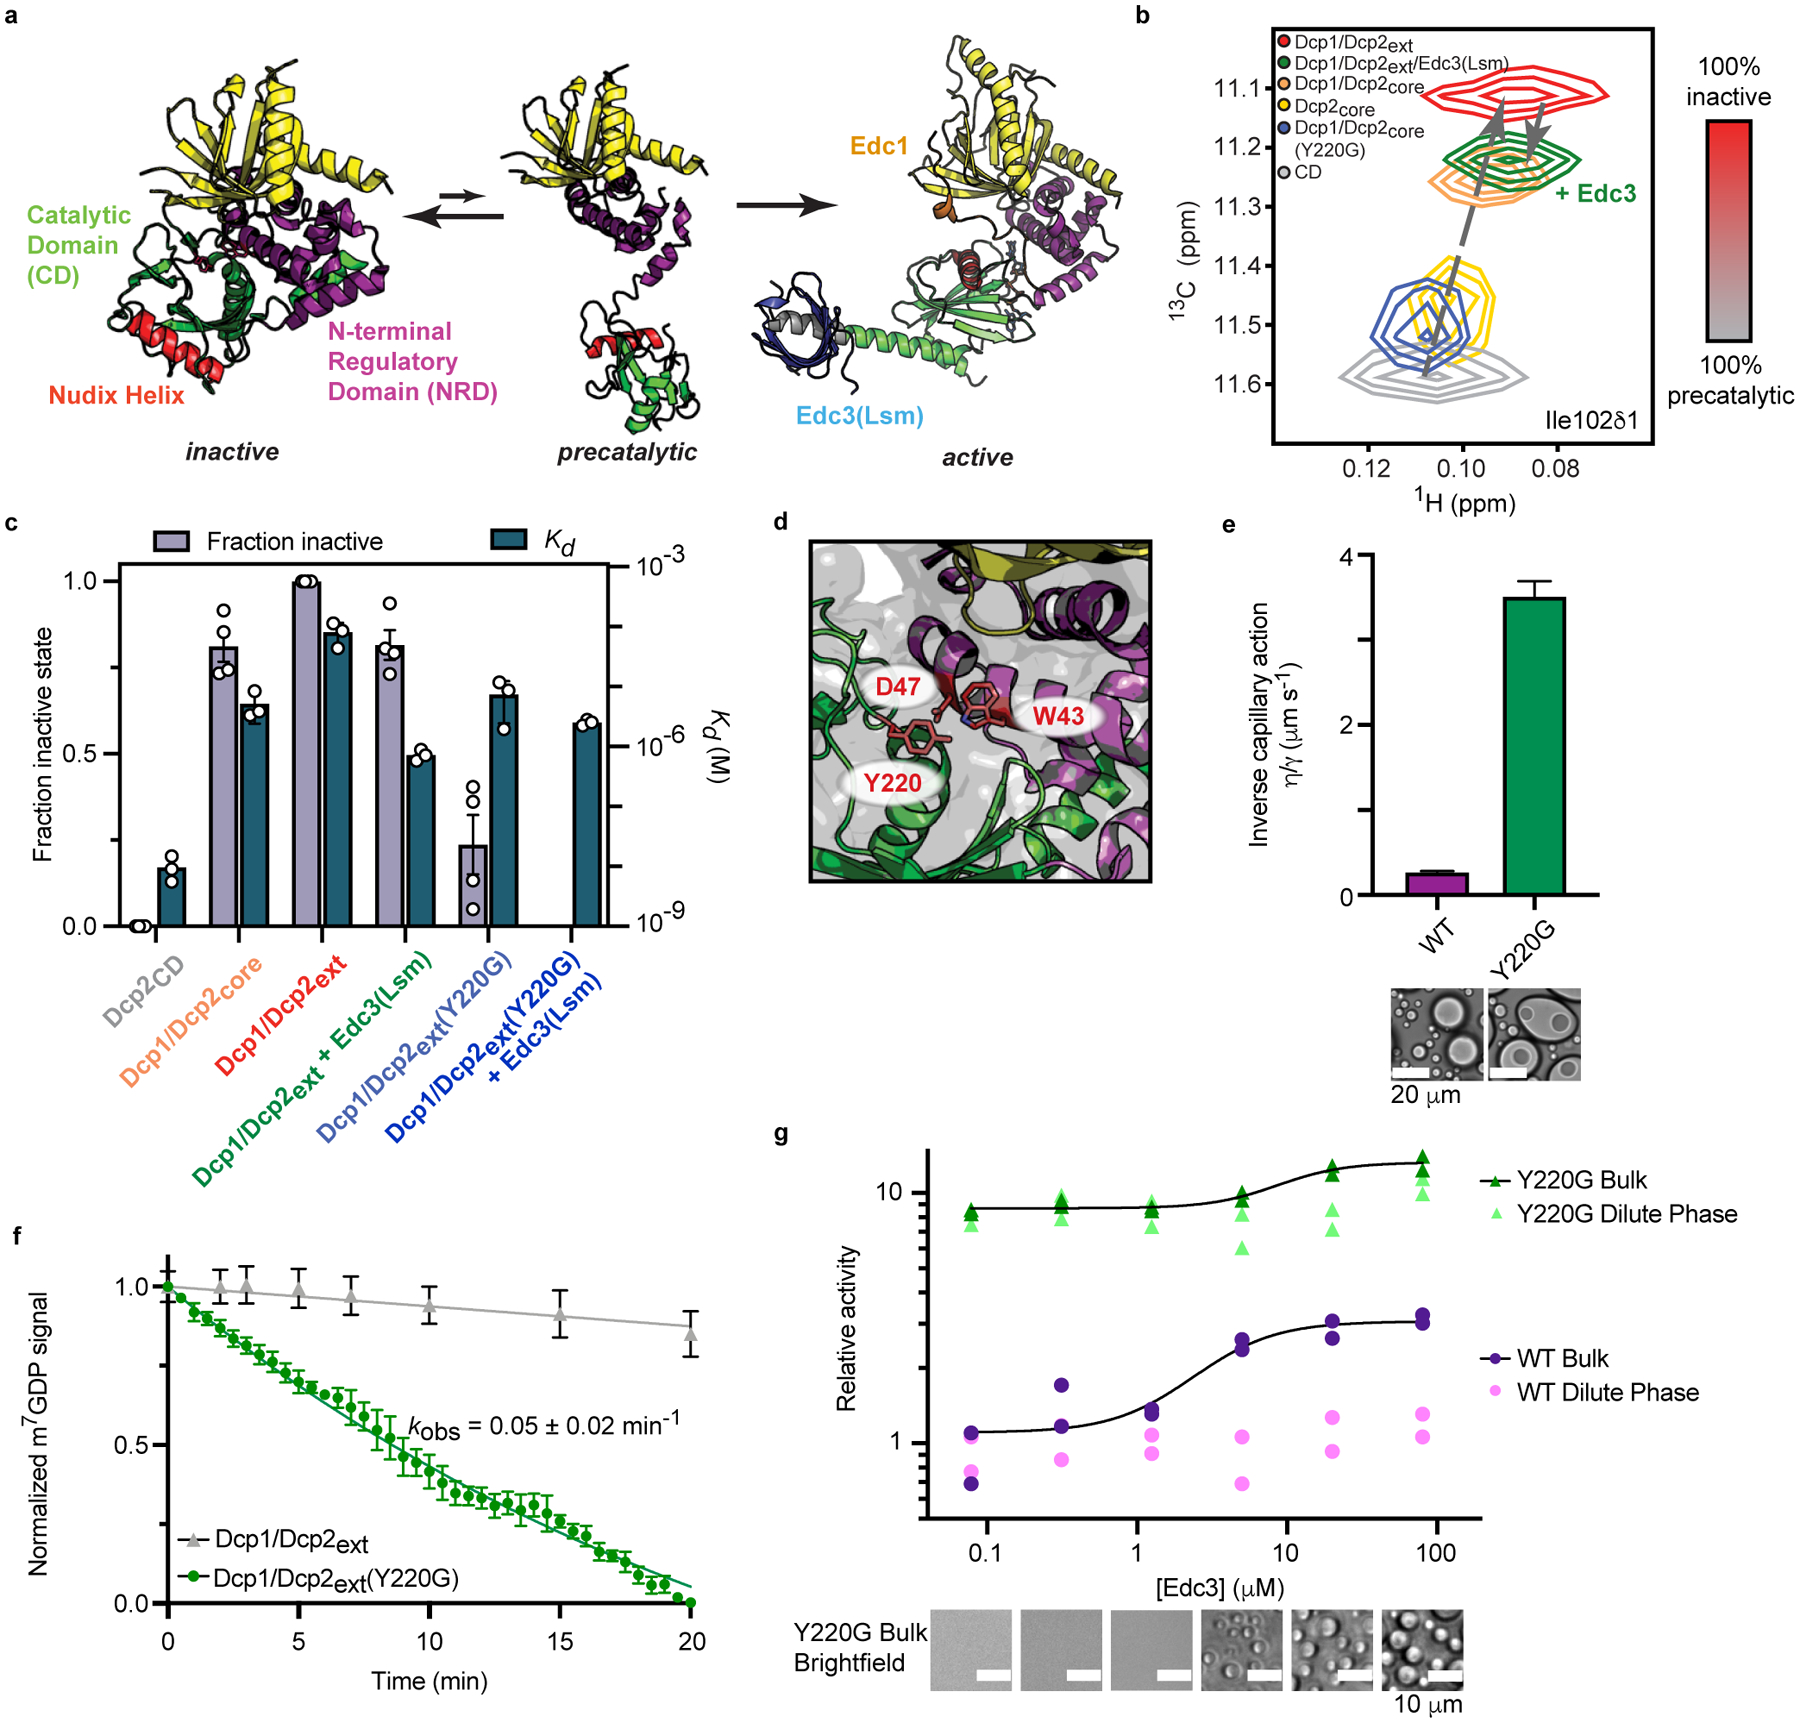
a, Dcp2 conformation is in a fast equilibrium between inactive and precatalytic states (PDB: 2QKM). Activators Edc1 and Edc3 stabilize the active state (PDB: 6AM0). Dcp1/Dcp2core is colored as in Figure 1a and the Nudix Helix, which contains catalytic residues is colored red. b, 1H/13C-HSQC of methyl group in Ile102 undergoes linear chemical shift changes toward the inactive state when the Dcp2 regulatory domain, Dcp1, and the Dcp2 C-terminus are added. Edc3 and Y220G mutation in the Dcp2 catalytic domain revert the chemical shift toward the precatalytic state. c, The population of the inactive state correlates with weakened RNA binding by Dcp1/Dcp2. Data from four NMR resonances and three independent RNA binding experiments are presented as mean ± s.e.m. d, Y220 residue in the Dcp2 catalytic domain occludes residues critical for m7G recognition (W43 and D47) in the inactive state. e, Dcp1/Dcp2ext(Y220G) droplets do not relax to a spherical state after fusion, contain subcompartments, and exhibit a ten-fold greater viscosity-to-surface tension ratio relative to wild-type Dcp1/Dcp2ext droplets. Protein concentration is 100 μM. Reported error is standard error of the fit to data in Extended Data Fig. 5c. f, Dcp1/Dcp2ext(Y220G) increases decapping of dual-labeled RNA substrate 10-fold in droplets. Wild-type Dcp1/Dcp2ext data from Fig. 3g is reproduced for comparison. m7GDP intensity is normalized to initial fluorescence signal. Data are presented as mean ± s.e.m for twenty droplets examined over two independent experiments. g, The Y220G mutation activates decapping and minimizes contribution from decapping in condensates. Data presented are from two independent experiments and relative activity is determined by ratio of observed rates to wild-type Dcp1/Dcp2ext in absence of Edc3. Representative micrographs are from three independent experiments with similar results.
Studying conformational dynamics in proteins containing large IDRs is challenging due to significant overlap of crosspeaks in the NMR spectra. To overcome this, we prepared a segmentally-labelled Dcp1/Dcp2ext that retains activity and gives a well-dispersed spectrum, allowing for transfer of assignments from Dcp1/Dcp2core (Supplementary Fig. 4a–c and 5a). The Dcp2 C-terminus caused global chemical shift perturbations in Dcp1/Dcp2core, suggesting it interacts with or reorganizes Dcp1/Dcp2core (Supplementary Fig. 6a,b). While perturbations caused by the C-terminus indicate an equilibrium involving more than two states, chemical shifts in the CD are largely co-linear with those caused by the Dcp2 NRD and Dcp1, suggesting the C-terminus influences the inactive—precatalytic equilibrium (Fig. 5b and Extended Data Fig. 4a). Because this equilibrium is fast on the NMR chemical shift timescale, resonance positions report on the population-weighted average of the two states. Assuming the magnetic environment of the isolated CD approximates the precatalytic state, we conclude the C-terminus increases the population of the inactive form (Fig. 5c)45,49. Additionally, Dcp1/Dcp2ext interaction with RNA is disfavored relative to Dcp1/Dcp2core as shown by a ten-fold increase in the Kd (Fig. 5c, Extended Data Fig. 5a, and Supplementary Table 6). Together, these results implicate stabilization of the inactive state as the mechanism for autoinhibition.
We next asked if Edc3 alleviates autoinhibition by shifting the conformational equilibrium of Dcp1/Dcp2ext to the precatalytic form. To prevent NMR resonance broadening, we assayed activation using the Edc3 Lsm domain, Edc3(Lsm), which is sufficient to enhance Dcp2 catalysis and abrogates phase separation (Fig. 2c)36. Globally, Edc3(Lsm) reduced the perturbations observed in Dcp1/Dcp2ext to more closely resemble Dcp1/Dcp2core, indicating fewer interactions or rearrangements between the Dcp2 C-terminus and core domains (Supplementary Fig. 6a,b). In addition, Edc3(Lsm) caused migration of Dcp1/Dcp2ext resonances along the linear trajectory toward Dcp1/Dcp2core, suggesting an increase in the fraction of precatalytic Dcp1/Dcp2ext complex (Fig. 5b,c and Extended Data Fig. 4a). Edc3(Lsm) also decreased Dcp1/Dcp2ext Kd for RNA 100-fold (Fig. 5c, Extended Data Fig. 5a, and Supplementary Table 6). We conclude Edc3 activates decapping by favoring the precatalytic conformation and enabling RNA recognition and hydrolysis.
Conformational changes control decapping in condensates
We previously predicted a conserved aromatic residue in the Dcp2 catalytic domain (Y220) stabilizes the inactive state by contacting residues critical for m7G recognition (W43 and D47) (Fig. 5d)36. Supporting this, mutating Y220 to glycine (Y220G) alleviates autoinhibition and bypasses Edc3 activation36. We evaluated whether this gain-of-function arises from changes in the precatalytic—inactive equilibrium in Dcp1/Dcp2. Chemical shifts reporting on this equilibrium underwent significant perturbations toward the precatalytic state, indicating Y220G disrupts formation of the inactive conformation (Fig. 5b,c and Extended Data Fig. 4a). In addition, the Y220G mutation increased RNA binding in Dcp1/Dcp2ext, making it largely insensitive to Edc3 (Fig. 5c, Extended Data Fig. 5a, and Supplementary Table 6). These observations confirm Edc3 favors the precatalytic conformation of Dcp1/Dcp2 and demonstrates how the Y220G mutation bypasses Edc3 activation.
Interactions important for autoinhibition are also crucial for Dcp1/Dcp2ext droplet formation (Fig. 2c,d). We next used the Y220G mutation to ask if Dcp1/Dcp2ext phase separation and conformational equilibrium are coupled. Dcp1/Dcp2ext(Y220G) forms droplets with altered physicochemical properties that contain substructures and fail to properly relax after fusion, with a 10-fold increase in inverse capillary action relative to wild-type (Fig. 5e, Extended Data Fig. 5b, Supplementary Videos 1,2). This suggests the conformational equilibrium of Dcp1/Dcp2 is coupled to the liquid-like properties of condensates and Y220 may be required for interactions promoting phase separation.
The Y220G mutation destabilizes the inactive state of Dcp1/Dcp2 and alters Dcp1/Dcp2ext droplets. These observations predict the Y220G mutation may activate decapping in condensates because interactions important for Dcp1/Dcp2ext droplet formation promote the inactive state. Dcp1/Dcp2ext(Y220G) decaps the dual-labeled RNA in droplets at 0.05 min−1, 10-fold faster than wild-type (Fig. 5f, Extended Data Fig. 5c). We conclude the formation of the inactive state is crucial for repressing decapping activity in Dcp1/Dcp2ext condensates.
Similar to Edc3, the Y220G mutation promotes the precatalytic conformation. If Edc3 cannot conformationally regulate Dcp1/Dcp2, then its ability to couple activation and phase separation may be impaired. Activity partitioning experiments show Dcp1/Dcp2ext(Y220G) enhanced decapping 8-fold and Edc3 minimally activated decapping (Fig. 5g and Supplementary Table 7). In addition, Edc3-mediated activation and phase separation were no longer correlated (Extended Data Fig. 5d). Thus, the Y220G mutant decouples activation from phase separation to stimulate Dcp2 catalysis inside or outside condensates. We conclude Dcp2 conformation is crucial for proper regulation and compartmentalization of mRNA decapping activity in condensates.
Strong activation of Dcp2 requires condensate rewiring
Edc1 promotes the active conformation of Dcp2 through a mechanism distinct from Edc3 and activates decapping to a greater extent than Edc3 in solution (Fig. 5a)36,45. Because Edc1 disrupts the inactive state, we hypothesized it acts similar to the Y220G mutation and activates decapping in both the bulk and dilute phases. We found Edc1 activated decapping >10-fold and Edc3 did not further enhance catalysis (Fig. 6a and Supplementary Table 8). Additionally, Edc1 increases the critical concentration of Dcp1/Dcp2ext and Edc3 phase separation. While Edc1 increased the rate of Dcp1/Dcp2ext catalysis in condensates, full activation required both Edc1 and Edc3 (Fig. 6b). Thus, Edc3-mediated rearrangements are necessary to overcome the repressed catalytic environment of Dcp1/Dcp2ext condensates to promote maximal activation.
Fig. 6 |. Maximum activation of Dcp1/Dcp2ext in condensates requires Edc3.
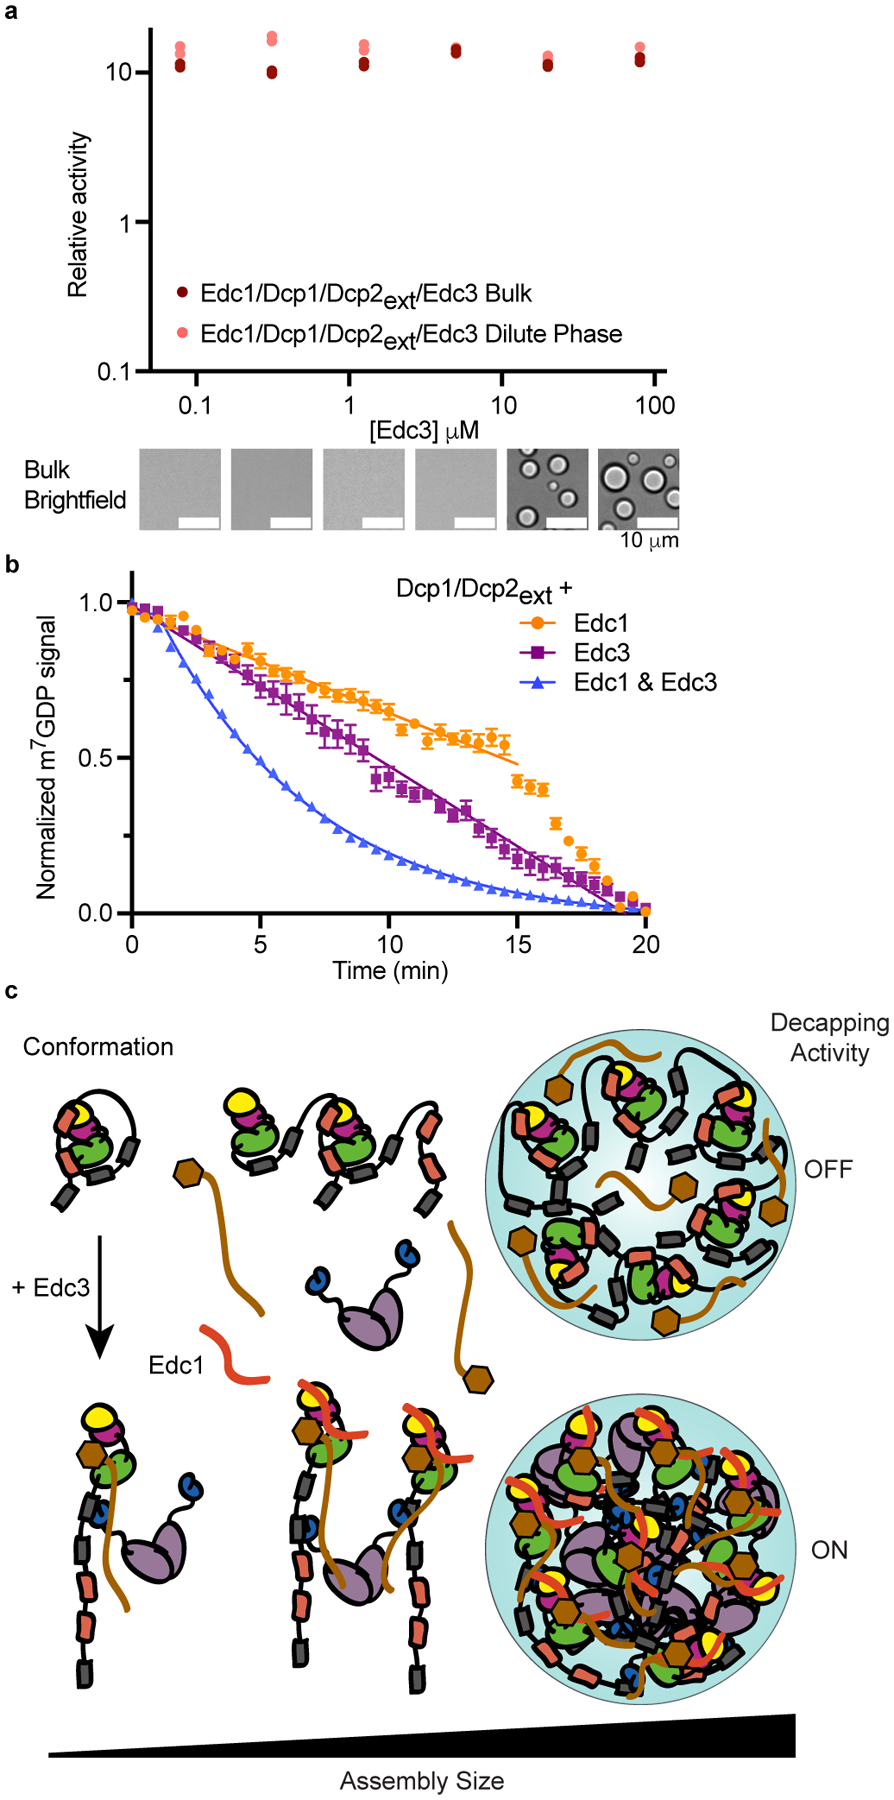
a, Edc1 activates Dcp1/Dcp2ext independent of Edc3-mediated phase separation and abrogates contribution of decapping in condensates. Data from two independent experiments are shown and relative activity reflects ratio between observed rates and rates for Dcp1/Dcp2ext in absence of Edc1 and Edc3. Representative micrographs are from three independent experiments with similar results. b, Edc1 activates Dcp1/Dcp2ext in droplets but requires Edc3 for maximal activation. Data represents mean ± s.e.m from twenty droplets examined over two independent experiments. c, Model showing how Edc3 mediates a conformational change in Dcp1/Dcp2 that is coupled to an alteration of the protein-protein interactions promoting higher-order assemblies found in condensates. These changes in interactions switch decapping activity from an off to on state. Edc1 stabilizes the active conformation to activate Dcp1/Dcp2 inside and outside condensates.
DISCUSSION
We addressed the influence of phase separation on RNA decapping by Dcp1/Dcp2. We found decapping can be both repressed and activated in condensates (Fig. 6c). We explain this differential activity by demonstrating changes in Dcp1/Dcp2 conformation are coupled to alterations in the protein network underlying condensate formation. IMs in Dcp2 stabilize an autoinhibited conformation and drive self-association into condensates repressed in decapping activity. The activator Edc3 rectifies this inhibited environment to promote mRNA decapping in condensates by rewiring interactions and causing a conformational change in Dcp1/Dcp2 important for substrate recognition. Edc1 and a mutation in Dcp2 destabilize the inactive conformation of Dcp1/Dcp2 to activate decapping inside and outside condensates. Our work suggest IDRs of enzymes can couple phase separation to conformational control of activity. Edc3 activates decapping 90-fold in droplets, which is in contrast to the three-fold stimulation determined in bulk experiments (Fig. 3 and 4). The amplification of decapping activation in condensates is greater than in the surrounding solution because phase separation strongly inhibits Dcp1/Dcp2 activity. Our results demonstrate the C-terminus of Dcp2 favors an inactive state and it is possible this equilibrium is further shifted in condensates to repress enzyme activity. Consistent with this view, a mutation in Dcp2 (Y220G) disfavors the autoinhibited state to activate decapping and alters the material properties of Dcp1/Dcp2 condensates (Fig. 5). These observations suggest active site conformation is coupled to long-range interactions in condensates to directly regulate activity. Evaluating enzyme dynamics in condensates is an exciting challenge for the future.
Macromolecular composition and conformation are important for regulating specificity in biochemical processes in condensates1,6,7,9. We propose composition and the underlying interactions serve as a mechanism to allosterically inhibit or activate enzymatic activity. In the framework of 5’–3’ mRNA decay, cells may leverage this feature to minimize aberrant degradation events that would result from widely distributed decay mRNPs. In support, the Y220G mutation and Edc1 decouple activation from phase separation to cause rapid decapping with rates indistinguishable inside or outside condensates. The widespread, accelerated decapping could explain the conditional lethality observed for both the Y220 mutation and removal of the Dcp2 C-terminus in yeast47. Furthermore, Edc1-like activators may co-opt this allosteric regulation under conditions of cellular stress to target mRNA for degradation independent of phase separation. Future examination of the cooperation between cofactors will be critical to understanding how enzymatic activity is regulated in biochemical pathways enriched in condensates.
Our reconstitution of condensates containing the eukaryotic decapping machinery largely recapitulates the micromolar concentrations observed in P-bodies32. Previous in vitro analysis indicated decapping activity in bulk solution was two-fold inhibited in the presence of Dcp1/Dcp2/Edc3 condensates and excess RNA42. We observed similar inhibition of initial decapping rates in condensates when RNA is in excess, however decapping was still activated 25-fold relative to Dcp1/Dcp2ext condensates (Extended Data Fig. 1g). This activation arises from the presence of inhibitory motifs in Dcp2 that increase repression of activity in condensates, which was not observed in prior studies that lacked these motifs42. The data presented here underscore the complementarity of monitoring both the phase-separated environment and bulk solution to uncover mechanistic insights into the regulation of enzymatic activity in condensates. Furthermore, the fluorescent probes developed here can be used to examine molecular mechanisms in other condensates important for RNA biology.
Phase separation is important for regulating numerous enzymatic processes. We demonstrate the importance of mesoscale phase-separated assemblies in regulating mRNA decapping. The interplay between composition, molecular interactions, and active site conformation in Dcp2 condensates underscore the complexity of phase separation in cellular processes. The emergent properties afforded by phase separation equip cells with highly regulatable sites of enzyme activity that may explain why P-bodies and other biomolecular condensates can give rise to multiple biochemical outcomes.
ONLINE METHODS
Protein Expression and Purification
See Supplementary Table 1 for protein constructs, solubility tags, and expression vectors used in this study. Dcp1/Dcp2 constructs were expressed in E. coli BL21(DE3) (New England Biolabs) grown in LB medium. Cells were grown at 37°C until OD600 = 0.6–0.8 and transferred to 4°C for 30 min before induction with 0.75 mM IPTG. Cells were induced for 16–18 hours at 20–25°C. Cells were harvested at 5000g, resuspended in lysis buffer (25 mM HEPES pH 7.5, 400 mM NaCl, 10 mM 2-mercaptoethanol, 0.1% Triton X-100) supplemented with lysozyme and protease inhibitor cocktail (Roche), lysed by sonication (50% duty cycle, 4 × 1 min), and clarified at 16,000g. Clarified lysate was loaded onto a StrepTrap column (GE Healthcare), washed with 10 column volumes (CV) lysis buffer without detergent followed by a second wash with 10 CV 25 mM HEPES pH 7.5, 100 mM NaCl, 10 mM 2-mercaptoethanol. Step elution of target proteins was performed with 25 mM HEPES pH 7.5, 100 mM NaCl, 1 mM DTT, 5 mM desthiobiotin. For Edc3 and Dcp1/Dcp2 constructs lacking a C-terminal StrepII tag, a HisTrap column (GE Healthcare) was used in place of the StrepTrap. For purification by HisTrap, the lysis and wash buffers described above were supplemented with 10 mM imidazole and contained 10 mM 2-mercaptoethanol in place of DTT. Proteins were eluted from the HisTrap column in 10CV wash buffer supplemented with 250 mM imidazole and incubated overnight with TEV protease. Following Strep purification or TEV digestion, target proteins were loaded onto a HiTrap Heparin column (GE Healthcare) and washed with 10CV low salt buffer (25 mM HEPES pH 7.5, 100 mM NaCl, 1 mM DTT). Protein ellution then occurred over a 10CV gradient to 100% high salt buffer (25 mM HEPES pH 7.5, 1 M NaCl, 1 mM DTT). Proteins were purified with a final size-exclusion chromatography step using a Superdex75 or 200 16/60 column (GE Healthcare) equilibrated in 25 mM HEPES pH 7.5, 150 mM NaCl, 1 mM DTT. Proteins were analyzed by SDS-PAGE, concentrated, and flash frozen in liquid nitrogen for storage at −80°C.
A pET29 plasmid encoding a pentamutant SortaseA(Δ59) construct from S. aureus with improved activity (eSrtA) was obtained from Addgene (plasmid #75144) and expressed in LB medium at 18°C for 16 hours50. Cells were pelleted at 5000g and resuspended in lysis buffer containing 50 mM Tris pH 8, 300 mM NaCl, 10 mM imidazole, 1 mM MgCl2, and protease inhibitors (Roche). Following sonication (50% duty cycle, 4 × 1 min) the lysate was clarified at 16000g. Clarified lysate was passed over a HisTrap Nickel affinity purification column, and eSrtA was eluted in 25 mM HEPES pH 7.5, 150 mM NaCl, 250 mM imidazole. A final dialysis against 25 mM HEPES pH 7.5, 150 mM NaCl was performed overnight at 4°C. Dialyzed eSrtA was concentrated to 1 mM final concentration and flash frozen for storage and later use.
Fluorescent-labeling of purified proteins and RNAs
Fluorescent Dcp1/Dcp2ext and Edc3 were generated by diluting the protein to 0.5 mg/mL and dialyzing at 4°C for four hours in size exclusion buffer without DTT. Cy5 or Fluorescein maleimide (Thermo-Fisher) was added to the protein solution in 5-fold molar excess and incubated for one hour at room temperature. The reaction was quenched with 10 mM β-ME and free dye was separated from labelled protein by Illustra NICK columns (GE Healthcare). Labelled protein was exchanged back into size exclusion buffer containing DTT by concentrating and diluting 10-fold three times. Labelling efficiency and concentrations were calculated by UV-Vis spectroscopy. Labelled oligonucleotides were purchased from Integrated DNA Technologies with a 5’ 6-FAM modification.
Brightfield and Fluorescence Microscopy
Microscopy images were collected on an inverted widefield fluorescence Nikon Ti-E microscope equipped with a Hamamatsu Flash4.0 camera using PlanApo 20x or 40x air objectives. Samples were imaged in a Greiner Bio-One 384-well glass bottom plate PEGylated using 20 mg/mL PEG-Silane (Laysan Bio, MPEG-SIL-5000) and passivated with 100 mg/mL BSA as described51. Prior to addition of samples, the wells were washed 3x with 25 mM HEPES pH 7.5, 150 mM NaCl, 1 mM DTT. Dcp1/Dcp2 constructs assayed for phase separation by microscopy were prepared by initiating removal of the N-terminal MBP solubility tag with 1:40 molar equivalent TEV:Dcp1/Dcp2. Dcp1/Dcp2/Edc3 droplets were prepared by incubating Dcp1/Dcp2 and Edc3 prior to removal of the N-terminal MBP tag from Dcp1/Dcp2ext. Imaging was performed after 30 minutes to ensure TEV cleavage and droplet. Image analysis was performed using ImageJ52. For localization and enrichment of Dcp1/Dcp2ext, Edc3, or RNA in droplets, 1%–5% protein concentration was fluorescently labelled. Enrichment was estimated from the average ratio of intensity in at least twenty droplets (Idroplet) to average intensity in surrounding solution (Idilute).
Fluorescence recovery after photobleaching (FRAP) assays
For experiments examining Dcp1/Dcp2ext recovery, condensates were formed with 40 μM Dcp1/Dcp2ext. Experiments monitoring the effects of Edc3 were performed with 5 μM Dcp1/Dcp2 and 5 μM or 80 μM Edc3. For analysis of RNA recovery, condensates were formed with 40uM Dcp1/Dcp2ext with or without Edc3 and FITC-29mer RNA was added. The concentration of labeled protein or RNA was 250 nM across all samples. Samples were imaged in a passivated glass bottom 384-well plate (Greiner Bio-One). Imaging was performed at room temperature using an inverted Nikon Ti microscope equipped with an Andor Borealis CSU-W1 spinning disk confocal, Plan Apo VC 100x/1.4 oil objective and Andor iXon Ultra DU888 EMCCD camera. For each photobleaching experiment, a rectangular region of interest (ROI) was drawn around single condensates and irradiated for 1.5s with 7mW power at 473 nm with a Vortran laser between the fifth and sixth acquired frame. For analysis, three ROIs were used corresponding to the bleached droplet, an unbleached droplet, and background. Analysis was performed using ImageJ. Recovery traces were obtained by performing a double normalization to account for photobleaching during image acquisition53. Recovery t1/2 and immobile fractions were determined from fits of single exponentials using Prism 8/9 (GraphPad) and are reported in Supplementary Table 2.
Synthesis of dually labelled RNA probe
The reagents for RNA labelling, FAM-m7Gp3AmpG and pAp-SCy5, were synthesized by modifications of previously reported methods54,55. FAM-m7G-capped RNA was generated on the template of annealed oligonucleotides, which contained a T7 Aϕ2.5 promoter sequence (CAGTAATACGACTCACTATT) and encoded a 35-nt-long sequence (AGG GAAGCG GGCATG CGGCCA GCCATA GCCGAT CA). Typical in vitro transcription reaction (100 μL) was carried out at 37 °C for 4 h and contained RNA Pol buffer (40 mM Tris-HCl pH 7.9, 6 mM MgCl2, 1 mM DTT, 2 mM spermidine), 10 U/μL T7 polymerase (ThermoFisher Scientific), 1 U/μL RiboLock RNase Inhibitor (ThermoFisher Scientific), 0.5 mM CTP/GTP/UTP, 0.125 mM ATP, 0.625 mM FAM-m7Gp3AmpG cap and 0.1 μM annealed oligonucleotides as a template. Following 4 h incubation, the template was removed by treatment with 1 U/μL DNase I (ThermoFisher Scientific) for 30 min at 37 °C. The crude RNAs were purified using RNA Clean & Concentrator-5 (Zymo Research). Transcripts quality was checked on 15% acrylamide/7 M urea gels, whereas the concentration was determined spectrophotometrically.
The obtained transcripts were directly used in the ligation step with a Sulfo-Cy5 (SCy5) labelled pAp analogue. A typical ligation reaction (30 μL) was carried out at 16 °C overnight and contained 5’ capped RNA (1 μM), 1 U/μL T4 RNA ligase 1 (New England Biolabs), 1.3 U/μL Ribolock RNase inhibitor (ThermoFisher Scientific), 100 μM pAp-SCy5 analogue, 0.1 volumes of DMSO (3 μL), 0.03 volumes of 0.1 M DTT (1 μL) and 0.1 volumes of 10 mM ATP (3 μL). The resulting dually labelled RNA was first purified using RNA Clean & Concentrator-5 (Zymo Research) followed by the final HPLC purification (Clarity® 3 μM Oligo-RP phenomenex column, linear gradient from 5% to 35% ACN in 50 mM TEAAc pH 7 over 15 min at 50 °C, Agilent Technologies Series 1200 HPLC). The collected fractions were freeze dried 3 times. RNA quality, before and after each purification step, was checked on 15% acrylamide/7 M urea gels (Figure S3), whereas the concentration was determined spectrophotometrically.
Visualization of Decapping by Microscopy
60 μM Dcp1/Dcp2ext and Dcp1/Dcp2ext(Y220G) droplets were prepared in 25 mM HEPES pH 7.5, 150 mM NaCl, 1 mM DTT, 1 mM EDTA, and 4U RNase inhibitor. To these reactions, 100 nM dual-labeled RNA and initial images were collected in passivated glass bottom wells to observe droplet localization. Decapping was initiated with 5 mM MgCl2 and control reactions were performed without addition of metal. To study the effects of Edc3, condensates were formed with 5 μM Dcp1/Dcp2ext and 80 μM Edc3. For experiments visualizing Edc3 activation in pre-formed Dcp1/Dcp2 condensates, 60 μM Dcp1/Dcp2ext and 100 nM RNA were incubated with TEV for 30 minutes at room temperature. Next, Edc3 was added 10 minutes prior to reaction initiation described above. To monitor the effects of RNA abundance on condensate decapping, experiments were performed at substoichiometric and superstoichiometric ratios RNA:Dcp1/Dcp2ext. For RNA limiting experiments, 1 μM Dcp1/Dcp2 and 15 μM Edc3 were mixed together and 100 nM dual-labeled 35mer RNA was added. For experiments with excess RNA, the RNA probe was supplemented with 19.9 μM capped, unlabeled 35mer. Experiments evaluating Edc1 and Edc3 coactivation were performed at pH 6.5 to slow catalysis, which allowed for adequate image acquisition. Dcp1/Dcp2ext was kept at 40 μM and 80 μM Edc1 and Edc3 were added individually or in combination prior to initiation of decapping with 5 mM MgCl2. For all experiments, images were collected in both the fluorescein and Cy5 channels and the mean droplet intensity was background corrected and calculated in ImageJ. Mean intensity was plotted as function of time and fit to a first-order exponential decay function (GraphPad Prism 8/9) except in experiments examining the effects of RNA abundance, which were fit to a second-order exponential.
Monitoring of decapping using fluorescence polarization
Serially-diluted Dcp1/Dcp2core in 25 mM Hepes pH 7.5, 150 mM NaCl, 1 mM DTT was incubated with 5 nM RNA probe in in a low volume, low binding 384 well plate (Greiner Bio-One) for 10 minutes. Reactions were monitored using a SpectraMax plate reader (Molecular Dynamics). An initial FP reading was taken to represent time ‘0’ just prior to addition of 5 mM MgCl2 and rapid mixing. Time-dependent changes in signal were monitored for 30 minutes and curves were fit to the equation:
| (1) |
where Yo is the mP value at time zero, Ymin,cap is the background mP from free FAM-m7GDP, Ymin,obs is the minimum observed mP observed during the course of the experiment, and k1, k2 are constants free to vary in fitting. We assume a decrease in mP is a consequence of decapping, which results in release of product FAM-m7GDP with rate k1. However, m7GDP product can also interact with Dcp1/Dcp2 with an observed rate of k2 to cause a concentration-dependent elevation in the endpoint mP. Determined k1 values at each concentration were plotted and fit to a single turnover Michaelis-Menten model to determine kmax.
In Vitro Decapping Assays
Synthetic 5’-triphosphate 29mer RNA (TriLink BioTechnologies) derived from the MFA2 gene of S. cerevisiae was enzymatically capped with GTP[α-32P] and S-adenosylmethionine (SAM) as previously described56. Reactions were carried out in 25 mM HEPES pH 7.5, 150 mM NaCl, 5 mM MgCl2, 0.1 mg/mL acetylated BSA with 4U RNase inhibitor. For monitoring decapping in Dcp1/Dcp2ext condensates, 100 μM total concentration was used. Prior to assays monitoring Edc3 activation, the MBP tag was removed from Dcp1/Dcp2ext using TEV and separated using Amylose resin. For reactions monitoring Edc3 activation, Dcp1/Dcp2ext was kept constant at 5 μM while Edc3 was varied from 78.1 nM to 80 μM. For reactions examining coordinated activation of decapping by Edc1 and Edc3, Edc1 was kept constant at 150 μM. Dcp1/Dcp2ext concentrations were always at least 10-fold excess over RNA to prevent product inhibition. 1.5x protein and 3x RNA solutions were equilibrated separately for 30 minutes at room temperature to allow formation of liquid droplets. To evaluate Dcp1/Dcp2ext activity in dilute phase, the bulk solution was centrifuged for 10 minutes at 13000g after incubation to pellet droplets and the supernatant was removed for subsequent assays. Reactions were initiated by mixing 15 μL 1.5x protein and 7.5 μL 3x RNA solutions. Time points were taken by quenching the reaction with excess EDTA and TLC was used to resolve m7GDP product from capped RNA. The formation of product was quantified using a GE Healthcare Typhoon 9410 scanner and ImageQuant 7 software. Observed rates, kobs, were determined by fitting to a first-order exponential. Relative activity was determined by normalizing the observed rates to the dilute phase (Fig. 4b) or to 5 μM Dcp1/Dcp2 in solution (Fig. 4c, 5g, 6a, Supplementary Fig. 5a). To examine Edc3 activation, kobs versus Edc3 concentration was fit to the model:
| (2) |
in order to obtain kmax, K1/2, and n. See Supplementary Tables 3–5, and 7–8 for absolute decapping rates.
Dcp1/Dcp2ext pelleting assay
Loss of Dcp1/Dcp2ext from solution due to phase separation as a function of Edc3 concentration was monitored by loss of fluorescent Dcp1/Dcp2ext signal. Briefly, 5 μM Dcp1/Dcp2ext (250 nM Cy5-labeled) was incubated with Edc3 concentrations used in the in vitro decapping assay experiments. Following a 30-minute incubation at room temperature, droplets were pelleted by centrifugation at 13000g for 10 minutes. The supernatant was removed and placed in a Greiner Bio-One 384-well low volume, low binding plate. Fluorescence intensity was measured on a BioTek Synergy H4 plate reader and normalized to give a fractional amount remaining in solution. In addition, the supernatant was analyzed using denaturing 4–12% Tris-glycine SDS-PAGE. Disappearance of Dcp2 was quantified using a region of interest of the same size in ImageJ and subtracting background signal.
Expression of labeled Dcp1/Dcp2 for NMR
ILVMA methyl labeling of Dcp2 or Dcp1/Dcp2 constructs was carried out in D2O M9 minimal media with 15NH4Cl and 2H /12C-glucose as the sole nitrogen and carbon sources, respectively. Labeled precursors (Ile: 50 mg L−1, Leu/Val: 100 mg L−1, Met: 100 mg L−1, Ala: 100 mg L−1) were added 40 minutes prior to induction with 1 mM IPTG. Following overnight incubation at 20–25°C, cells were lysed and purified using nickel affinity purification, TEV digestion, heparin, and size exclusion chromatography as described above.
SortaseA Ligation of segmentally-labeled Dcp1/Dcp2 for NMR
Dcp1/Dcp2(1–266) containing a C-terminal LPETGGH S. aureus SortaseA recognition site and labeled at ILVMA terminal methyl groups was expressed and purified as described above. Purified protein was then mixed with at least five-fold molar excess His6-MBP-G3-Dcp2(274–504)-StrepII expressed in LB medium and purified using GE StrepTrap and Q ion exchange columns. eSrtA equal to 0.5 molar equivalent of Dcp1/Dcp2(1–266) and 2 mM CaCl2 were added to the solution prior to initiation of the reaction with TEV protease, which cleaves the His6-MBP tag from G3-Dcp2(274–504)-StrepII to expose the required N-terminal glycine for ligation. The reaction was dialyzed against 25mM HEPES pH 7.5, 150 mM NaCl, 2 mM CaCl2 overnight at 4°C57. Ligated Dcp1/Dcp2ext, containing a mutational scar from (267STAPSDL273 in wild-type to 267LPETGGG273), was purified by heparin and StrepTrap chromatography as described. A final dialysis in 25 mM HEPES pH 7.5, 150 mM NaCl, 2 mM DTT was performed overnight at 4°C prior to NMR experiments.
NMR Experiments
NMR samples were exchanged into a buffered D2O solution containing 25 mM HEPES pD 7.1, 150 mM NaCl, and 2 mM DTT using either dialysis or a centrifugal concentrator. Note the concentration of Dcp1/Dcp2ext was kept below its critical concentration and the Edc3 Lsm domain was used to prevent confounding effects from phase separation. NMR experiments were performed on an 800 MHz Bruker Avance III or Avance NEO spectrometer equipped with a cryoprobe and Topspin3. Spectra were recorded at 298K, processed using NMRPipe, and analyzed using NMRFAM-Sparky58. Chemical shift perturbations (Δδ, ppm) between Dcp1/Dcp2ext or Dcp1/Dcp2ext/Edc3(Lsm) and Dcp1/Dcp2core were calculated from the Euclidian equation:
| (3) |
where 0.2 is a scaling factor for the carbon spectral width. CSPs were depicted on the inactive structure of Dcp1/Dcp2core using PyMOL. For calculation of the inactive state population (pinactive), we focused on resonances undergoing linear perturbations indicative of fast exchange and suggest a two-state equilibrium. The observed chemical shift was taken as the weighted average of the resonances corresponding to the precatalytic and inactive states: the catalytic domain (CD) of Dcp2 and Dcp1/Dcp2ext, respectively:
| (4) |
From this relationship, the population of the inactive state can be calculated as:
| (5) |
where ΩX is the chemical shift for a given construct of Dcp1/Dcp2 (in ppm).
Fluorescence Polarization
Fluorescence polarization (FP) was performed in Greiner Bio-One 384-well low volume, low binding plates. Conditions for all binding assays was 25 mM HEPES pH 7.5, 100 mM NaCl, 5 mM MgCl2, 0.02% Triton X-100, 0.1 mg/mL acetylated BSA and 4U RNase inhibitor with 5 nM 5’-phosphorylated oligo 30U RNA with 3’ 6-FAM (IDT). Reactions were incubated for ten minutes before measuring polarization on a LJL Biosystems Analyst AD plate reader. Equilibrium dissociation constants (Kd) were fit to the Hill equation for single-site binding:
| (6) |
where [X] represents the concentration of protein, Y0 is the mP for the probe alone, Ymax is the mP value at saturation, and n is the Hill coefficient. To prevent scattering effects from phase separation, the MBP tag was not cleaved from Dcp1/Dcp2ext and the Edc3 Lsm domain was used.
Condensate Fusion Experiments
Brightfield images were collected on a Nikon Ti-E inverted microscope equipped with a PlanApo 40x air objective and Hamamatsu Flash4.0 camera. For wild-type Dcp1/Dcp2ext, time lapse images were collected every one second while images for Dcp1/Dcp2ext(Y220G) were collected at either one second or 15 second intervals. Fusion events were analyzed in ImageJ by drawing an ellipse around droplets of similar size at each time point and measuring the long and short axis. The aspect ratio (long/short axis) was plotted as a function of time in Prism 9 (GraphPad) to determine the time of fusion, τ. Plotting τ as a function of initial length ((llong – lshort)•lshort)1/2 gives a linear relationship where the slope represents the inverse capillary action—the ratio of condensate viscosity to surface tension (η/γ)59.
DATA AVAILABILITY STATEMENT
The data supporting the findings of this study are presented within the paper and its supplementary information. Source data of uncropped gels are provided with this paper.
Extended Data
Extended Data Fig. 1. Synthesis and decapping of dually labelled 5’ capped 35 nt RNA probe.
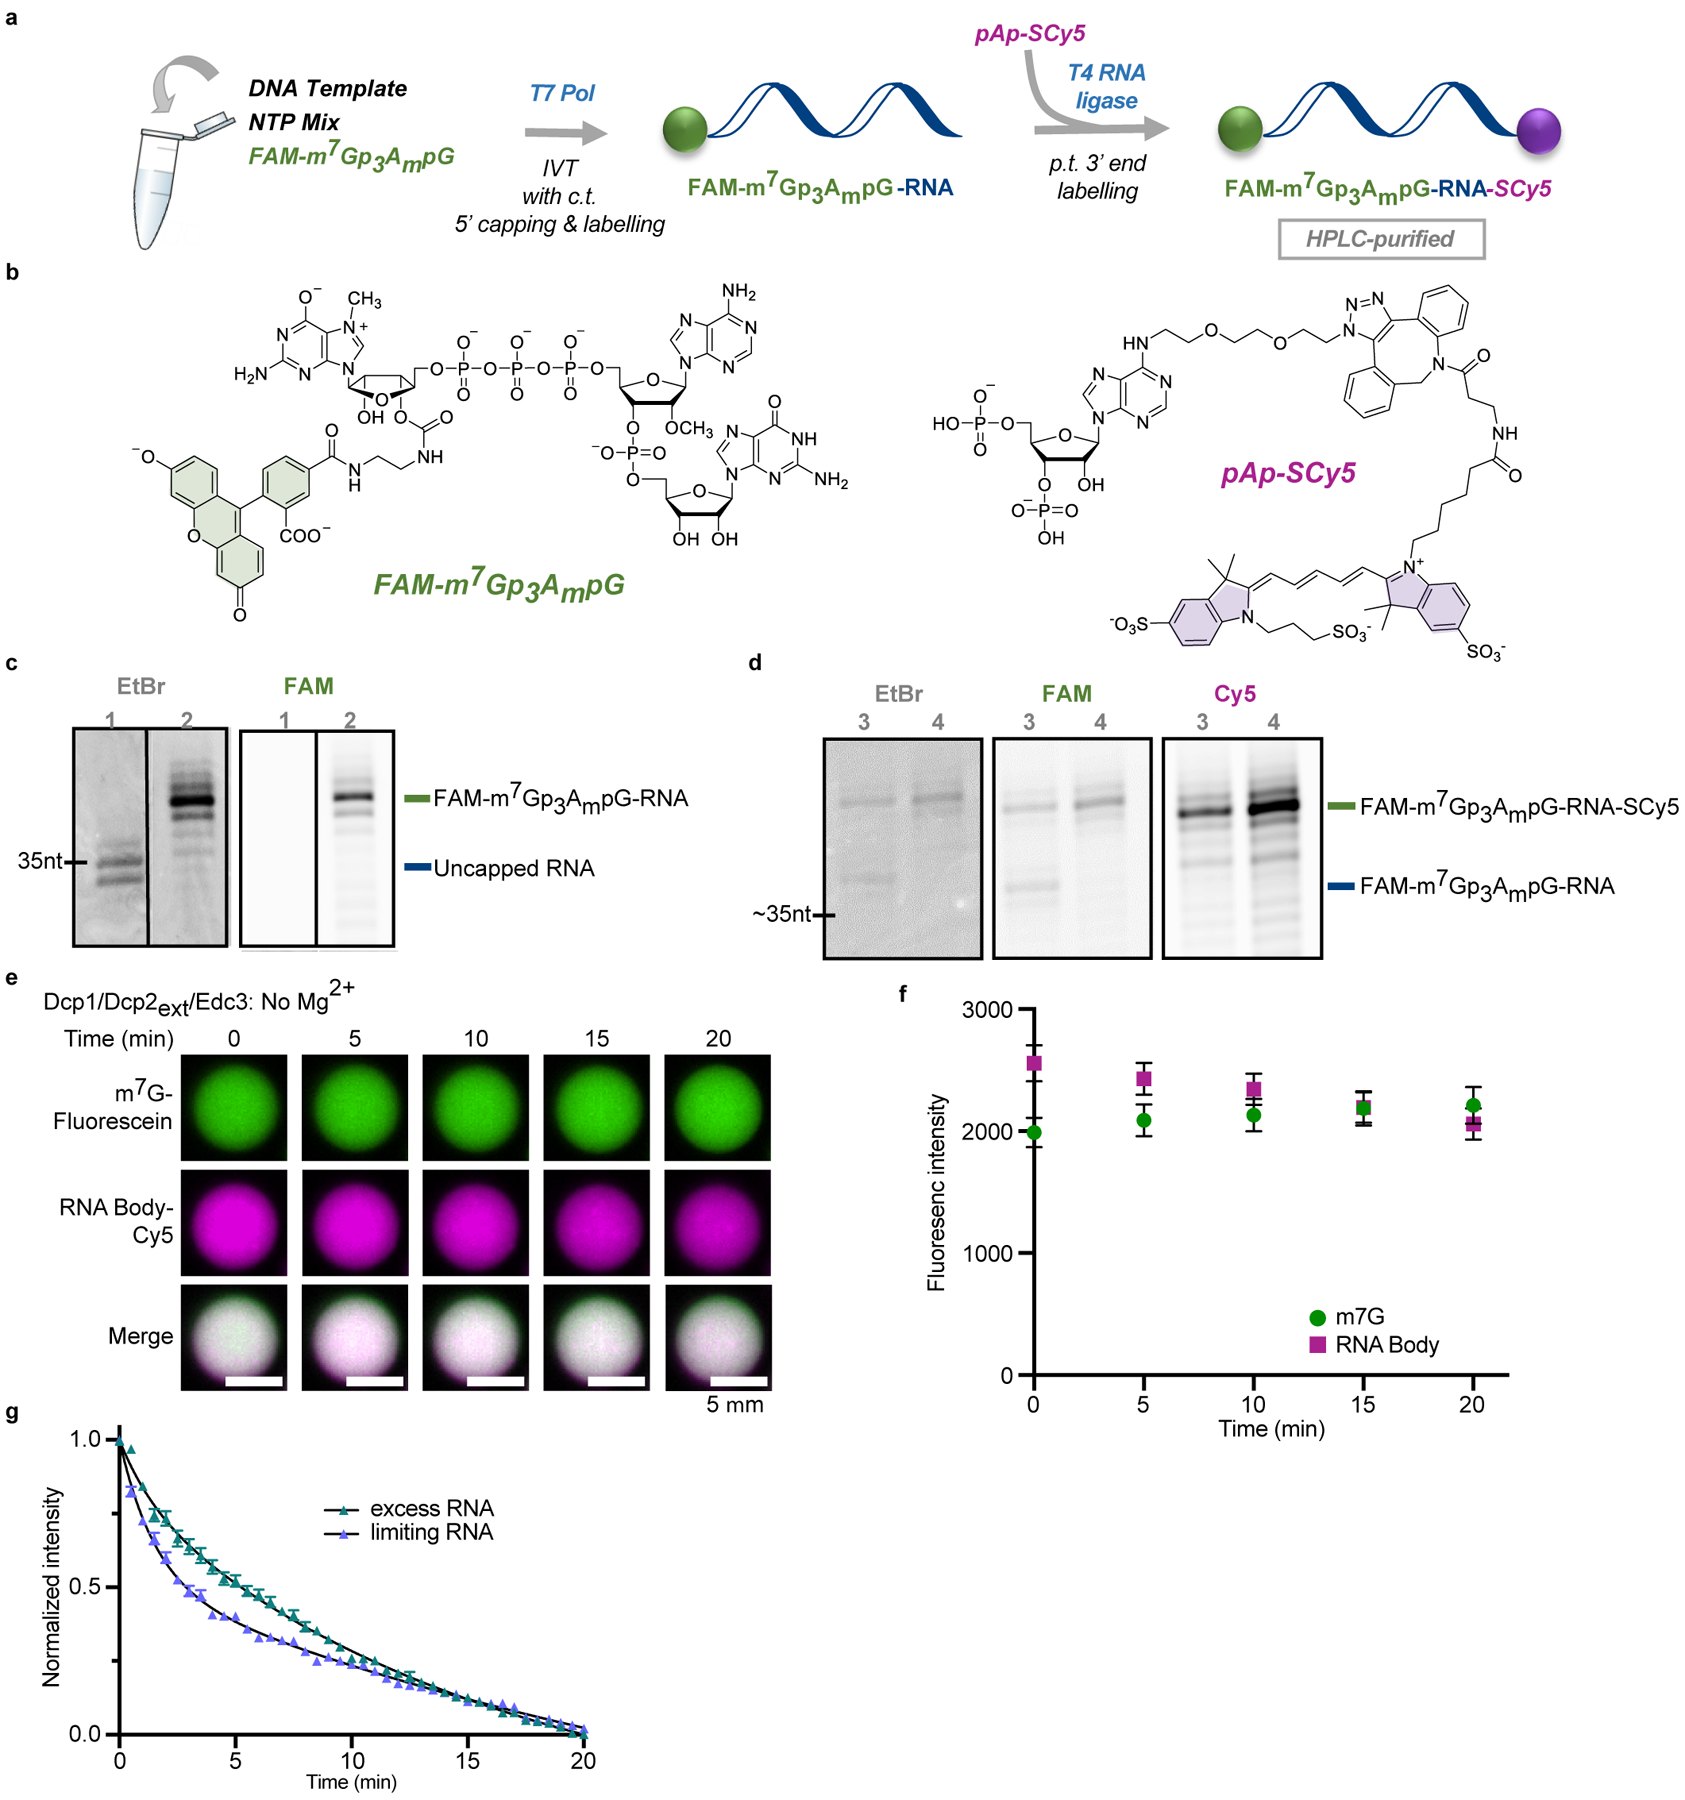
a, Overview of the labelling procedure, IVT – in vitro transcription, c.t. – co-transcriptional, p.t. – post-transcriptional; b, structures of the reagents used for the 5’ and 3’ end labelling; c, Analysis of purified 5’ capped & labelled RNA after IVT: lane 1 – reference uncapped RNA, lane 2 – RNA capped co-transcriptionally with fluorescent cap analog (FAM-m7Gp3AmpG). d, Labelling of the 3’ end of FAM-m7Gp3AmpG-RNA with pAp-SCy5 to yield dually labelled probe: lane 3 – crude dually labelled RNA after purification; lane 4 – HPLC-purified RNA probe. e, f, Co-localization of m7G cap (fluorescein) and RNA body (Cy5) in Dcp1/Dcp2ext/Edc3 condensates over twenty minutes demonstrates decapping does not occur in the absence of Mg2+, which is required for catalysis. g, Excess RNA slows initial rate of decapping two-fold in droplets formed with 1 μM Dcp1/Dcp2ext and 15 μM Edc3. Total RNA concentration is 100 nM when limiting and 20 μM when in excess. Representative micrographs and data in f, g are presented as mean ± s.e.m. for twenty droplets examined in two independent experiments with similar results. Error bars are not depicted when smaller than the data points.
Extended Data Fig. 2. Edc3 sequesters Dcp1/Dcp2ext in condensates to cooperatively activate decapping.
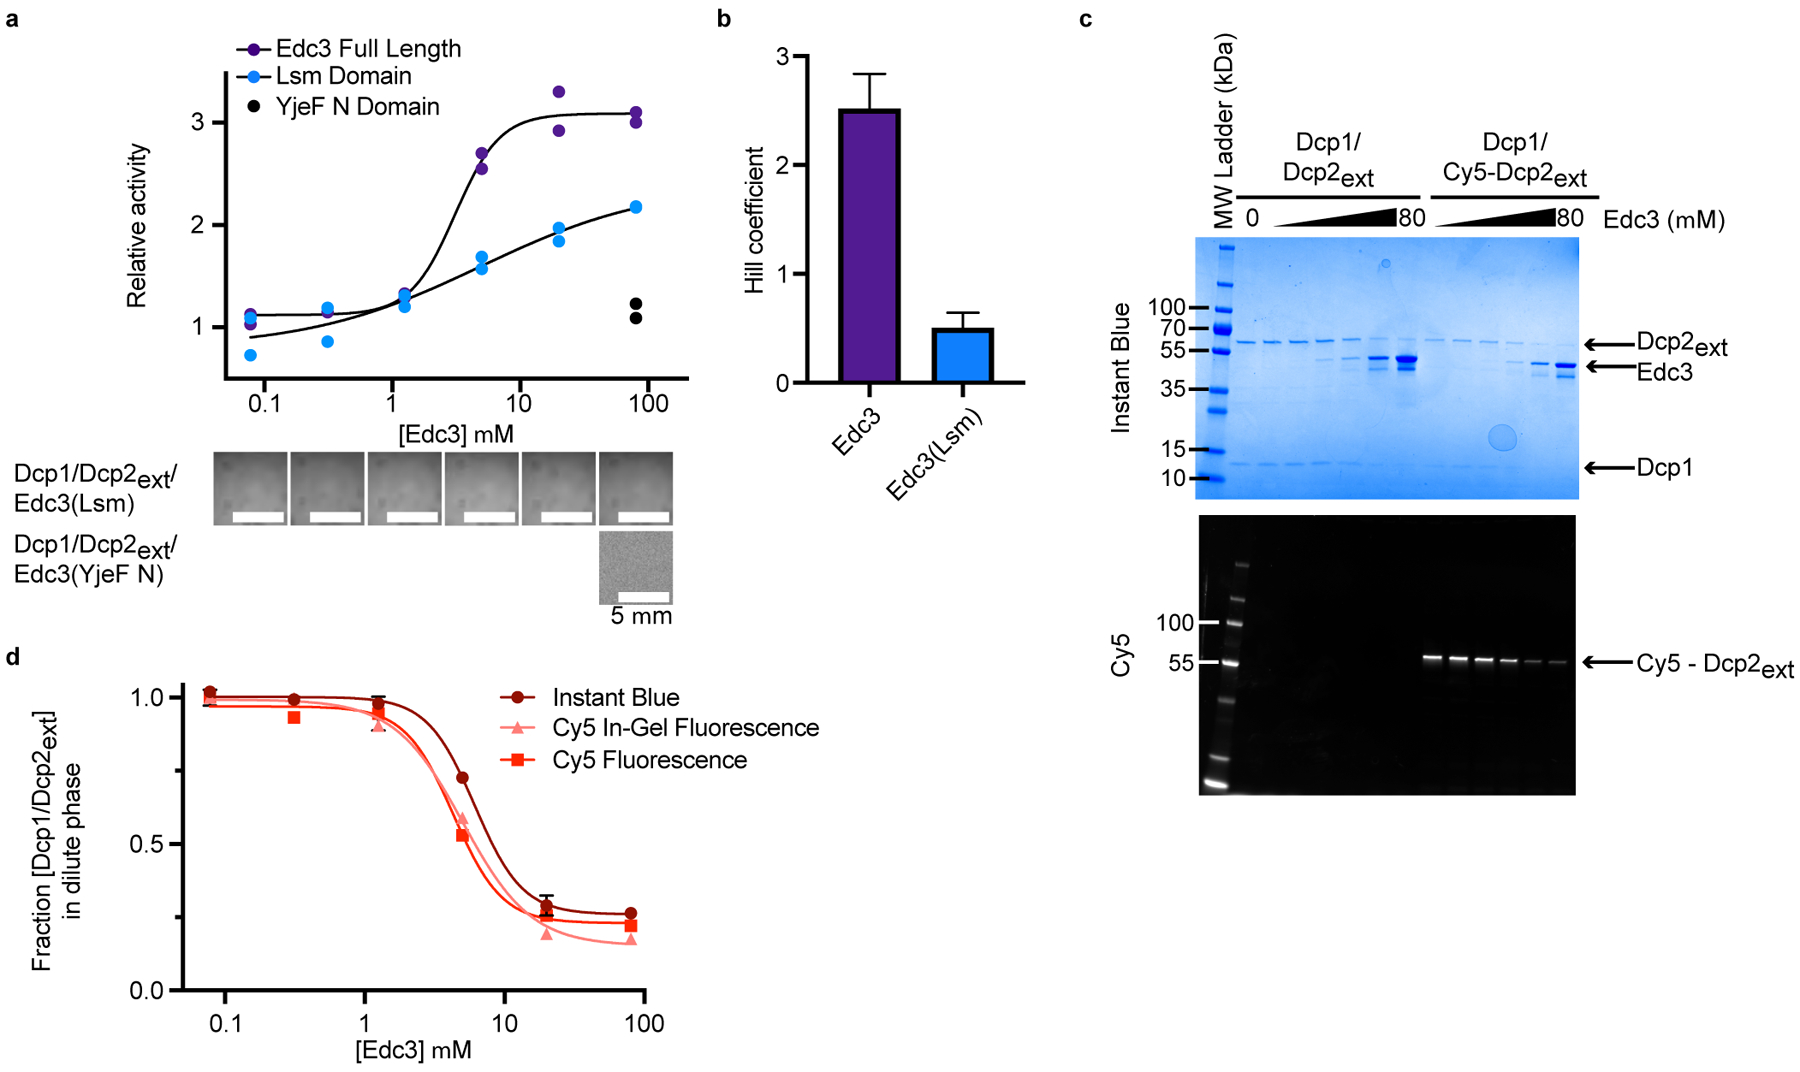
a, Enhancement of decapping by Edc3 Lsm domain occurs in the absence of condensates. C-terminal Edc3 YjeF N domain does not stimulate Dcp1/Dcp2ext activity or cause phase separation. Activation by full-length Edc3 is reproduced from Fig. 4c for comparison. Two independent experiments are shown. Representative micrographs are from three independent experiments with similar results. b, Cooperativity of activation by dimeric Edc3 is five-fold greater than the Lsm domain. Hill coefficients are reported as mean ± standard error from fitting two independent experiments shown in a. c, Depletion of Dcp1/Dcp2ext from the dilute phase at increasing concentrations of Edc3 visualized by SDS-PAGE. (Top) Instant Blue staining reveals total protein remaining in dilute phase following pelleting of liquid droplets. (Bottom) In-gel fluorescence of Cy5-labelled Dcp2 shows its Edc3-dependent disappearance from the solution. d, Quantification of Dcp1/Dcp2ext from analysis of Dcp2 stained with Instant Blue or measured by in-gel Cy5 emission. Cy5 fluorescence is reproduced from Figure 3d for comparison. Representative SDS-PAGE and quantification are from two independent experiments with data presented as mean ± s.e.m. Error bars are not shown when smaller than the data points.
Extended Data Fig. 3. Edc3 alters Dcp1/Dcp2ext enrichment and RNA mobility in liquid droplets.
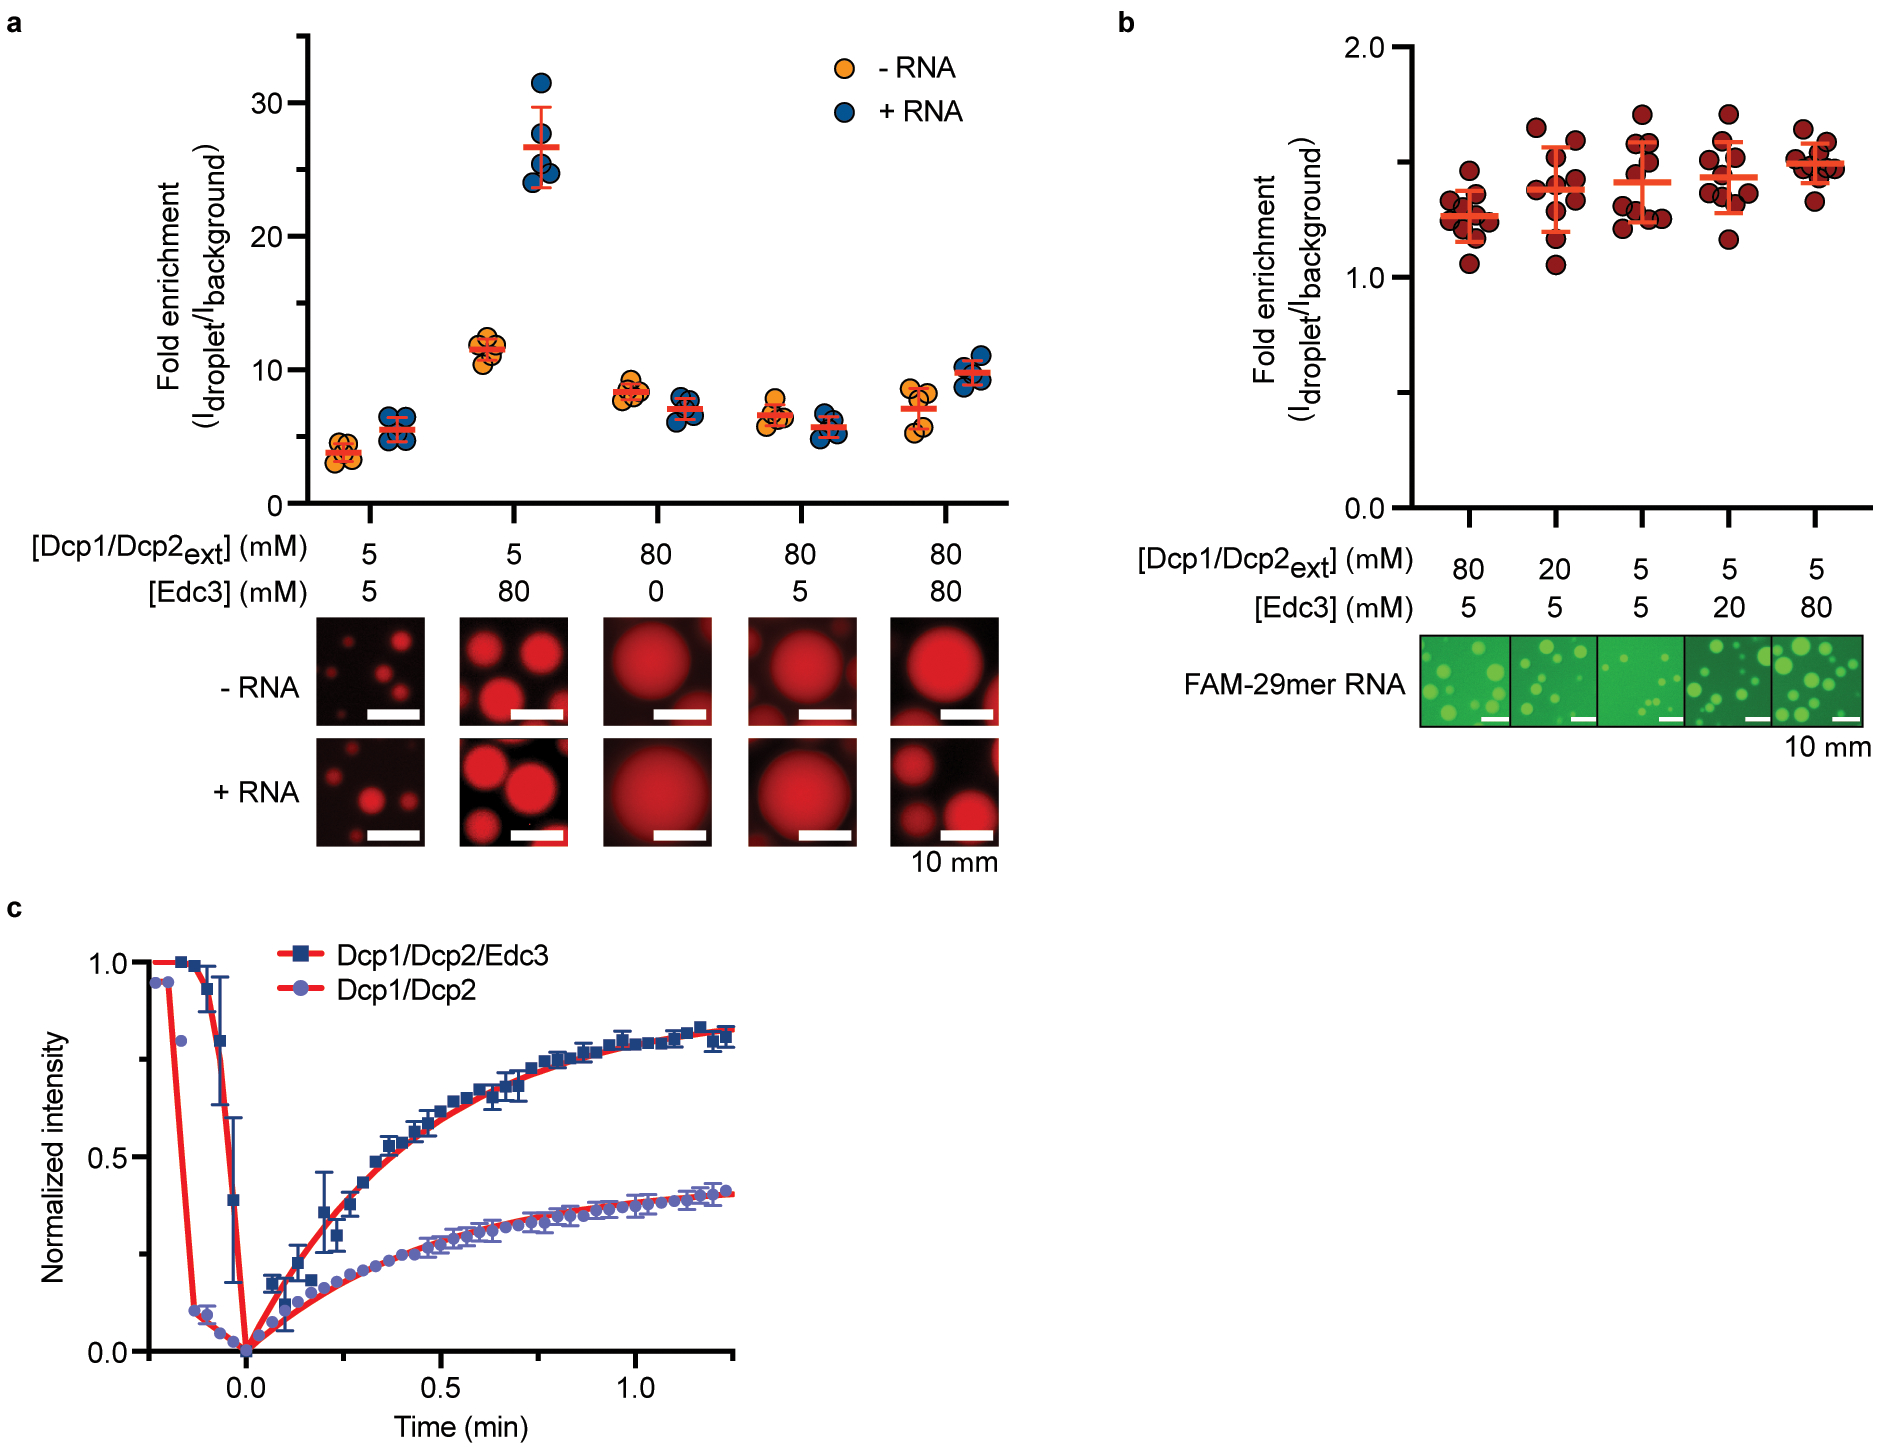
a, Superstoichiometric Edc3 enriches Dcp1/Dcp2ext in droplets and causes causes droplets to be more sensitive to presence of RNA. Images below graph correspond to representative Cy5-labelled Dcp1/Dcp2ext micrographs and data presented are mean ± s.e.m. for five independent experiments with similar results. b, Enrichment of FAM-29mer RNA in droplets of varying Dcp1/Dcp2ext and Edc3 concentrations. Representative micrographs and data presented are mean ± s.e.m. for ten independent experiments with similar results. c, Edc3 increases the mobile fraction of RNA in droplets. Dcp1/Dcp2ext concentration is 40 μM in absence and 5 μM in presence of 80 μM Edc3. Data presented are mean ± s.e.m. for twenty recovery profiles collected over two independent experiments. Error bars are not depicted when smaller than the data point.
Extended Data Fig. 4. Several resonances in the catalytic domain of Dcp2 report on the inactive—precatalytic equilibrium.
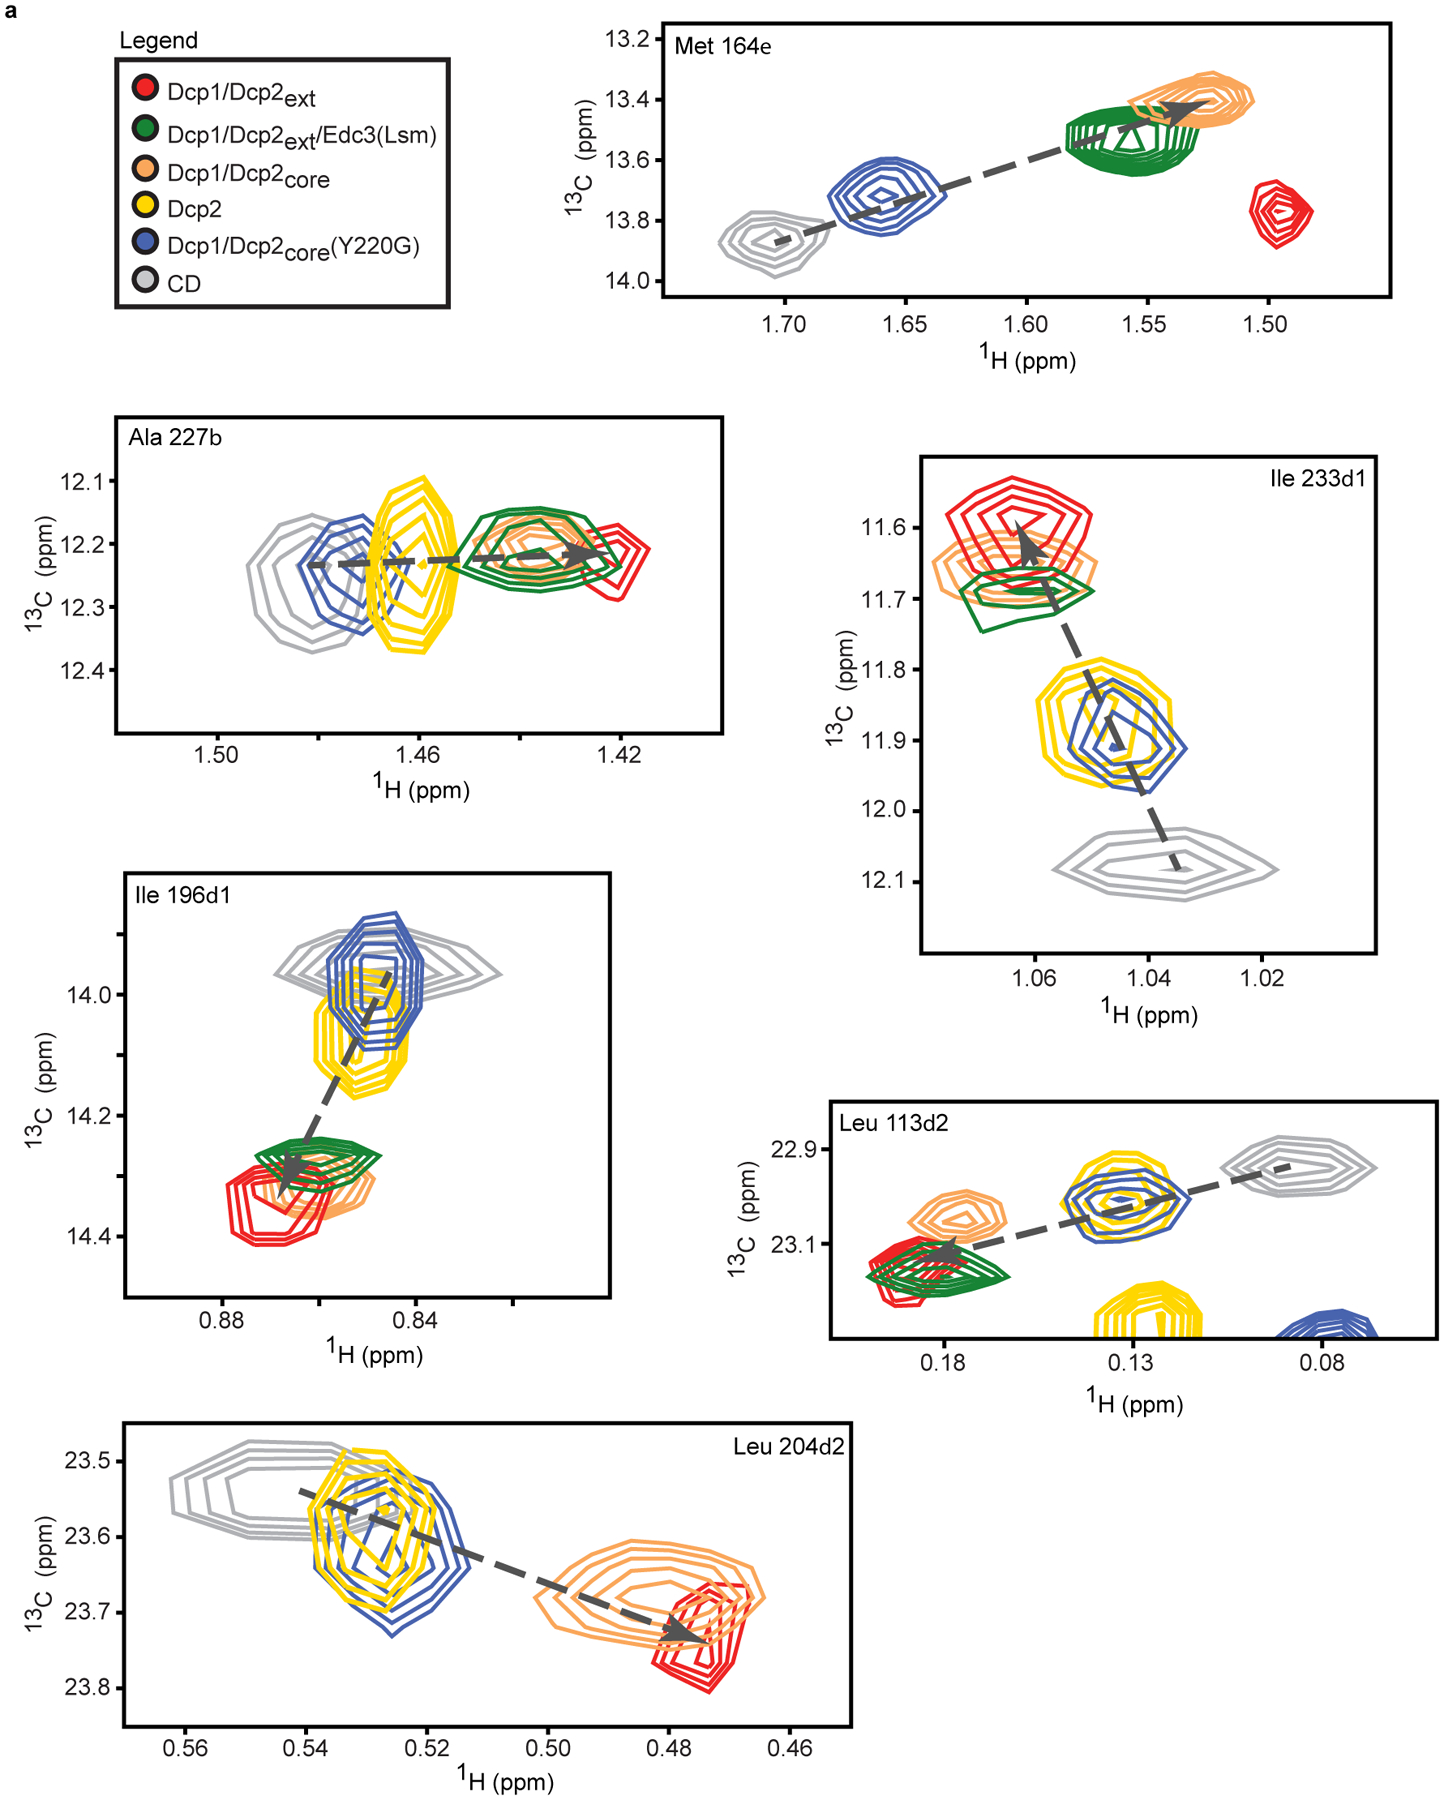
a, 1H/13C-methyl resonances in Dcp2 constructs predominantly fall along a linear trajectory (dotted line), indicative of fast interconversion between the inactive and precatalytic states on the NMR timescale. Resonances for Ala 227Cβ, Ile 223δ1, and Ile 196δ1 were used in addition to Ile 102δ1 (Fig. 5b) to calculate the relative population of the inactive state due to the observance of resonances for all constructs strictly lying along a linear trajectory.
Extended Data Fig. 5. Dcp1/Dcp2ext conformational equilibria is important for substrate recognition, liquid-like behavior, and proper regulation of decapping in condensates.
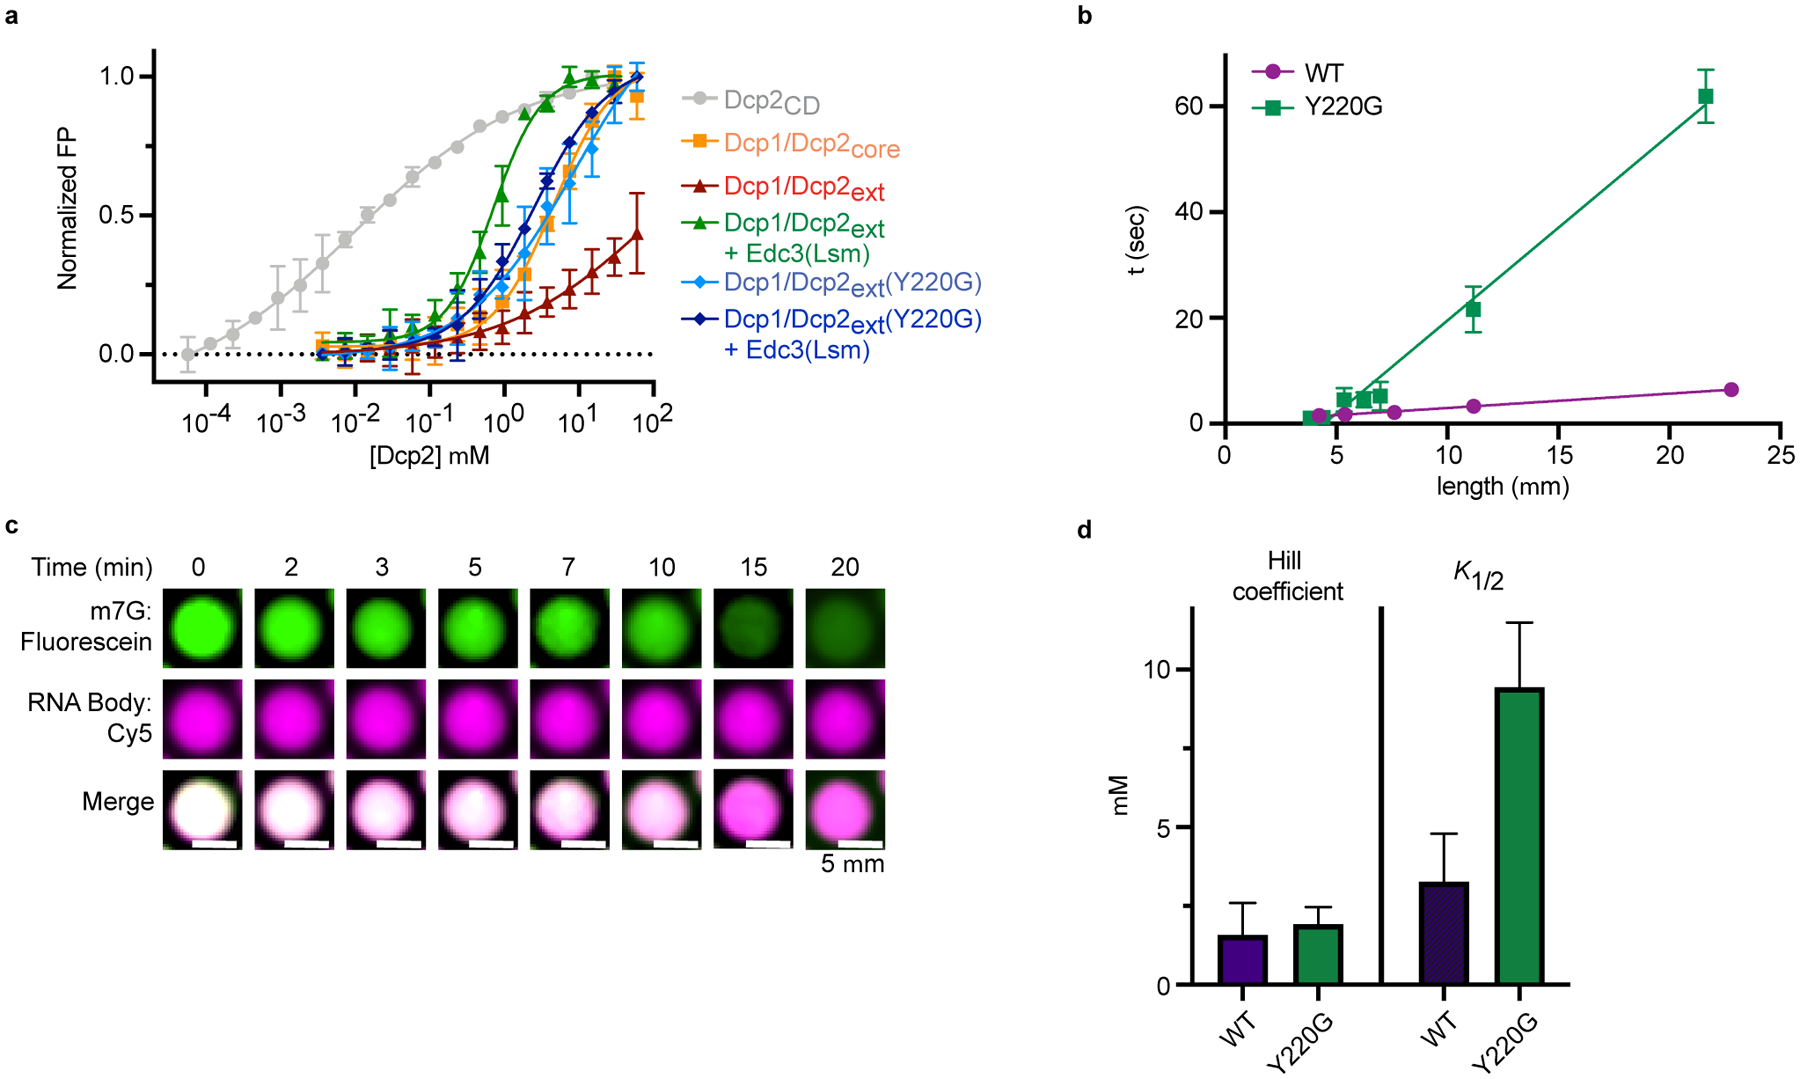
a, FP curves for various Dcp2 constructs binding to U30mer RNA. Data are normalized to the span between minimum and maximum mP values for each protein tested. Dcp1/Dcp2ext was normalized to span between its minimum and average maximum for all proteins tested. Data are presented as mean ± s.e.m. for three independent experiments and error bars are not show when smaller than the data point. b, Fusion of Dcp1/Dcp2ext(Y220G) condensates occurs slower than wild-type droplets of similar size. Time (τ) data presented are from fits of exponential decrease in droplet length following initial fusion event and error represents standard error of the fit and are not depicted when smaller than the data point. Representative micrographs are from three independent experiments with similar results. c, Decapping of dual-labeled RNA substrate by Dcp1/Dcp2ext(Y220G) by fluorescence microscopy. Representative micrographs are from twenty droplets collected over two independent experiments with similar results. d, The Y220G mutation does not affect the cooperativity of activation by Edc3 but increases the K1/2 of activation three-fold. Hill coefficients and K1/2 are presented as mean ± s.e.m. for experimental fits from two independent experiments shown in Fig. 5g.
Supplementary Material
Fusion of Y220G Dcp1/Dcp2ext liquid droplets. (Scale bar, 20 μm)
Fusion of wild-type Dcp1/Dcp2ext liquid droplets. (Scale bar, 20 μm)
ACKNOWLEDGEMENTS
We thank the Center for Advanced Light Microscopy at UCSF for guidance and technical assistance in collecting microscopy data. We also thank M. Warminski and A. Mlynarska-Cieslak (UW) for providing reagents for RNA labelling and M. Kelly for assistance through the UCSF NMR Facility. The authors thank C. Freund, A. Manglik, D. Brown, and members of the J.D.G. lab for experimental guidance and many helpful discussions. We extend thanks to G. Narlikar, S. Floor, and S. Sanulli for useful discussions in writing the manuscript. Use of the spinning disk confocal microscope is supported by the US National Institutes of Health (1S10OD017993-01A1). This work was supported by US National Institutes of Health (R01 GM078360 to J.D.G.), Foundation for Polish Science (TEAM/2016-2/13 to J.J.), National Science Centre, Poland (UMO-2018/31/B/ST5/03821 to J.K.), a Moritz-Heyman UCSF Discovery Fellowship (to R.W.T.), and an ARCS Foundation Fellowship (to R.W.T.).
Footnotes
COMPETING INTERESTS
The authors declare no competing interests.
MAIN TEXT REFERENCES
- 1.Banani SF et al. Compositional Control of Phase-Separated Cellular Bodies. Cell 166, 651–663 (2016). [DOI] [PMC free article] [PubMed] [Google Scholar]
- 2.Gallego LD et al. Phase separation directs ubiquitination of gene-body nucleosomes. Nature 579, 592–597 (2020). [DOI] [PMC free article] [PubMed] [Google Scholar]
- 3.Hnisz D, Shrinivas K, Young RA, Chakraborty AK & Sharp PA A Phase Separation Model for Transcriptional Control. Cell 169, 13–23 (2017). [DOI] [PMC free article] [PubMed] [Google Scholar]
- 4.Riback JA et al. Composition-dependent thermodynamics of intracellular phase separation. Nature 1–6 (2020) doi: 10.1038/s41586-020-2256-2. [DOI] [PMC free article] [PubMed] [Google Scholar]
- 5.Sheu-Gruttadauria J & MacRae IJ Phase Transitions in the Assembly and Function of Human miRISC. Cell 173, 946–957.e16 (2018). [DOI] [PMC free article] [PubMed] [Google Scholar]
- 6.Langdon EM et al. mRNA structure determines specificity of a polyQ-driven phase separation. Science 360, 922–927 (2018). [DOI] [PMC free article] [PubMed] [Google Scholar]
- 7.Kim TH et al. Phospho-dependent phase separation of FMRP and CAPRIN1 recapitulates regulation of translation and deadenylation. Science 365, 825–829 (2019). [DOI] [PubMed] [Google Scholar]
- 8.Hondele M et al. DEAD-box ATPases are global regulators of phase-separated organelles. Nature 573, 144–148 (2019). [DOI] [PMC free article] [PubMed] [Google Scholar]
- 9.Brady JP et al. Structural and hydrodynamic properties of an intrinsically disordered region of a germ cell-specific protein on phase separation. Proc. Natl. Acad. Sci 114, E8194–E8203 (2017). [DOI] [PMC free article] [PubMed] [Google Scholar]
- 10.Peeples W & Rosen MK Phase Separation Can Increase Enzyme Activity by Concentration and Molecular Organization. bioRxiv 2020.September.15.299115 (2020) doi: 10.1101/2020.09.15.299115. [DOI] [Google Scholar]
- 11.Banani SF, Lee HO, Hyman AA & Rosen MK Biomolecular condensates: organizers of cellular biochemistry. Nat. Rev. Mol. Cell Biol 18, 285–298 (2017). [DOI] [PMC free article] [PubMed] [Google Scholar]
- 12.Zhang Y, Narlikar GJ & Kutateladze TG Enzymatic Reactions inside Biological Condensates. J. Mol. Biol (2020) doi: 10.1016/j.jmb.2020.08.009. [DOI] [PMC free article] [PubMed] [Google Scholar]
- 13.Mitrea DM & Kriwacki RW Phase separation in biology; functional organization of a higher order. Cell Commun. Signal 14, 1 (2016). [DOI] [PMC free article] [PubMed] [Google Scholar]
- 14.Moore MJ From Birth to Death: The Complex Lives of Eukaryotic mRNAs. Science 309, 1514–1518 (2005). [DOI] [PubMed] [Google Scholar]
- 15.Hubstenberger A et al. P-Body Purification Reveals the Condensation of Repressed mRNA Regulons. Mol. Cell 68, 144–157.e5 (2017). [DOI] [PubMed] [Google Scholar]
- 16.Sheth U & Parker R Decapping and Decay of Messenger RNA Occur in Cytoplasmic Processing Bodies. Science 300, 805–808 (2003). [DOI] [PMC free article] [PubMed] [Google Scholar]
- 17.Luo Y, Na Z & Slavoff SA P-Bodies: Composition, Properties, and Functions. Biochemistry 57, 2424–2431 (2018). [DOI] [PMC free article] [PubMed] [Google Scholar]
- 18.Chan LY, Mugler CF, Heinrich S, Vallotton P & Weis K Non-invasive measurement of mRNA decay reveals translation initiation as the major determinant of mRNA stability. eLife 7, e32536 (2018). [DOI] [PMC free article] [PubMed] [Google Scholar]
- 19.Mugler CF et al. ATPase activity of the DEAD-box protein Dhh1 controls processing body formation. eLife 5, e18746 (2016). [DOI] [PMC free article] [PubMed] [Google Scholar]
- 20.Hutchins EJ, Piacentino ML & Bronner ME P-bodies are sites of rapid RNA decay during the neural crest epithelial—mesenchymal transition. bioRxiv 2020.July.31.231860 (2020) doi: 10.1101/2020.07.31.231860. [DOI] [Google Scholar]
- 21.Horvathova I et al. The Dynamics of mRNA Turnover Revealed by Single-Molecule Imaging in Single Cells. Mol. Cell 68, 615–625.e9 (2017). [DOI] [PubMed] [Google Scholar]
- 22.Tutucci E et al. An improved MS2 system for accurate reporting of the mRNA life cycle. Nat. Methods 15, 81–89 (2018). [DOI] [PMC free article] [PubMed] [Google Scholar]
- 23.Aizer A et al. Quantifying mRNA targeting to P-bodies in living human cells reveals their dual role in mRNA decay and storage. J. Cell Sci 127, 4443–4456 (2014). [DOI] [PubMed] [Google Scholar]
- 24.Brengues M, Teixeira D & Parker R Movement of Eukaryotic mRNAs Between Polysomes and Cytoplasmic Processing Bodies. Science 310, 486–489 (2005). [DOI] [PMC free article] [PubMed] [Google Scholar]
- 25.Wang C et al. Context-dependent deposition and regulation of mRNAs in P-bodies. eLife 7, e29815 (2018). [DOI] [PMC free article] [PubMed] [Google Scholar]
- 26.Pitchiaya S et al. Dynamic Recruitment of Single RNAs to Processing Bodies Depends on RNA Functionality. Mol. Cell 74, 521–533.e6 (2019). [DOI] [PMC free article] [PubMed] [Google Scholar]
- 27.Boeynaems S et al. Protein Phase Separation: A New Phase in Cell Biology. Trends Cell Biol. 28, 420–435 (2018). [DOI] [PMC free article] [PubMed] [Google Scholar]
- 28.Jonas S & Izaurralde E The role of disordered protein regions in the assembly of decapping complexes and RNP granules. Genes Dev. 27, 2628–2641 (2013). [DOI] [PMC free article] [PubMed] [Google Scholar]
- 29.Beelman CA et al. An essential component of the decapping enzyme required for normal rates of mRNA turnover. Nature 382, 642–646 (1996). [DOI] [PubMed] [Google Scholar]
- 30.Dunckley T & Parker R The DCP2 protein is required for mRNA decapping in Saccharomyces cerevisiae and contains a functional MutT motif. EMBO J. 18, 5411–5422 (1999). [DOI] [PMC free article] [PubMed] [Google Scholar]
- 31.Wang Z, Jiao X, Carr-Schmid A & Kiledjian M The hDcp2 protein is a mammalian mRNA decapping enzyme. Proc. Natl. Acad. Sci 99, 12663–12668 (2002). [DOI] [PMC free article] [PubMed] [Google Scholar]
- 32.Xing W, Muhlrad D, Parker R & Rosen MK A quantitative inventory of yeast P body proteins reveals principles of composition and specificity. eLife 9, e56525 (2020). [DOI] [PMC free article] [PubMed] [Google Scholar]
- 33.Fromm SA et al. In Vitro Reconstitution of a Cellular Phase-Transition Process that Involves the mRNA Decapping Machinery. Angew. Chem. Int. Ed 53, 7354–7359 (2014). [DOI] [PMC free article] [PubMed] [Google Scholar]
- 34.He F, Celik A, Wu C & Jacobson A General decapping activators target different subsets of inefficiently translated mRNAs. eLife 7, e34409 (2018). [DOI] [PMC free article] [PubMed] [Google Scholar]
- 35.He F & Jacobson A Control of mRNA decapping by positive and negative regulatory elements in the Dcp2 C-terminal domain. RNA 21, 1633–1647 (2015). [DOI] [PMC free article] [PubMed] [Google Scholar]
- 36.Paquette DR, Tibble RW, Daifuku TS & Gross JD Control of mRNA decapping by autoinhibition. Nucleic Acids Res. 46, 6318–6329 (2018). [DOI] [PMC free article] [PubMed] [Google Scholar]
- 37.Lobel JH, Tibble RW & Gross JD Pat1 activates late steps in mRNA decay by multiple mechanisms. Proc. Natl. Acad. Sci 116, 23512–23517 (2019). [DOI] [PMC free article] [PubMed] [Google Scholar]
- 38.Badis G, Saveanu C, Fromont-Racine M & Jacquier A Targeted mRNA Degradation by Deadenylation-Independent Decapping. Mol. Cell 15, 5–15 (2004). [DOI] [PubMed] [Google Scholar]
- 39.Fromm SA et al. The structural basis of Edc3- and Scd6-mediated activation of the Dcp1:Dcp2 mRNA decapping complex. EMBO J. 31, 279–290 (2012). [DOI] [PMC free article] [PubMed] [Google Scholar]
- 40.Harigaya Y, Jones BN, Muhlrad D, Gross JD & Parker R Identification and Analysis of the Interaction between Edc3 and Dcp2 in Saccharomyces cerevisiae. Mol. Cell. Biol 30, 1446–1456 (2010). [DOI] [PMC free article] [PubMed] [Google Scholar]
- 41.Damman R et al. Atomic-level insight into mRNA processing bodies by combining solid and solution-state NMR spectroscopy. Nat. Commun 10, 1–11 (2019). [DOI] [PMC free article] [PubMed] [Google Scholar]
- 42.Schütz S, Nöldeke ER & Sprangers R A synergistic network of interactions promotes the formation of in vitro processing bodies and protects mRNA against decapping. Nucleic Acids Res. 45, 6911–6922 (2017). [DOI] [PMC free article] [PubMed] [Google Scholar]
- 43.Wurm JP, Overbeck J & Sprangers R The S. pombe mRNA decapping complex recruits cofactors and an Edc1-like activator through a single dynamic surface. RNA 22, 1360–1372 (2016). [DOI] [PMC free article] [PubMed] [Google Scholar]
- 44.Mugridge JS, Coller J & Gross JD Structural and molecular mechanisms for the control of eukaryotic 5′–3′ mRNA decay. Nat. Struct. Mol. Biol 25, 1077–1085 (2018). [DOI] [PubMed] [Google Scholar]
- 45.Wurm JP, Holdermann I, Overbeck JH, Mayer PHO & Sprangers R Changes in conformational equilibria regulate the activity of the Dcp2 decapping enzyme. Proc. Natl. Acad. Sci 114, 6034–6039 (2017). [DOI] [PMC free article] [PubMed] [Google Scholar]
- 46.She M et al. Structural Basis of Dcp2 Recognition and Activation by Dcp1. Mol. Cell 29, 337–349 (2008). [DOI] [PMC free article] [PubMed] [Google Scholar]
- 47.Deshmukh MV et al. mRNA Decapping Is Promoted by an RNA-Binding Channel in Dcp2. Mol. Cell 29, 324–336 (2008). [DOI] [PubMed] [Google Scholar]
- 48.Mugridge JS, Tibble RW, Ziemniak M, Jemielity J & Gross JD Structure of the activated Edc1-Dcp1-Dcp2-Edc3 mRNA decapping complex with substrate analog poised for catalysis. Nat. Commun 9, 1–10 (2018). [DOI] [PMC free article] [PubMed] [Google Scholar]
- 49.Floor SN, Borja MS & Gross JD Interdomain dynamics and coactivation of the mRNA decapping enzyme Dcp2 are mediated by a gatekeeper tryptophan. Proc. Natl. Acad. Sci 109, 2872–2877 (2012). [DOI] [PMC free article] [PubMed] [Google Scholar]
- 50.Chen I, Dorr BM & Liu DR A general strategy for the evolution of bond-forming enzymes using yeast display. Proc. Natl. Acad. Sci 108, 11399–11404 (2011). [DOI] [PMC free article] [PubMed] [Google Scholar]
- 51.Keenen MM, Larson AG & Narlikar GJ Chapter Three - Visualization and Quantitation of Phase-Separated Droplet Formation by Human HP1α. in Methods in Enzymology (ed. Rhoades E) vol. 611 51–66 (Academic Press, 2018). [DOI] [PMC free article] [PubMed] [Google Scholar]
- 52.Schindelin J et al. Fiji: an open-source platform for biological-image analysis. Nat. Methods 9, 676–682 (2012). [DOI] [PMC free article] [PubMed] [Google Scholar]
- 53.Phair RD et al. Global Nature of Dynamic Protein-Chromatin Interactions In Vivo: Three-Dimensional Genome Scanning and Dynamic Interactions Networks of Chromatin Proteins. Mol. Cell. Biol 24, 6393–6402 (2004). [DOI] [PMC free article] [PubMed] [Google Scholar]
- 54.Kowalska J, Osowniak A, Zuberek J & Jemielity J Synthesis of nucleoside phosphosulfates. Bioorg. Med. Chem. Lett 22, 3661–3664 (2012). [DOI] [PubMed] [Google Scholar]
- 55.Warminski M et al. Amino-Functionalized 5′ Cap Analogs as Tools for Site-Specific Sequence-Independent Labeling of mRNA. Bioconjug. Chem 28, 1978–1992 (2017). [DOI] [PubMed] [Google Scholar]
- 56.Jones BN, Quang-Dang D-U, Oku Y & Gross JD Chapter 2 A Kinetic Assay to Monitor RNA Decapping Under Single- Turnover Conditions. in Methods in Enzymology vol. 448 23–40 (Academic Press, 2008). [DOI] [PubMed] [Google Scholar]
- 57.Refaei MA et al. Observing selected domains in multi-domain proteins via sortase-mediated ligation and NMR spectroscopy. J. Biomol. NMR 49, 3–7 (2011). [DOI] [PMC free article] [PubMed] [Google Scholar]
- 58.Lee W, Tonelli M & Markley JL NMRFAM-SPARKY: enhanced software for biomolecular NMR spectroscopy. Bioinformatics 31, 1325–1327 (2015). [DOI] [PMC free article] [PubMed] [Google Scholar]
- 59.Brangwynne CP, Mitchison TJ & Hyman AA Active liquid-like behavior of nucleoli determines their size and shape in Xenopus laevis oocytes. Proc. Natl. Acad. Sci 108, 4334–4339 (2011). [DOI] [PMC free article] [PubMed] [Google Scholar]
Associated Data
This section collects any data citations, data availability statements, or supplementary materials included in this article.
Supplementary Materials
Fusion of Y220G Dcp1/Dcp2ext liquid droplets. (Scale bar, 20 μm)
Fusion of wild-type Dcp1/Dcp2ext liquid droplets. (Scale bar, 20 μm)
Data Availability Statement
The data supporting the findings of this study are presented within the paper and its supplementary information. Source data of uncropped gels are provided with this paper.


