

Abstract
Management of vestibular dysfunction may include treatment with medications that are thought to act to suppress vestibular function and reduce or eliminate abnormal sensitivity to head motions. The extent to which vestibular medications act centrally or peripherally is still debated. In this study, two commonly prescribed medications, meclizine and diazepam, and a candidate for future clinical use, JNJ7777120, were evaluated for their effects on short latency compound action potentials generated by the peripheral vestibular system and corresponding central neural relays (i.e., vestibular sensory-evoked potentials, VsEPs). The effects of the selected drugs developed slowly over the course of two hours in the mouse. Findings indicate that meclizine (600 mg/kg) and diazepam (> 60 mg/kg) can act on peripheral elements of the vestibular maculae whereas diazepam also acts most effectively on central gravity receptor circuits to exert its suppressive effects. The novel pharmacological agent JNJ7777120 (160 mg/kg) acts in the vestibular periphery to enhance macular responses to transient stimuli (VsEPs) while, hypothetically, suppressing macular responses to sustained or slowly changing stimuli.
Keywords: VsEP, Vestibular medications, Level of action, Macular vestibular pathway, Brain temperature
INTRODUCTION
Vestibular symptoms are generally caused by an asymmetrical functional deficit in the vestibular end organs. The impairment in the vestibular periphery alters neuronal signal transmission resulting in vestibular symptoms including poor compensatory eye movements, postural imbalance, dizziness, and vertigo often accompanied by nausea and vomiting in humans. In order to reduce the functional imbalance and improve the symptoms of vestibular dysfunction, the use of pharmacological agents is often the preferred approach.
Signaling in the vestibular neuroepithelium is mediated or modulated by a diverse number of neuroactive substances such as glutamate, acetylcholine (Ach), histamine, γ-amino butyric acid (GABA), calcitonin gene-related protein (CGRP), and others (reviewed by Lee and Jones 2017). These neurotransmitters and modulators bind to specific receptors at the postsynaptic and/or presynaptic membranes during the processing of sensory information. Vestibular medications are thought to suppress transmission of vestibular signals traveling in vestibular pathways by altering neurotransmitter action (e.g., Baloh and Kerber 2011; Lacour and Sterkers 2001). In the present work, two commonly prescribed medications, meclizine and diazepam, and a candidate for future clinical use, JNJ7777120, were examined for their effects on vestibular function.
Antihistamines including meclizine are the most commonly used vestibular suppressants for the treatment of vertigo and motion sickness (Baloh and Kerber 2011; Skidgel et al. 2011). Histamine and its four receptors (H1–H4) have been identified in the vestibular sensory pathway including the vestibular hair cells, peripheral afferents, and central relay nuclei (Housley et al. 1988; Tomoda et al. 1997; Desmadryl et al. 2012; Tritto et al. 2009; Schwartz et al. 1990; Zhang et al. 2008). Meclizine, a piperazine antihistamine, acts primarily at Gq/11-protein-coupled H1 receptors and to some extent at muscarinic acetylcholine receptors as an antagonist (e.g., Baloh and Kerber 2011; Skidgel et al. 2011). Meclizine action on H1 receptors prevents activation of phospholipase C and downstream signal transduction pathways including diacylglycerol (DAG) and inositol triphosphate (IP3), second messengers, which in turn prevent cytosolic increases in Ca2+ concentration (reviewed by Haas et al. 2008; Hill 1990). Effects of meclizine may be seen in both peripheral and central portions of the vestibular system.
Although the histamine H4 receptor has been shown to be involved in various inflammatory conditions (see reviews by Kiss and Keseru 2012, 2014), new evidence on H4 receptor involvement in the vestibular system has been reported. JNJ7777120 acts at Gi/o-protein-coupled H4 receptors and modulates the cellular second messenger cyclic AMP (e.g., Skidgel et al. 2011). Chabbert and colleagues have shown that H4 antagonists, e.g., JNJ7777120, inhibit vestibular neuron excitability in rat vestibular primary afferent neurons (Desmadryl et al. 2012; Wersinger et al. 2013). Thus, selective H4 receptor antagonists, such as JNJ7777120, are novel pharmacological agents that may be useful in suppressing vestibular activity in the peripheral vestibular system for therapeutic treatment.
Benzodiazepines are used clinically to alleviate dizziness and vertigo-related symptoms and to treat anxiety disorders, insomnia, and convulsions (Baloh and Kerber 2011; Mehdi 2012; Mihic and Harris 2011). Diazepam is the most widely used benzodiazepine and is a positive allosteric modulator of the GABAA receptors (Mihic and Harris 2011). Diazepam indirectly enhances binding affinity of gamma-aminobutyric acid (GABA) to ligand-gated GABAA receptors to exert its pharmacological effects. GABA is thought to be co-released with acetylcholine (ACh) by efferent neurons in the inner ear (Bobbin et al. 1985; Holt et al. 2011) and to bind to the β subunit of GABAA receptors. Binding increases Cl− conductance, thus hyperpolarizing the membrane potential and inhibiting activity (e.g., Simmons 2012). Although the possibility of GABA neurotransmission in the vestibular periphery has been widely investigated (e.g., Ehrenberger 1982; Kitahara et al. 1994; Foster et al. 1995; Meza 2008), a complete understanding of the function of GABA receptors in the vestibular periphery is still lacking. On the other hand, the well-known potent inhibitory effects on the central vestibular nuclei arising from commissural fibers and the cerebellum are mediated by GABAA receptors (Highstein and Hostein 2006; Matsuoka et al. 1985; Pettorossi 1982). Since GABAA receptors are abundant in the brainstem vestibular nuclei, one expects that diazepam acts on central portions of the vestibular system.
The purpose of the present work was to test the hypothesis that meclizine, diazepam, and JNJ7777120 alter vestibular responses to head motion. We used vestibular sensory evoked potentials (VsEPs) to evaluate vestibular function, where VsEP response parameters (thresholds, amplitude and latencies) provided the basis to identify and distinguish peripheral versus central altered function. Although vestibular medications are important options for treating vestibular disorders, it is currently uncertain whether these pharmacologic agents act on the vestibular system centrally, peripherally or both. Thus, one specific aim of the present study was to determine the site or sites of action for these drugs as measured using VsEPs. The current work was also undertaken to resolve the time course of action for meclizine, diazepam, and JNJ7777120 in the mouse model. Based on the VsEP, the results indicate that JNJ7777120 and meclizine act in the periphery to alter macular responses to transient vestibular stimulation, whereas diazepam acts both peripherally and in central brainstem vestibular circuits to alter vestibular responses. These findings contribute to our knowledge of drug actions on signal transmission in neurons and synapses of the peripheral and central macular vestibular pathways in the mouse mammalian model.
METHODS
All experimental procedures were approved by the institutional animal care and use committee (IACUC) at University of Nebraska-Lincoln and undertaken in accordance with NIH guidelines. One hundred twenty-three (meclizine, n = 38; diazepam, n = 52; JNJ7777120, n = 33) C57BL/6 mice (8–12 weeks old, female) were obtained from the Jackson laboratory and used for the experiments. Animal preparation has been previously detailed (Lee and Jones 2018) and here briefly described. The animals were anesthetized with ketamine/xylazine (90:10 mg/kg) or urethane/xylazine (1.2:0.02 g/kg), injected intraperitoneally (0.1 ml volume for 20 g animal). Maintenance doses of 0.05 ml of anesthetic were administered as needed. A heating lamp and pad were used to maintain stable rectal temperature at 37.0 ± 0.2 °C and brain temperature at 36.0 ± 0.2 °C. In diazepam and JNJ7777120 studies after induction of anesthesia, a thermocouple wire was surgically implanted for recording and controlling brain temperatures. Respiratory room air was supplemented with an oxygen rich mixture (50% N2, balance O2 or 4% CO2, 39.5% N2, balance O2) and presented using a customized open air-coupled nose cone. Arterial oxygen-hemoglobin saturation (SaO2) was estimated using a pulse oximeter (SpO2 in %; model CANL-425SV-A, Med Associates, St Albans, VT). Electrocardiographic (ECG) activity was measured on an oscilloscope and heart rate monitored (beats per minute, bpm). Respiratory rate was assessed by counting the number of thoracic inspiratory movements (inspirations per minute, ipm) and documented throughout drug administration. Animals demonstrating a poor physiological condition during baseline testing were excluded from the study.
Drug/Vehicle Preparation
Meclizine, diazepam, and JNJ7777120 were obtained from MP Biomedicals LLC (Santa Ana, CA), Pharmacy Specialty Services (Lincoln, NE) and Selleck Chemicals (Houston, TX), respectively. Vehicle solutions used in the present study were as follows: meclizine was dissolved with 10% Kolliphor EL (Sigma-Aldrich, St. Louis, MO). Standard solution of diazepam was diluted with 1.4% benzyl alcohol, 38.5% propylene glycol, 12.7% ethyl alcohol, and 48% water (“BPEW”; Pharmacy Specialty Services, Lincoln, NE). JNJ7777120 was dissolved in dimethyl sulfoxide (100% DMSO; Fisher Science, Pittsburgh, PA).
Dose Regimen
Evaluation of each drug consisted of two protocols: (1) progressive multiple dose (PMD) and (2) single dose (SD). All injections were made intraperitoneally. The PMD protocol was undertaken in order to identify a useful dose causing a significant change in vestibular function. From the results of the multiple dose protocol, an effective dose range (e.g., estimated effective cumulative dose) for each drug was determined and used in the SD protocol. Cumulative doses over time were estimated by assuming complete absorption and half-life values of 360 min for meclizine (e.g., Plumb 2008), 462 min for diazepam (e.g., Greenblatt and Divoll 1982), and 60 min for JNJ7777120 (e.g., Thurmond et al. 2004) using the equation: Dt = dose (e−kt), where k is the elimination constant (0.69315/half-life (in minutes), dose in mg/kg, and t in minutes). In the multiple dose protocol, mice received 4 incremental doses of drug or vehicle administration (meclizine: 100, 200, 400, and 800 mg/kg; diazepam: 6, 12, 24, and 48 mg/kg; JNJ7777120: 20, 40, 80, and 160 mg/kg), where the dose was doubled with each successive administration separated by 20 min. Injection volume increased accordingly for both the drug and vehicle series with a maximum volume of 1.5 ml. In the SD protocol, the estimated effective dose of each drug obtained from the PMD protocol was given to the drug-treated group in order to characterize the time course of drug effects on the VsEP. The same volume of vehicle was given to the vehicle control group. VsEPs were recorded over a period of up to 120 min following the single dose of drug or vehicle. Figure 1 summarizes conditions that apply to each of the three drug studies including anesthetic, vehicle, and temperature control.
Fig. 1.

A summary of conditions for anesthesia, vehicle controls, and temperature maintenance for the three drugs studied (meclizine, diazepam, and JNJ7777120). Two mixtures of anesthetics were used: ketamine/xylazine (“ketamine”) and urethane/xylazine (“urethane”). There were three vehicles used: kolliphor (10%) for meclizine, BPEW (1.4% benzyl alcohol, 12.7% ethyl alcohol, 38.5% propylene and 48% water) for diazepam, and DMSO (100%) for JNJ7777120. Rectal temperature (“Rectal”) was controlled in all studies (37.0 ± 0.2 °C). Brain (36.0 ± 0.2 °C) and rectal temperatures (Brain + Rectal) were controlled in one diazepam study (“b. Brain + Rectal”) as well as the JNJ7777120 study. There were two diazepam studies. One under ketamine anesthesia (“a. ketamine”) where only rectal temperature was controlled (“a. Rectal”). The second was done under urethane anesthesia (“b. urethane”), where both brain and rectal temperatures were controlled (“b. Brain + Rectal”)
Vestibular Sensory-Evoked Potentials
The VsEP recording setup employed here has been described in detail elsewhere (Jones et al. 2015; Lee and Jones 2018). Three subcutaneous electrodes were placed over the nuchal crest on the midline (G1), below and behind the right pinna (G2), and on the ventral hip (Ground). The animal’s head was coupled to a mechanical shaker and platform with a non-invasive head clip. Linear acceleration stimuli (2 ms rectangular jerks in the naso-occipital axis) were applied to the animal’s head at a rate of 17/s. To determine VsEP response threshold, stimulus amplitude was varied in 3 dB steps from − 18 to + 6 dBre: 1.0 g/ms (where 1.0 g = 9.8 m/s2). Electrophysiological response signals were recorded from the skull surface (200,000× amplification; half amplitude frequency cutoffs 0.3 and 3 kHz). Responses were collected for both normal (upward) and inverted (downward) motion polarities and the resulting 256 primary surface electrical response waveforms were averaged to produce the final VsEP response. A broadband (50–50,000 Hz) binaural forward acoustic masker (92 dBSPL) was presented during VsEP recordings (Jones and Jones 1999).
The linear VsEP response is elicited by a brief linear translation of the head as noted above and is recorded from the surface of the skull. The response is composed of a series of positive and negative peaks that occur within approximately 5 ms following the onset of the stimulus. Three response peaks (P1, N1, P2) were scored and analyzed in the present study. P1 and N1 response peaks represent activity in the peripheral vestibular nerve innervating otoconial organs (“peripheral peaks”; Jones et al. 1999, 2004; Nazareth and Jones 1998). P2 response peak reflects the activity of central vestibular relays within the brainstem (“central peak”; Jones 1992; Nazareth and Jones 1998). VsEP latencies provide information about timing of transduction, synaptic transmission, and neural activation beginning in the peripheral neuroepithelium of otoconial organs and continuing through central vestibular relays. VsEP amplitudes provide quantitative information regarding the number of neurons activated synchronously in response to the transient stimulus. VsEP threshold represents the general sensitivity of vestibular macular sensors to transient linear acceleration of the head.
VsEPs were recorded before and after each dose at a stimulus level of + 6 dB re: 1.0 g/ms at 5-min intervals, and results were summarized as mean values for each 20-min period over time for up to 120 min post-drug. A 20-min period of stable baseline was recorded (5 min intervals) before initial drug treatment. VsEP thresholds were measured at approximately 20-min intervals immediately prior to each subsequent drug administration in the case of multiple doses.
Data Analysis and Statistics
VsEP response parameters (latency, amplitude, and threshold) were normalized by subtracting the mean baseline values obtained before drug or vehicle administration from the value measured after the drug or vehicle administration (normalized data = post-dose value minus pre-dose mean baseline value). Normalized data were statistically analyzed over a period of 80 to 120 min following a 20-min stable pre-dose/baseline period. Repeated-measures multivariate analysis of variance (rmMANOVA) and repeated-measures analysis of variance (rmANOVA) were used for evaluating response parameters at multiple trials within and between treatment groups. Post hoc comparisons were made using Bonferroni or Dunnett procedures as noted. The linear regression slope was also used to evaluate the relationships between response parameters and time. Response parameters of the VsEP were evaluated between control and fixed factor treatment groups. Descriptive statistics were expressed as mean ± standard deviation (n = sample size) unless otherwise stated. A p value less than 0.05 was considered significant. All statistical analyses were performed using SPSS (version 22.0, SPSS Inc., Chicago, IL) and SigmaPlot (version 12.5, Systat Software Inc., San Jose, CA).
RESULTS
The effects of meclizine, diazepam, and JNJ7777120 on the VsEP were tested as well as the separate effects of their corresponding vehicle control solutions of 10% Kolliphor EL, BPEW and 100% DMSO, respectively. Figure 2 illustrates representative waveforms from mice treated with drug (meclizine (Fig. 2a), diazepam (Fig. 2b), or JNJ7777120 (Fig. 2c)) or vehicle alone during the administration of PMDs. From Fig. 2 one can see that none of these drugs produced profound changes in the VsEP. However, on close quantitative evaluation there were consistent systematic changes, some of which can be seen in Fig. 2. One can appreciate the absence of systematic change in vehicle groups whereas modest systematic shifts in latencies and amplitudes can be discerned in waveforms obtained during drug treatment. These changes are detailed in subsequent sections devoted to each drug.
Fig. 2.

VsEP traces for representative mice receiving multiple increasing doses of drugs (4 ea.) at approximately 20-min intervals (PD1 = 20 min. after dose 1, PD2 = 20 min. after dose 2, PD3 = 20 min. after dose 3, PD4 = 20 min. after dose 4). Left column, drug + vehicle: a meclizine + 10% kolliphor EL; b diazepam + 1.4% benzyl alcohol, 12.7% ethyl alcohol, 38.5% propylene and 48% water, “BPEW”; c JNJ7777120 + DMSO. Right column, vehicle alone: a 10% kolliphor EL; b BPEW; c 100% DMSO treatments in the progressive multiple dose (PMD) protocols. The VsEP traces at “Baseline” were recorded immediately before the first drug dose or vehicle. Traces at “PD1” were taken approximately 20 min after the first drug dose or vehicle injection. Successive doses and trace recordings are indicated. VsEPs were recorded using a stimulus level of + 6 dB re: 1.0 g/ms. Brain temperature was maintained at 36.0 ± 0.2º in diazepam (b) and JNJ7777120 (c) studies, but not controlled in meclizine study (a). The vertical dashed lines represent the mean latencies of P1 and P2 during the 20-min pre-dose baseline. Rectal temperature was held at 37.0 ± 0.2 °C in all studies
Meclizine
Since there have been no reports examining the effects on the VsEP of systemic administration of the vehicle used for meclizine studies (10% Kolliphor EL), three groups were studied in the PMD protocol for meclizine as follows: (1) a drug treatment group (meclizine + 10% Kolliphor EL), (2) a sham (i.e., vehicle) group (10% Kolliphor EL alone), and (3) a control group without intervention other than anesthesia. All three treatment groups were evaluated at the same time points pre- and post-drug administration. Vehicle-treated (n = 6) and control mice (n = 7) of the meclizine study had stable VsEP response parameters over time (latencies, amplitudes, and thresholds, Table 1). There were no significant differences in VsEP response parameters between control and vehicle groups. In addition, linear regression slopes obtained from individual animals over time of vehicle-treated and control groups did not differ significantly between groups for VsEP response parameters. For this reason, the sham-treated (vehicle) and control (no intervention) groups were combined into a single control group (no drug group, n = 13), the results from this combined control group were compared with those of the meclizine treated group in the PMD protocol (n = 9).
Table 1.
VsEP response parameters in meclizine and 10% kolliphor vehicle progressive multiple dose (PMD) protocol. VsEP latencies (µs) and amplitudes (µV) at + 6 dB re: 1.0 g/ms as well as thresholds were recorded over a period of 80 min following a 20-min stable baseline period. Drug-treated (meclizine (n = 9) and vehicle-treated (10% kolliphor (n = 6)) as well as a control group (no drug or vehicle, n = 7) were included. Each time period (20 min) was characterized by averaging 4 to 5 consecutive 5-min measurements following each successive dose of meclizine (post dose 1 “PD1”: 100 mg/kg; post dose 2 “PD2”: 200 mg/kg; post dose 3 “PD3”: 400 mg/kg; post dose4 “PD4”: 800 mg/kg) or 10% kolliphor vehicle. Data reflect mean ± standard deviation. All animals were anesthetized with ketamine/xylazine and rectal temperatures controlled at 37.0 ± 0.2 °C. Sample size remained constant over entire experiment
| VsEP parameters | Groups | Baseline | PD1 (1–20 min) | PD2 (21–40 min) | PD3 (41–60 min) | PD4 (61–80 min) | |
|---|---|---|---|---|---|---|---|
| Latency (µs) | P1 | Meclizine | 1381 ± 76 | 1364 ± 73 | 1368 ± 61 | 1380 ± 50 | 1386 ± 38 |
| 10% Kolliphor | 1439 ± 55 | 1443 ± 77 | 1462 ± 64 | 1450 ± 55 | 1449 ± 62 | ||
| Control | 1462 ± 66 | 1459 ± 62 | 1444 ± 58 | 1444 ± 66 | 1442 ± 77 | ||
| N1 | Meclizine | 1683 ± 75 | 1666 ± 83 | 1663 ± 69 | 1679 ± 54 | 1687 ± 47 | |
| 10% Kolliphor | 1779 ± 92 | 1790 ± 96 | 1796 ± 81 | 1790 ± 66 | 1778 ± 61 | ||
| Control | 1783 ± 81 | 1773 ± 80 | 1759 ± 81 | 1750 ± 80 | 1754 ± 90 | ||
| P2 | Meclizine | 2115 ± 75 | 2105 ± 69 | 2105 ± 63 | 2132 ± 49 | 2145 ± 41 | |
| 10% Kolliphor | 2171 ± 122 | 2163 ± 129 | 2198 ± 107 | 2200 ± 120 | 2179 ± 109 | ||
| Control | 2222 ± 68 | 2216 ± 67 | 2202 ± 56 | 2211 ± 64 | 2204 ± 62 | ||
| Amplitude (µV) | P1-N1 | Meclizine | 1.13 ± 0.22 | 1.13 ± 0.22 | 1.09 ± 0.22 | 1.07 ± 0.20 | 1.05 ± 0.17 |
| 10% Kolliphor | 0.91 ± 0.31 | 0.92 ± 0.28 | 0.84 ± 0.29 | 0.81 ± 0.30 | 0.88 ± 0.32 | ||
| Control | 0.83 ± 0.23 | 0.87 ± 0.25 | 0.85 ± 0.28 | 0.84 ± 0.21 | 0.84 ± 0.16 | ||
| P2-N1 | Meclizine | 0.96 ± 0.30 | 1.06 ± 0.31 | 0.98 ± 0.28 | 1.05 ± 0.24 | 0.91 ± 0.19 | |
| 10% Kolliphor | 0.91 ± 0.30 | 0.87 ± 0.35 | 0.90 ± 0.36 | 0.90 ± 0.42 | 0.95 ± 0.30 | ||
| Control | 0.88 ± 0.17 | 0.87 ± 0.23 | 0.87 ± 0.26 | 0.90 ± 0.25 | 0.90 ± 0.23 | ||
| Threshold (dB re: 1.0 g/ms) | Meclizine | − 12.2 ± 1.6 | − 10.8 ± 1.8 | − 9.2 ± 1.6 | − 8.8 ± 1.6 | − 8.9 ± 1.6 | |
| 10% Kolliphor | − 12.5 ± 1.6 | − 12.0 ± 1.6 | − 11.5 ± 1.6 | − 12.0 ± 1.6 | − 11.0 ± 1.2 | ||
| Control | − 10.5 ± 0.0 | − 10.1 ± 1.1 | − 10.5 ± 1.7 | − 10.5 ± 1.7 | − 11.0 ± 1.2 | ||
Despite the administration over time of multiple progressively increasing doses of meclizine (100, 200, 400, and 800 mg/kg), VsEP latencies and amplitudes remained relatively stable (Table 1). There were no significant differences in VsEP latencies and amplitudes between meclizine-treated and combined control group. On the other hand, this dose regimen of meclizine altered VsEP thresholds (Fig. 3, Table 1; rmANOVA F(3,60) = 8.263, p = 1.1 × 10⁻⁴). VsEP thresholds increased gradually and modestly following meclizine administration (maximum mean change = + 3.3 ± 1.8 (n = 9) dB re: 1.0 g/ms, Table 1, PD4: at 80 min) and became significantly higher than baseline 20 min following the third dose (PD3: 60 min after baseline; estimated cumulative dose: ~ 666 mg/kg; post hoc Bonferroni p = 0.009). Based on these findings, the effective dose of meclizine was taken to be 600 mg/kg and this dose was used for determining the time course of drug effects in the single dose protocol. During the VsEP measurements in the PMD protocol, physiological parameters including SpO2, heart, and respiratory rates were in normal range and stable, indicating that meclizine effects were not associated with altered systemic physiology (Table 2).
Fig. 3.
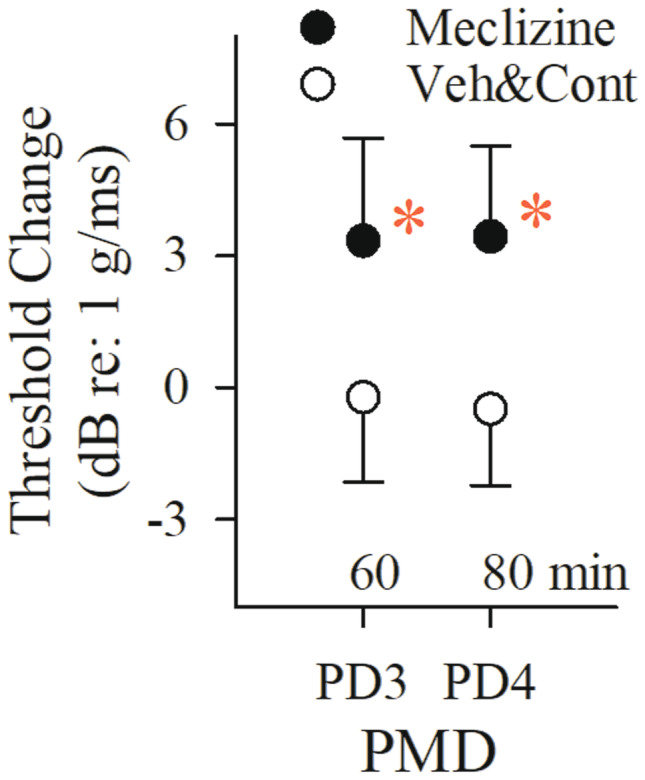
Effects of multiple doses of meclizine on the VsEP. Normalized VsEP thresholds of animals receiving meclizine (filled circles, n = 9) became elevated compared to the combined vehicle (10% kolliphor, n = 6) and control (no drug or vehicle, n = 7) treatment group (“Veh&Cont,” open symbols, n = 13) following PD3 (rmANOVA; F(1,20) = 9.405, p = 0.006; post hoc Bonferroni p = 0.009; estimated cumulative dose: 666 mg/kg). Progressive multiple dose (PMD) schedule was PD1 = 100, PD2 = 200, PD3 = 400, PD4 = 800 mg/kg. Each post dose time (e.g., PD3, PD4 shown here) represents 20 min after the indicated dose. Data reflect mean ± SD. Actual mean baseline values (B, normalized here as “0”) as well as all other time periods for VsEP response parameters are presented in Table 1. A statistically significant drug effect on VsEP threshold was observed following PD3 in the meclizine treatment group (*p < 0.05). Rectal temperature was monitored and controlled (37.0 ± 0.2 °C), but brain temperature was not monitored here
Table 2.
Meclizine: systemic physiological parameters of SpO2 (%), heart rate (bpm), and respiration rate (ipm) in meclizine, 10% kolliphor vehicle, and control treatment groups of the progressive multiple dose (PMD) protocol. Three physiologic parameters were monitored and recorded at 20-min intervals following each successive dose of meclizine (post dose 1 “PD1”: 100 mg/kg; post dose 2 “PD2”: 200 mg/kg; post dose 3 “PD3”: 400 mg/kg; post dose4 “PD4”: 800 mg/kg), 10% kolliphor vehicle or no intervention “Control.” Data reflect mean ± standard deviation. Parameters for single dose protocol (SD, 600 mg/kg) are shown below PMD data. All animals were anesthetized with ketamine/xylazine and rectal temperatures controlled at 37.0 ± 0.2 °C. Sample size is shown in parentheses
| PMD parameters | Groups | Baseline | PD1 (1–20 min) | PD2 (21–40 min) | PD3 (41–60 min) | PD4 (61–80 min) |
|---|---|---|---|---|---|---|
| SpO2 (%) | Meclizine (9) | 86.4 ± 4.0 | 86.8 ± 4.6 | 84.4 ± 3.8 | 81.7 ± 2.7 | 79.2 ± 1.5 |
| 10% Kolliphor (6) | 87.7 ± 2.2 | 87.9 ± 3.8 | 85.8 ± 4.1 | 86.4 ± 4.7 | 83.6 ± 3.7 | |
| Control (7) | 60.0 ± 9.6 | 85.5 ± 3.8 | 82.1 ± 2.7 | 81.3 ± 5.0 | 79.6 ± 5.4 | |
| Heart rate (bpm) | Meclizine (9) | 285.2 ± 24.9 | 293.2 ± 24.4 | 297.2 ± 26.5 | 298.3 ± 24.8 | 304.5 ± 12.3 |
| 10% Kolliphor (6) | 264.0 ± 23.9 | 257.5 ± 24.4 | 257.1 ± 26.8 | 260.0 ± 25.0 | 264.9 ± 21.5 | |
| Control (7) | 283.6 ± 24.5 | 310.2 ± 40.8 | 307.3 ± 31.1 | 294.2 ± 31.2 | 297.7 ± 37.1 | |
| Respiration rate (ipm) | Meclizine (6) | 172.1 ± 6.3 | 172.2 ± 6.3 | 172.0 ± 7.6 | 174.0 ± 8.5 | 165.6 ± 8.3 |
| 10% Kolliphor (6) | 171.1 ± 10.9 | 170.1 ± 11.3 | 169.8 ± 10.0 | 168.0 ± 8.7 | 167.9 ± 8.2 | |
| Control (2) | 136.5 ± 38.2 | 148.8 ± 27.2 | 151.9 ± 33.4 | 157.1 ± 19.6 | 156.0 ± 20.2 |
| SD parameters | Groups | Baseline | 1–20 min | 21–40 min | 41–60 min | 61–80 min |
|---|---|---|---|---|---|---|
| SpO2 (%) | Meclizine (10) | 86.1 ± 2.7 | 84.6 ± 1.4 | 83.5 ± 2.4 | 81.4 ± 3.0 | 80.7 ± 1.5 |
| 10% Kolliphor (6) | 84.9 ± 1.8 | 83.1 ± 2.6 | 81.7 ± 2.2 | 81.4 ± 1.8 | 82.3 ± 3.4 | |
| Heart rate (bpm) | Meclizine (10) | 282.3 ± 17.5 | 291.3 ± 17.8 | 293.2 ± 18.4 | 295.7 ± 19.7 | 296.2 ± 18.9 |
| 10% Kolliphor (6) | 275.6 ± 24.3 | 283.2 ± 25.1 | 284.5 ± 25.5 | 286.5 ± 33.0 | 291.0 ± 35.6 | |
| Respiration rate (ipm) | Meclizine (10) | 164.9 ± 4.7 | 169.1 ± 5.4 | 169.7 ± 4.9 | 167.3 ± 9.0 | 168.2 ± 9.4 |
| 10% Kolliphor (6) | 161.9 ± 5.9 | 165.3 ± 8.4 | 167.5 ± 8.8 | 168.8 ± 9.9 | 168.3 ± 10.0 |
A single dose of 600 mg/kg meclizine elevated VsEP thresholds above baseline and above those of vehicle-treated mice after 60 min (Fig. 4c; Table 3; at 60 min: threshold change + 2.4 ± 1.9 (n = 10) dB re: 1.0 g/ms; rmANOVA F(4,17) = 4.941, p = 0.008; ANOVA F(1,20) = 19.564, p = 2.617 × 10⁻⁴; post hoc Bonferroni p = 0.045). There was no change in threshold for vehicle-treated mice: + 0.0 ± 1.8 (n = 12) dB re: 1.0 g/ms, Fig. 4c, Table 3). There were no significant effects on VsEP latencies and amplitudes over time and no differences between meclizine-treated and vehicle-treated groups (Fig. 4a and b, Table 3). Physiological parameters (heart rate, SpO2, respiratory rate) remained stable within normal ranges following meclizine suggesting threshold increases were not due to such changes (Table 2 “SD Parameters”). Taken together, the results provide evidence that meclizine at a dose of 600 mg/kg acts within ~ 60 min to elevate VsEP thresholds thus indicating a slight reduction in peripheral vestibular sensitivity.
Fig. 4.

Effects on the VsEP of a single dose of meclizine (filled symbols, 600 mg/kg, n = 10) and vehicle alone (open symbols, 10% kolliphor, n = 6). Normalized VsEP latencies (a), amplitudes (b), and thresholds (c, lower right) over a period of 80 min following single dose of meclizine. Data reflect mean ± standard deviation, where standard deviation for the meclizine treatment group is represented as long dashed lines and vehicle group by dotted lines. Actual mean baseline values (normalized here as “0”) for VsEP response parameters are presented in Table 3. Only VsEP threshold was increased significantly following a single dose of 600 mg/kg meclizine (*p < 0.05, rmANOVA; F(1,14) = 10.231, p = 0.006). Negative time on the x-axis represents baseline recording (minutes − 20 to 0). Time 0 is the time of the single dose of meclizine or 10% kolliphor vehicle injection. Data to the right of the vertical dashed line represent the effects of drug or vehicle administration on VsEP responses over time. Brain temperature was not monitored. Rectal temperature 37.0 ± 0.2 °C
Table 3.
VsEP response parameters in meclizine (600 mg/kg) and 10% kolliphor vehicle single dose (SD) protocol. VsEP latencies (µs) and amplitudes (µV) at + 6 dB re: 1.0 g/ms as well as thresholds were obtained over a period of 80 min following a 20-min stable baseline period. Drug-treated (meclizine (n = 10)) and vehicle-treated (10% kolliphor (n = 6)) groups are represented. Each time period (20 min) was characterized by averaging 4 to 5 consecutive 5-min measurements. All animals were anesthetized with ketamine/xalazine and rectal temperatures held at 37.0 ± 0.2 °C. Sample size remained constant over entire experiment
| VsEP parameters | Groups | Baseline | 1–20 min | 21–40 min | 41–60 min | 61–80 min | |
|---|---|---|---|---|---|---|---|
| Latency (µs) | P1 | Meclizine | 1387 ± 51 | 1368 ± 37 | 1382 ± 42 | 1397 ± 48 | 1389 ± 45 |
| 10% Kolliphor | 1387 ± 40 | 1383 ± 39 | 1376 ± 26 | 1372 ± 24 | 1371 ± 14 | ||
| N1 | Meclizine | 1696 ± 51 | 1675 ± 40 | 1682 ± 43 | 1703 ± 54 | 1704 ± 53 | |
| 10% Kolliphor | 1718 ± 36 | 1704 ± 48 | 1687 ± 31 | 1688 ± 41 | 1676 ± 40 | ||
| P2 | Meclizine | 2157 ± 64 | 2131 ± 64 | 2157 ± 65 | 2181 ± 57 | 2169 ± 59 | |
| 10% Kolliphor | 2168 ± 100 | 2179 ± 91 | 2164 ± 98 | 2174 ± 98 | 2163 ± 81 | ||
| Amplitude (µV) | P1-N1 | Meclizine | 1.11 ± 0.26 | 1.11 ± 0.20 | 1.11 ± 0.24 | 1.04 ± 0.18 | 1.11 ± 0.30 |
| 10% Kolliphor | 0.89 ± 0.21 | 0.84 ± 0.10 | 0.90 ± 0.18 | 0.92 ± 0.13 | 0.90 ± 0.12 | ||
| P2-N1 | Meclizine | 1.17 ± 0.28 | 1.11 ± 0.31 | 1.15 ± 0.23 | 1.14 ± 0.29 | 1.09 ± 0.22 | |
| 10% Kolliphor | 0.73 ± 0.22 | 0.79 ± 0.37 | 0.82 ± 0.33 | 0.91 ± 0.31 | 0.95 ± 0.36 | ||
| Threshold (dB re: 1.0 g/ms) | Meclizine | − 13.5 ± 1.4 | − 12.0 ± 1.6 | − 11.4 ± 1.5 | − 11.1 ± 1.9 | − 11.4 ± 1.5 | |
| 10% Kolliphor | − 11.5 ± 1.6 | − 11.5 ± 1.6 | − 11.5 ± 1.6 | − 11.0 ± 1.2 | − 11.5 ± 1.6 | ||
Diazepam
The PMD protocol was used to explore useful doses of diazepam leading to effects on the VsEP (6, 12, 24, and 48 mg/kg). In the initial testing, mice were anesthetized with ketamine/xylazine (diazepam-treated: n = 10, vehicle BPEW-treated: n = 10). In the diazepam-treated group, progressive doses of diazepam significantly delayed all latency components over a period of 80 min (Fig. 5, Table 4, “Rectal only”; rmMANOVA; F(12,108) = 4.811, p = 2.779 × 10⁻⁶; estimated cumulative dose: ~ 87 mg/kg). However, effects on amplitudes and thresholds did not reach significance (Table 5, “Rectal only”). In the BPEW vehicle group, VsEP response parameters were stable over time, indicating no effects of the BPEW vehicle alone on VsEPs.
Fig. 5.
Effects of diazepam and BPEW vehicle on normalized VsEP latencies 20 min following the fourth dose of diazepam (PD4). The estimated cumulative dose at PD4 was ~ 87 mg/kg. Doses 1, 2, and 3 were 6, 12, and 24 mg/kg (see Tables 4 and 5, “Rectal only”). Note the progressive shifts in latencies P1, N1, and P2 (see also Table 4, “Rectal only”). Normalized latencies for animals receiving the BPEW vehicle alone (1.4% benzyl alcohol, 38.5% propylene glycol, 12.7% ethyl alcohol, and 48% water) are also shown (open circles; n = 10). Data reflect mean ± standard deviation values approximately 80 min following baseline period. Actual mean VsEP response baseline values (normalized here as “0”) as well as values for all other time periods are presented in Tables 4 and 5 (“Rectal only”). Significant drug effects on all VsEP latencies were first observed at PD4 in the diazepam treated group (*p < 0.05). All animals were anesthetized with urethane/xylazine and brain temperatures were not controlled. Rectal temperature 37.0 ± 0.2 °C
Table 4.
VsEP response latencies in the diazepam and BPEW vehicle progressive multiple dose (PMD) protocol with and without brain temperature controlled. VsEP latencies (µs) at + 6 dB re:1.0 g/ms were obtained over a period of 80 min following a 20-min stable baseline period. Data were measured from mice where brain and rectal temperatures were controlled [“Brain + Rectal”] as well as from mice where only rectal temperature was controlled [”Rectal Only”]. Four incremental doses of diazepam were given (post dose 1 “PD1”: 6 mg/kg; post dose 2 “PD2”: 12 mg/kg; post dose 3 “PD3”: 24 mg/kg; post dose 4 “PD4”: 48 mg/kg). Each time period (20 min) was characterized by averaging 4 to 5 consecutive 5-min measurements as a 20-min period. Data reflect mean ± standard deviation. “Rectal only” animals were anesthetized with ketamine/xylazine whereas “Brain + Rectal” animals were anesthetized with urethane/xylazine. Brain temperatures were held at 36.0 ± 0.2 °C and rectal at 37.0 ± 0.2 °C. BPEW vehicle: 1.4% benzyl alcohol, 38.5% propylene glycol, 12.7% ethyl alcohol and 48% water. In the “Injection” column, the parentheses “(n)” reflect the sample size, which remained constant over the entire study
| VsEP parameters | Temperatures | Injection (n) | Baseline | PD1 (1–20 min) | PD2 (21–40 min) | PD3 (41–60 min) | PD4 (61–80 min) | |
|---|---|---|---|---|---|---|---|---|
| Latency (µs) | P1 | Brain + Rectal | Diazepam (10) | 1223 ± 31 | 1245 ± 42 | 1264 ± 46 | 1289 ± 48 | 1295 ± 41 |
| BPEW (6) | 1222 ± 32 | 1220 ± 29 | 1224 ± 30 | 1223 ± 28 | 1224 ± 32 | |||
| Rectal Only | Diazepam (10) | 1380 ± 106 | 1357 ± 112 | 1367 ± 121 | 1405 ± 129 | 1473 ± 134 | ||
| BPEW (10) | 1377 ± 88 | 1363 ± 92 | 1374 ± 112 | 1385 ± 114 | 1398 ± 117 | |||
| N1 | Brain + Rectal | Diazepam (10) | 1487 ± 40 | 1514 ± 45 | 1533 ± 46 | 1559 ± 48 | 1574 ± 42 | |
| BPEW (6) | 1520 ± 55 | 1522 ± 59 | 1520 ± 58 | 1521 ± 60 | 1521 ± 63 | |||
| Rectal Only | Diazepam (10) | 1694 ± 119 | 1667 ± 123 | 1673 ± 128 | 1724 ± 141 | 1808 ± 153 | ||
| BPEW (10) | 1687 ± 94 | 1674 ± 103 | 1686 ± 126 | 1704 ± 136 | 1723 ± 141 | |||
| P2 | Brain + Rectal | Diazepam (10) | 1905 ± 52 | 1937 ± 72 | 1985 ± 89 | 2018 ± 81 | 2062 ± 758 | |
| BPEW (6) | 1906 ± 51 | 1913 ± 42 | 1899 ± 58 | 1904 ± 62 | 1913 ± 55 | |||
| Rectal Only | Diazepam (10) | 2170 ± 140 | 2140 ± 148 | 2167 ± 160 | 2231 ± 175 | 2334 ± 197 | ||
| BPEW (10) | 2169 ± 124 | 2147 ± 135 | 2157 ± 140 | 2186 ± 146 | 2208 ± 143 | |||
Table 5.
VsEP amplitudes and thresholds in diazepam and BPEW vehicle progressive multiple dose (PMD) protocol with and without brain temperature controlled. VsEP amplitudes (µV) at + 6 dB re: 1.0 g/ms and thresholds were obtained over a period of 80 min following a 20-min stable baseline period. Data were obtained from mice where brain and rectal temperatures were controlled (“Brain + Rectal”) as well as from mice where only rectal temperature was controlled (”Rectal Only”). Four incremental doses of diazepam were given (post dose 1 “PD1”: 6 mg/kg; post dose 2 “PD2”: 12 mg/kg; post dose3 “PD3”: 24 mg/kg; post dose 4 “PD4”: 48 mg/kg). Each time period (20 min) was characterized by averaging 4 to 5 consecutive 5-min measurements. Data reflect mean ± standard deviation. “Rectal only” animals were anesthetized with ketamine/xylazine whereas “Brain + Rectal” animals were anesthetized with urethane/xylazine. Brain temperatures were held at 36.0 ± 0.2 °C and rectal at 37.0 ± 0.2 °C. BPEW vehicle: 1.4% benzyl alcohol, 38.5% propylene glycol, 12.7% ethyl alcohol and 48% water. In the “Injection” column, the parentheses “(n)” reflect the sample size, which remained constant over the entire study
| VsEP parameters | Temperatures | Injection (n) | Baseline | PD1 (1–20 min) | PD2 (21–40 min) | PD3 (41–60 min) | PD4 (61–80 min) | |
|---|---|---|---|---|---|---|---|---|
| Amplitude (µV) | P1-N1 | Brain + Rectal | Diazepam (10) | 0.92 ± 0.21 | 0.95 ± 0.22 | 0.89 ± 0.27 | 0.92 ± 0.20 | 0.95 ± 0.20 |
| BPEW (6) | 0.91 ± 0.11 | 0.96 ± 0.11 | 1.00 ± 0.13 | 0.96 ± 0.15 | 0.97 ± 0.14 | |||
| Rectal Only | Diazepam (10) | 1.03 ± 0.30 | 1.00 ± 0.32 | 0.97 ± 0.31 | 1.03 ± 0.28 | 1.00 ± 0.32 | ||
| BPEW (10) | 1.13 ± 0.29 | 1.10 ± 0.24 | 1.09 ± 0.28 | 1.07 ± 0.29 | 1.04 ± 0.30 | |||
| P2-N1 | Brain + Rectal | Diazepam (10) | 0.93 ± 0.21 | 0.99 ± 0.23 | 1.02 ± 0.23 | 0.97 ± 0.21 | 1.06 ± 0.25 | |
| BPEW (6) | 0.98 ± 0.34 | 1.03 ± 0.39 | 1.03 ± 0.36 | 1.07 ± 0.30 | 1.08 ± 0.34 | |||
| Rectal Only | Diazepam (10) | 1.12 ± 0.28 | 1.08 ± 0.32 | 1.06 ± 0.31 | 1.13 ± 0.32 | 1.07 ± 0.30 | ||
| BPEW (10) | 1.20 ± 0.32 | 1.17 ± 0.36 | 1.08 ± 0.32 | 1.08 ± 0.33 | 1.11 ± 0.32 | |||
| Threshold (dB re: 1.0 g/ms) | Brain + Rectal | Diazepam (10) | − 13.5 ± 1.4 | − 12.0 ± 1.6 | − 11.4 ± 1.5 | − 11.1 ± 1.9 | − 11.4 ± 1.4 | |
| BPEW (6) | − 10.0 ± 1.2 | − 10.0 ± 1.2 | − 9.5 ± 2.5 | − 9.5 ± 1.6 | − 10.0 ± 1.2 | |||
| Rectal Only | Diazepam (10) | − 12.6 ± 2.0 | − 11.1 ± 1.9 | − 11.1 ± 2.8 | − 10.5 ± 2.5 | − 9.6 ± 1.4 | ||
| BPEW (10) | − 11.7 ± 2.1 | − 11.1 ± 1.3 | − 11.4 ± 2.0 | − 11.4 ± 2.0 | − 11.7 ± 1.5 | |||
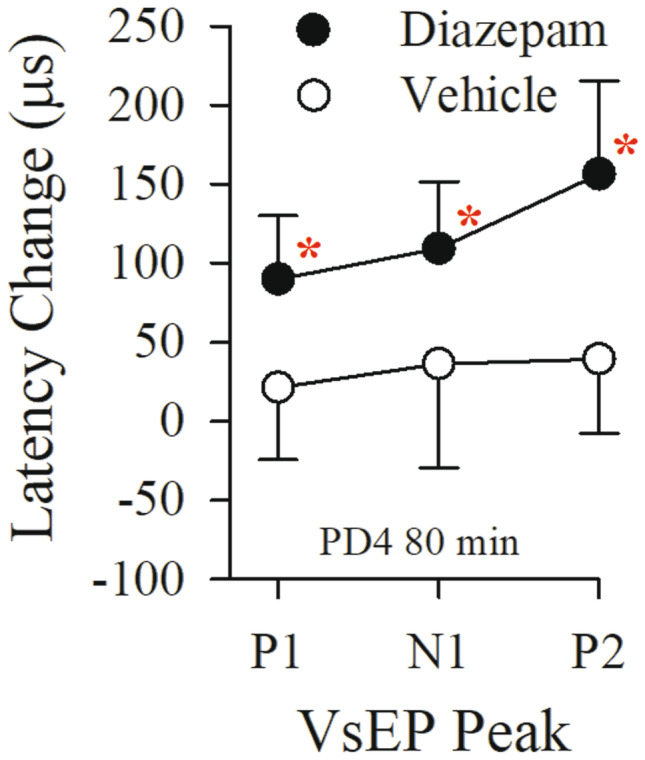
The shift in latencies following diazepam was progressively larger for successively later response peaks (e.g. Fig. 5, at PD4 latency increases were: P1: + 93.5 ± 42.9 (n = 10) µs; N1: + 114.0 ± 48.0 (n = 10) µs; and P2: + 164.3 ± 74.7 (n = 10) µs). This pattern of change is seen with changes in brain temperature in both auditory brainstem responses (Jones, Stockard and Weidner 1980) and VsEPs (Nazareth and Jones 1998; Gaines 2012). Although rectal temperatures were held constant in all of our studies, it was possible that diazepam-induced changes in brain temperature were responsible for prolonged VsEP latencies rather than a direct action of diazepam on vestibular pathways. To eliminate this possibility, a brain thermocouple was implanted and brain temperature maintained at 36.0 ± 0.2 °C and rectal at 37.0 ± 0.2 °C in all subsequent animals and the diazepam PMD protocol completed under these conditions. Hypothetically, controlling brain temperature will reveal the temperature-independent effects of diazepam on the VsEP if any.
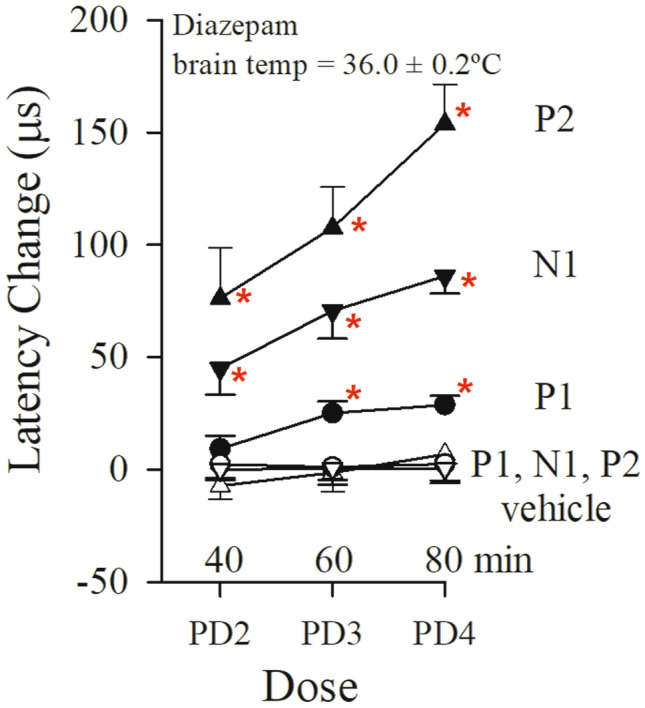
To complete the second diazepam study, we chose to change the anesthetic used. In a previous study (Lee and Jones 2018), it was shown that there were no differences in VsEP responses under two different anesthetics, ketamine/xylazine, and urethane/xylazine. However, the physiological status of mice anesthetized with urethane/xylazine was substantially improved compared to those under ketamine/xylazine anesthesia. We therefore carried out the remaining studies using urethane/xylazine anesthesia. To examine whether brain temperature changes mediated diazepam effects on the VsEP, 16 mice were anesthetized with urethane/xylazine, prepared with a brain thermocouple for controlling temperature and the effects of diazepam were re-evaluated in the PMD protocol (diazepam treated mice, n = 10; vehicle-treated mice, n = 6). Figure 6 and Table 4, “Brain + Rectal” summarize findings for VsEP latencies with brain temperature controlled at 36.0 ± 0.2 °C and rectal at 37.0 ± 0.2 °C. The pattern of latency change was significantly different between the vehicle group and the diazepam-treated group (rmMANOVA; F(3,12) = 7.26, p = 0.005). In the diazepam-treated group, all VsEP response latencies again increased following progressive doses of diazepam (maximum latency increase 20 min following dose 4 (at 80 min): P1: + 28.8 ± 12.5 (n = 10) µs, N1: + 86.1 ± 25.1 (n = 10) µs, P2: + 153.9 ± 55.8 (n = 10) µs; rmMANOVA; F(12,168) = 4.541, p = 2.494 × 10⁻⁶), whereas amplitudes and thresholds remained the same as baseline (Table 5, “Brain + Rectal”). The significant shift in P1 latency following diazepam was first observed 20 min after the dose of 24 mg/kg (at PD3, 60 min: P1 latency: + 25.1 ± 16.5 (n = 10) µs; post hoc Bonferoni p = 0.002; estimated cumulative dose: ~ 41 mg/kg). Significant changes in N1 latency were first observed 20 min after the dose of 12 mg/kg (at PD2, 40 min: estimated cumulative dose: ~ 18 mg/kg, post hoc Bonferroni p = 0.012) and P2 at PD3 (60 min; post hoc Bonferroni p = 0.021). Absolute latencies for these post-drug periods are summarized in Table 4, “Brain + Rectal.” In the vehicle-treated group, VsEP response parameters were relatively stable over time, indicating no influence of BPEW vehicle (Fig. 6, Tables 4 and 5, “Brain + Rectal”). Thus, when brain temperature was controlled during VsEP recording, peripheral (P1 and N1) and central (P2) latencies of the VsEP response were still prolonged following diazepam administration in the PMD protocol. However, the control of brain temperature reduced the magnitude of drug effects for all VsEP latencies (see Figs. 5 and 6; Table 4, “Brain + Rectal”) as well as the overall variance of VsEP response parameters. Indeed, controlling brain temperature reduced the variance of VsEP response latency parameters in both diazepam-treated and vehicle-treated groups (compare “Brain + Rectal to “Rectal only” in Table 4). Statistically significant changes in all VsEP peripheral (P1 and N1) and central (P2) latencies were observed after 60 min (at PD3). The results indicate that temperature contributes to the latency shifts produced by diazepam when brain temperature is not controlled in the anesthetized animal. Temperature change affects P1 latency the least. Based on the finding of significant shifts in all latencies at cumulative doses between 18 and 87 mg/kg, we chose to use a 60 mg/kg dose in the SD protocol.
Fig. 6.
Effects on the VsEP of progressive multiple doses of diazepam with brain and rectal temperatures controlled (brain: 36.0 ± 0.2 °C, rectal: 37.0 ± 0.2 °C). Normalized VsEP latencies are shown during the progressive multiple dose (PMD) protocol and administration of diazepam (filled symbols; n = 10). Time points labeled indicate periods 20 min following injection: PD2: 12 mg/kg; PD3: 24 mg/kg; PD4: 48 mg/kg. Animals receiving equal volumes of BPEW vehicle alone (open symbols; n = 6) were injected at the same time intervals. All 16 mice were anesthetized with urethane/xylazine. Data reflect mean ± standard error for successive periods (each approximately 20 min) following baseline period (not shown). Actual mean VsEP response baseline values (normalized here as “0”) as well as values for all other time periods are presented in Tables 4 and 5 (“Brain + Rectal”). The effects of diazepam on P1 latency were first observed at PD3 (60 min), whereas effects on N1 and P2 latencies were first observed at PD2 (40 min). *p < 0.05, post hoc Bonferroni
To evaluate the time course of diazepam effects on the VsEP, an additional 16 mice were anesthetized with urethane/xylazine and vestibular testing completed following a single 60 mg/kg dose of diazepam. Brain temperature was maintained at 36.0 ± 0.2 °C and rectal temperature at 37.0 ± 0.2 °C. Figure 7 and Table 6 summarize effects over time of a single dose of diazepam or its vehicle alone on VsEP latencies, amplitudes, and thresholds. After a single dose of 60 mg/kg, there were no significant changes in VsEP peripheral latencies (P1 and N1, Fig. 7a). Although a small change in amplitudes (P1-N1, P2-N1) occurred generally over time (rmMANOVA F(8,160) = 2.943, p = 0.004), the changes were not significantly different between diazepam and vehicle groups (Fig. 7b).
Fig. 7.

Effects of a single dose of diazepam and BPEW vehicle on VsEPs. Normalized VsEP latencies (a), amplitudes (b), and thresholds (c, lower right) over a period of 80 min following single dose of diazepam (60 mg/kg; black circles; n = 10) and BPEW vehicle (1.4% benzyl alcohol, 38.5% propylene glycol, 12.7% ethyl alcohol, and 48% water; open circles; n = 6). Data reflect mean ± standard deviation for successive period (each approximately 20 min) following baseline (period before vertical dashed line). Actual mean baseline values (normalized here as “0”) for VsEP response parameters are present in Table 6. In the diazepam-treated group, statistically significant drug effects on VsEP P2 latency were observed after 40 min following single dose (*p < 0.05). All 16 mice were anesthetized with urethane/xylazine and their brain (36.0 ± 0.2 °C) and rectal (37.0 ± 0.2 °C) temperatures were also controlled
Table 6.
VsEP response parameters in diazepam (60 mg/kg) and BPEW vehicle single dose (SD) protocol. VsEP latencies (µs) and amplitudes (µV) at + 6 dB re: 1.0 g/ms as well as thresholds were obtained over a period of 80 min following a 20-min stable baseline. Data were collected from drug-treated (diazepam [n = 10]) or vehicle-treated (BPEW vehicle [n = 6]: 1.4% benzyl alcohol, 38.5% propylene glycol, 12.7% ethyl alcohol and 48% water) mice. Each time period (20 min) was characterized by averaging 4 to 5 consecutive 5-min measurements. All animals were anesthetized with urethane/xylazine, brain temperatures were held at 36.0 ± 0.2 °C and rectal at 37.0 ± 0.2 °C throughout the experiments. Sample size remained constant over entire experiment
| VsEP parameters | Groups | Baseline | 1–20 min | 21–40 min | 41–60 min | 61–80 min | |
|---|---|---|---|---|---|---|---|
| Latency (µs) | P1 | Diazepam | 1341 ± 81 | 1342 ± 91 | 1352 ± 94 | 1354 ± 89 | 1358 ± 87 |
| BPEW | 1278 ± 589 | 1274 ± 63 | 1270 ± 62 | 1270 ± 62 | 1268 ± 57 | ||
| N1 | Diazepam | 1646 ± 108 | 1650 ± 109 | 1665 ± 115 | 1669 ± 111 | 1676 ± 109 | |
| BPEW | 1570 ± 92 | 1559 ± 95 | 1557 ± 95 | 1561 ± 89 | 1561 ± 95 | ||
| P2 | Diazepam | 2053 ± 84 | 2062 ± 88 | 2103 ± 102 | 2112 ± 91 | 2134 ± 86 | |
| BPEW | 1947 ± 100 | 1954 ± 102 | 1962 ± 106 | 1958 ± 96 | 1955 ± 98 | ||
| Amplitude (µV) | P1-N1 | Diazepam | 0.91 ± 0.26 | 0.90 ± 0.21 | 0.88 ± 0.26 | 0.89 ± 0.24 | 0.88 ± 0.25 |
| BPEW | 0.87 ± 0.17 | 0.88 ± 0.18 | 0.94 ± 0.21 | 0.94 ± 0.19 | 0.92 ± 0.19 | ||
| P2-N1 | Diazepam | 0.83 ± 0.15 | 0.90 ± 0.22 | 0.93 ± 0.19 | 0.92 ± 0.20 | 0.93 ± 0.23 | |
| BPEW | 0.94 ± 0.22 | 1.00 ± 0.24 | 1.01 ± 0.29 | 1.00 ± 0.23 | 0.96 ± 0.23 | ||
| Threshold (dB re: 1.0 g/ms) | Diazepam | − 10.8 ± 0.9 | − 9.0 ± 2.1 | − 8.7 ± 2.1 | − 8.7 ± 2.1 | − 8.7 ± 1.5 | |
| BPEW | − 11.0 ± 1.2 | − 10.5 ± 0.0 | − 10.5 ± 1.9 | − 10.5 ± 1.9 | − 10.0 ± 1.2 | ||
There was a small increase in VsEP thresholds over the 80-min period following treatment (diazepam threshold increase + 2.1 ± 1.45 (n = 10) dB re: 1.0 g/ms; rmANOVA; F(4,11) = 4.82, p = 0.017; Fig. 7c). However, there was no significant difference between threshold changes in the diazepam and vehicle groups; Fig. 7c). Significant gradual latency increases were seen only in the diazepam group and only for P2 at 80 min. (P2 latency change + 80.6 ± 59.8 (n = 10) µs; rmMANOVA F(2.0,40.2) = 13.36, p = 3.5 × 10⁻⁵ Greenhouse–Geisser; post hoc Bonferroni p = 0.005). The change in P2 latency was significantly different for the two treatment groups (rmMANOVA F(3,18) = 5.379, p = 0.008), where the vehicle group showed no latency shift. The steady increase in P2 latency showed no evidence of reaching a plateau or decreasing with time.
There was a gradual small reduction in SpO2 % over time for both PMD and SD studies (Fig. 8; Table 7, PMD: rmANOVA F(4,80) = 10.26, p = 9.3 × 10⁻⁷. SD: rmANOVA F(4,80) = 7.96, p = 1.9 × 10⁻⁵). However, SpO2 % remained well within acceptable levels and there was no difference in SpO2 % between diazepam and vehicle groups. Heart rate was also stable during the 80-min period in both the PMD and SD studies (Table 7). Administration of diazepam was accompanied by a gradual decrease in respiratory rate, which was not seen in the vehicle group (Fig. 8; Table 7; PMD: rmANOVA, F(1.9,38.4) = 10.5, p = 2.6 × 10⁻⁴; SD: rmANOVA, F(1.9,37.7) = 22.9, p = 4.6 × 10⁻⁷). Despite the modest decrease in respiratory rate, as noted, SpO2 % remained within targeted levels. Given the physiological stability during drug administration (Table 7), the observed changes in vestibular function likely reflect the direct action of diazepam on macular vestibular pathways. Moreover, the reduced respiratory rates provide additional evidence beyond delays in P2 latencies of the action of diazepam on the central nervous system and likely brainstem respiratory control circuits.
Fig. 8.

Systemic physiological parameters of respiratory rate (ipm) and SpO2(%) in diazepam-treated groups. Data reflect the multiple dose protocol mice (filled symbols, PMD) and single dose protocol mice (open circles, SD) between 0 and 80 min following dosing. Time 0 is the mean of baseline and each time point represents the mean for the 20-min period (± standard deviation). Diazepam significantly reduced respiratory rates in both protocols (PMD: rmANOVA, F(4,6) = 5.042, p = 0.040; SD: rmANOVA, F(4,6) = 7.061, p = 0.019). This decline in respiratory rate did not occur in mice treated with vehicle alone. Although SpO2 % decreased slightly for both protocols (PMD: rmANOVA F(4,80) = 10.26, p = 9.3 × 10⁻⁷. SD: rmANOVA F(4,80) = 7.96, p = 1.9 × 10⁻⁵), there was no difference between the diazepam and vehicle groups. Heart rates were unchanged over time in both protocols (Table 7). All animals were anesthetized with urethane/xylazine and their brain (36.0 ± 0.2 °C) and rectal (37.0 ± 0.2 °C) temperatures were also controlled
Table 7.
Diazepam: systemic physiological parameters of SpO2 (%), heart rate (bpm), and respiration rate (ipm) in diazepam and BPEW vehicle progressive multiple dose (PMD) protocol with and without brain temperature controlled. Three physiologic parameters were monitored and recorded from mice where brain and rectal temperatures were controlled (“Brain + Rectal”) as well as from mice where only rectal temperature controlled (“Rectal Only”). Four incremental doses of diazepam were given (post dose 1 “PD1”: 6 mg/kg; post dose 2 “PD2”: 12 mg/kg; post dose 3 “PD3”: 24 mg/kg; post dose 4 “PD4”: 48 mg/kg). Data reflect mean ± standard deviation. “Rectal only” animals were anesthetized with ketamine/xylazine whereas “Brain + Rectal” animals were anesthetized with urethane/xylazine. Brain temperatures were held at 36.0 ± 0.2 °C and rectal at 37.0 ± 0.2 °C. BPEW vehicle: 1.4 % benzyl alcohol, 38.5 % propylene glycol, 12.7 % ethyl alcohol and 48 % water. Parameters for single dose protocol (SD, 60 mg/kg) are shown below PMD data. Both brain and rectal temperatures were controlled in SD protocol. In the “Group” column, the parentheses “(N)” reflect the sample size, which remained constant over the entire study
| PMD parameters | Temperature | Groups | Baseline | PD1 (1–20 min) | PD2 (21–40 min) | PD3 (41–60 min) | PD4 (61–80 min) |
|---|---|---|---|---|---|---|---|
| SpO2 (%) | Brain + Rectal | Diazepam (10) | 86.8 ± 2.4 | 85.9 ± 1.6 | 83.7 ± 1.8 | 84.1 ± 2.5 | 83.3 ± 2.0 |
| BPEW (6) | 87.7 ± 4.8 | 88.2 ± 5.6 | 88.0 ± 4.7 | 87.3 ± 5.1 | 86.7 ± 4.9 | ||
| Rectal Only | Diazepam (10) | 86.2 ± 2.8 | 83.7 ± 3.5 | 81.7 ± 2.9 | 78.6 ± 3.7 | 76.0 ± 3.9 | |
| BPEW (10) | 85.8 ± 2.5 | 83.8 ± 3.1 | 81.6 ± 3.7 | 79.1 ± 2.9 | 78.0 ± 2.8 | ||
| Heart rate (bpm) | Brain + Rectal | Diazepam (10) | 351.6 ± 24.8 | 348.4 ± 22.2 | 325.2 ± 40.1 | 302.9 ± 62.7 | 303.3 ± 70.5 |
| BPEW (6) | 341.9 ± 13.3 | 345.6 ± 15.9 | 355.1 ± 18.0 | 357.1 ± 25.1 | 367.5 ± 20.2 | ||
| Rectal Only | Diazepam (10) | 284.8 ± 35.8 | 276.5 ± 25.9 | 267.9 ± 32.0 | 221.7 ± 39.5 | 216.7 ± 47.9 | |
| BPEW (10) | 274.3 ± 39.4 | 270.5 ± 33.3 | 266.8 ± 26.8 | 265.0 ± 24.5 | 259.5 ± 18.2 | ||
| Respiration rate (ipm) | Brain + Rectal | Diazepam (10) | 170.2 ± 7.5 | 161.5 ± 15.5 | 153.1 ± 13.8 | 145.0 ± 13.4 | 140.4 ± 13.6 |
| BPEW (6) | 184.9 ± 3.5 | 185.8 ± 3.8 | 185.8 ± 4.6 | 184.8 ± 5.0 | 184.8 ± 5.1 | ||
| Rectal Only | Diazepam (10) | 154.7 ± 4.7 | 154.6 ± 7.5 | 152.2 ± 8.2 | 150.9 ± 11.8 | 151.8 ± 11.5 | |
| BPEW (10) | 156.2 ± 17.4 | 159.1 ± 13.8 | 160.8 ± 15.1 | 162.5 ± 14.4 | 161.8 ± 13.1 |
| SD parameters | Groups | Baseline | 1–20 min | 21–40 min | 41–60 min | 61–80 min |
|---|---|---|---|---|---|---|
| SpO2 (%) | Diazepam (10) | 89.1 ± 3.0 | 88.2 ± 2.1 | 88.8 ± 2.8 | 86.1 ± 2.3 | 85.5 ± 1.9 |
| BPEW (6) | 91.8 ± 3.0 | 89.2 ± 2.9 | 86.9 ± 2.9 | 87.0 ± 5.4 | 87.0 ± 3.5 | |
| Heart rate (bpm) | Diazepam (10) | 351.5 ± 37.0 | 349.5 ± 36.6 | 353.3 ± 36.3 | 351.8 ± 37.9 | 356.8 ± 40.0 |
| BPEW (6) | 358.6 ± 41.5 | 358.4 ± 37.3 | 363.9 ± 40.5 | 367.8 ± 43.3 | 376.7 ± 58.1 | |
| Respiration rate (ipm) | Diazepam (10) | 178.3 ± 3.7 | 175.0 ± 6.7 | 167.6 ± 9.1 | 161.3 ± 9.6 | 158.3 ± 9.9 |
| BPEW (6) | 176.8 ± 5.8 | 177.3 ± 5.2 | 176.4 ± 6.8 | 176.3 ± 8.0 | 175.5 ± 9.4 |
JNJ7777120
Thirty-six mice were tested in the JNJ7777120 study. In the PMD protocol (20, 40, 80, and 160 mg/kg), significant increases in P1-N1 amplitudes were resolved over a period of 80 min in the JNJ7777120 treatment group (P1-N1 amplitude + 0.16 ± 0.11 (n = 11) µV; Fig. 9; Table 8; rmANOVA; F(4,40) = 12.786, p = 8.587 × 10⁻⁷), but not in the DMSO vehicle group. Similarly, P1-N1 amplitude regression slopes obtained from individual animals (amplitude vs time) were significantly different for treatment (slope 2.3 ± 1.3 (n = 11) nV/min) and vehicle groups (slope 0.2 ± 0.5 (n = 6) nV/min; ANOVA; F(1,15) = 14.5, p = 0.002). P1-N1 amplitudes increased slowly and steadily reaching significance following the third dose PD3 (at 60 min; P1-N1 amplitude increase = + 0.14 ± 0.12 (n = 11) µV; cumulative dose ~ 111 mg/kg; post hoc Dunnett p = 0.017). There were no significant drug effects on P2-N1 amplitudes. Although there were significant small decreases in all latencies and thresholds over a period of 80 min after baseline (VsEP latencies − 62.8 ± 20.0 (n = 11) µs, rmMANOVA, F(12,252) = 4.922, p = 2.625 × 10⁻⁷; threshold − 3.8 ± 0.7 (n = 11) dB re: 1.0 g/ms, rmANOVA, F(4,84) = 3.388, p = 0.013), there were no differences in latencies and threshold between JNJ7777120-treated and DMSO-treated mice (Table 8). The findings of the PMD protocol indicated that the effect of JNJ7777120 on peripheral amplitudes was slow to develop and a dose of 160 mg/kg would be effective in altering VsEPs in the SD protocol.
Fig. 9.
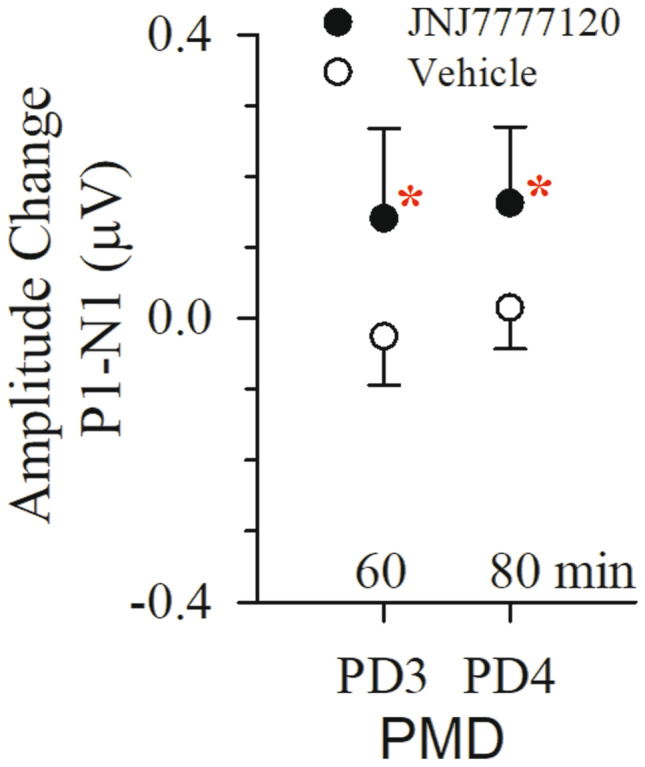
Effects of progressive multiple doses of JNJ7777120 and DMSO vehicle on VsEPs. Normalized VsEP P1-N1 amplitudes following successive doses of JNJ7777120 (black circles; n = 11; 20, 40, 80, and 160 mg/kg) or vehicle DMSO (open circles; n = 6). Data reflect mean ± standard deviation of amplitude change from baseline for periods PD3 and PD4. Actual mean baseline values (normalized here as “0”) for VsEP response parameters are present in Table 8. Significant drug effects on P1-N1 amplitudes were only observed in the drug treatment group (*p < 0.05). There were no significant effects on other VsEP response parameters (P1, N1, P2 latencies, P2-N1 amplitudes, and threshold). All animals were anesthetized with urethane/xylazine and brain (36.0 ± 0.2 °C) and rectal (37.0 ± 0.2 °C) temperatures were controlled. Data for heart rate are available in Table 10
Table 8.
VsEP response parameters in JNJ7777120 and 100 % DMSO progressive multiple dose (PMD) protocol. VsEP latencies (µs) and amplitudes (µV) at + 6 dB re: 1.0 g/ms) as well as thresholds were obtained over a period of 80 min following a 20-min stable baseline period. Data were collected from drug-treated (JNJ7777120 [n = 11]) or vehicle-treated (100 % DMSO [n = 6]) mice. Each time period (20 min) was characterized by averaging 4 to 5 consecutive 5-min measurements following each successive dose of JNJ7777120 (post dose 1 “PD1”: 20 mg/kg; post dose 2 “PD2”: 40 mg/kg; post dose 3 “PD3”: 80 mg/kg; post dose 4 “PD4”: 160 mg/kg) or 100 % DMSO. Data reflect mean ± standard deviation. All animals were anesthetized with urethane/xylazine and brain temperatures were held at 36.0 ± 0.2 °C and rectal at 37.0 ± 0.2 °C throughout the experiments. Sample size remained constant over entire experiment
| VsEP parameters | Groups | Baseline | PD1 (1–20 min) | PD2 (21–40 min) | PD3 (41–60 min) | PD4 (61–80 min) | |
|---|---|---|---|---|---|---|---|
| Latency (µs) | P1 | JNJ7777120 | 1320 ± 65.4 | 1299 ± 59 | 1286 ± 58 | 1274 ± 53 | 1272 ± 53 |
| DMSO | 1345 ± 46 | 1346 ± 42 | 1340 ± 44 | 1337 ± 38 | 1334 ± 40 | ||
| N1 | JNJ7777120 | 1579 ± 82 | 1564 ± 75 | 1557 ± 70 | 1554 ± 70 | 1555 ± 68 | |
| DMSO | 1655 ± 62 | 1644 ± 56 | 1643 ± 52.1 | 1163 ± 48 | 1629 ± 43 | ||
| P2 | JNJ7777120 | 1988 ± 122 | 1985 ± 135 | 1982 ± 141 | 1967 ± 140 | 1959 ± 142 | |
| DMSO | 2017 ± 49 | 2008 ± 46 | 2001 ± 45 | 1999 ± 48 | 1992 ± 57 | ||
| Amplitude (µV) | P1-N1 | JNJ7777120 | 0.89 ± 0.26 | 0.87 ± 0.26 | 0.95 ± 0.30 | 1.03 ± 0.28 | 1.05 ± 0.30 |
| DMSO | 0.90 ± 0.29 | 0.86 ± 0.33 | 0.90 ± 0.33 | 0.87 ± 0.31 | 0.91 ± 0.30 | ||
| P2-N1 | JNJ7777120 | 0.86 ± 0.35 | 0.97 ± 0.34 | 1.05 ± 0.32 | 1.05 ± 0.36 | 1.05 ± 0.28 | |
| DMSO | 0.89 ± 0.26 | 0.88 ± 0.27 | 0.86 ± 0.29 | 0.88 ± 0.33 | 0.86 ± 0.32 | ||
| Threshold (dB re: 1.0 g/ms) | JNJ7777120 | − 9.1 ± 1.6 | − 9.7 ± 2.4 | − 9.7 ± 2.7 | − 10.5 ± 2.7 | − 11.3 ± 2.7 | |
| DMSO | − 9.5 ± 1.5 | − 9.5 ± 1.6 | − 9.0 ± 1.6 | − 10.0 ± 2.3 | − 9.5 ± 1.6 | ||
Figure 10 and Table 9 summarize VsEP response parameters for the JNJ7777120 and DMSO vehicle in the single dose protocol (160 mg/kg). All latencies for both drug-treated and vehicle groups decreased slightly and steadily over the course of the study (Fig. 10a, rmMANOVA; F(12,240) = 6.431, p = 6.743 × 10⁻¹⁰). However, the slope of P1 latency shift in the JNJ7777120 group was significantly larger than that of the vehicle group (slopes − 0.7 ± 0.33 (n = 10) µs/min for JNJ7777120, − 0.18 ± 0.22 (n = 12) µs/min for DMSO; ANOVA; F(1,20) = 19.093, p = 2.97 × 10⁻⁴). The shift in P1 latency became significantly different than vehicle at 80 min post-drug (P1 latency − 46.8 ± 28.1 (n = 10) µs for JNJ7777120, − 8.1 ± 30.8 (n = 6) µs for DMSO; rmMANOVA F(3,18) = 6.727, p = 0.003; post hoc Bonferroni p = 0.001) and the maximum effect on P1 latency at 120 min was − 69.7 ± 29.4 (n = 9) µs. Latency decreases for N1 and P2 in the JNJ7777120 group were not significantly different than the corresponding vehicle latencies. P1-N1 but not P2N1 amplitudes in the JNJ7777120 group increased significantly more than the corresponding peaks in the vehicle group (Fig. 10b, P1-N1 amplitude + 0.24 ± 0.20 (n = 9) µV for JNJ7777120, 0.03 ± 0.07 (n = 6) µV for DMSO; rmANOVA, P1-N1: F(1,20) = 4.712, p = 0.042). Threshold also improved modestly but significantly after 80 min following baseline (Fig. 10c, threshold decrease = − 3.8 ± 0.7 dB re: 1.0 g/ms; rmANOVA; F(2.2,94.7) = 8.110, p = 0.002: post hoc Bonferroni p = 0.009) in comparison to DMSO-treated mice.
Fig. 10.

Effects of a single dose of JNJ7777120 and DMSO vehicle on VsEPs. Normalized VsEP latencies (a), amplitudes (b), and thresholds (c, lower right) over a period of 120 min following single dose of JNJ7777120 (n = 10; 160 mg/kg) and DMSO (n = 6). Data reflect mean ± standard deviation (JNJ7777120 treatment group: black circles ± long dashed lines; DMSO vehicle group: open circles ± dotted lines). Minus time on the x-axis represents baseline recording. Time 0 is the time of the single dose of JNJ7777120 drug or DMSO vehicle solutions. Actual mean baseline values (normalized here as “0”) for VsEP response parameters are present in Table 9. Significant JNJ7777120 effects on VsEP P1 latency, P1-N1 amplitude and threshold were first observed after approximately an hour after baseline period (*p < 0.05). All animals were anesthetized with urethane/xylazine and brain (36.0 ± 0.2 °C) and rectal (37.0 ± 0.2 °C) temperatures were controlled
Table 9.
VsEP response parameters in JNJ7777120 (160 mg/kg) and 100 % DMSO single dose (SD) protocol. VsEP latencies (µs) and amplitudes (µV) at + 6 dB re: 1.0 g/ms as well as thresholds are shown over a period of 120 min following a 20-min stable baseline period. Treatment groups of JNJ7777120 (160 mg/kg; n = 10) and DMSO (vehicle, n = 6) are represented. Each time period (20 min) was characterized by averaging 4 to 5 consecutive 5-min measurements. All animals were anesthetized with urethane/xylazine and brain temperatures were held at 36.0 ± 0.2 °C and rectal at 37.0 ± 0.2 °C throughout the experiments. Sample size remained constant over entire experiment
| VsEP parameters | Groups | Baseline | 1–20 min | 21–40 min | 41–60 min | 61–80 min | 81–100 min | 101–120 min | |
|---|---|---|---|---|---|---|---|---|---|
| Latency (µs) | P1 | JNJ7777120 | 1372 ± 48 | 1365 ± 41 | 1341 ± 46 | 1329 ± 49 | 1317 ± 52 | 1309 ± 38 | 1300 ± 43 |
| DMSO | 1357 ± 52 | 1357 ± 55 | 1351 ± 58 | 1343 ± 69 | 1340 ± 58 | 1332 ± 56 | 1335 ± 56 | ||
| N1 | JNJ7777120 | 1658 ± 55 | 1640 ± 51 | 1630 ± 53 | 1627 ± 51 | 1614. ± 51 | 1599 ± 38 | 1603 ± 40 | |
| DMSO | 1655 ± 83 | 1644 ± 88 | 1640 ± 86 | 1634 ± 89 | 1631 ± 86 | 1625 ± 76 | 1618 ± 73 | ||
| P2 | JNJ7777120 | 2062 ± 78 | 2044 ± 72 | 2029 ± 63 | 2017 ± 72 | 2002 ± 87 | 1991 ± 92 | 1980 ± 94 | |
| DMSO | 2004 ± 69 | 1993 ± 71 | 1991 ± 76 | 1987 ± 70 | 1988 ± 70 | 1983 ± 73 | 1979 ± 72 | ||
| Amplitude (µV) | P1-N1 | JNJ7777120 | 0.81 ± 0.25 | 0.82 ± 0.23 | 0.84 ± 0.22 | 0.88 ± 0.21 | 0.92 ± 0.22 | 0.98 ± 0.25 | 1.03 ± 0.25 |
| DMSO | 0.94 ± 0.16 | 0.91 ± 0.13 | 0.91 ± 0.19 | 0.91 ± 0.19 | 0.93 ± 0.16 | 0.99 ± 0.19 | 0.97 ± 0.18 | ||
| P2-N1 | JNJ7777120 | 0.77 ± 0.22 | 0.81 ± 0.26 | 0.86 ± 0.35 | 0.91 ± 0.35 | 0.89 ± 0.33 | 0.94 ± 0.39 | 0.96 ± 0.45 | |
| DMSO | 0.89 ± 0.17 | 0.89 ± 0.23 | 0.89 ± 0.29 | 0.86 ± 0.21 | 0.94 ± 0.24 | 0.92 ± 0.24 | 0.92 ± 0.26 | ||
| Threshold (dB re: 1.0 g/ms) | JNJ7777120 | − 8.4 ± 1.5 | − 8.4 ± 2.0 | − 9.6 ± 2.5 | − 10.2 ± 1.6 | − 12.0 ± 1.6 | − 11.2 ± 1.3 | − 12.2 ± 2.2 | |
| DMSO | − 8.5 ± 1.6 | − 9.5 ± 1.6 | − 8.5 ± 1.6 | − 9.5 ± 1.6 | − 9.5 ± 1.6 | − 9.5 ± 2.5 | − 10.0 ± 2.3 | ||
Latency changes for P1, N1, and P2 in the JNJ7777120 group occurred in parallel since the regression slopes were not significantly different from each other. This implies that the change due to the drug reflects drug action in the peripheral vestibular neurons innervating otoconial organs rather than in central vestibular relays. Changes in peripheral vestibular function developed slowly over 120 min and progressed with little evidence of a plateau.
During the course of both JNJ7777120 dosing protocols, there were no differences between the vehicle and drug treatment groups for SpO2, heart rate, and respiration rate (Table 10). Therefore, changes in systemic physiology did not likely contribute to the specific effects of JNJ7777120 on the VsEP. We can confirm a modest slowing of heart rate over the first hour in all animals followed by an increase in rate beginning about 80 min post-drug. As noted for the diazepam studies above, this pattern is associated with urethane anesthesia alone and has been shown not to affect the VsEP (Lee and Jones 2018).
Table 10.
JNJ7777120: systemic physiological parameters of SpO2 (%), heart rate (bpm), and respiration rate (ipm) in JNJ7777120 and 100 % DMSO progressive multiple dose (PMD) protocol. Three physiologic parameters were monitored and recorded at 20-min intervals following each successive dose of JNJ7777120 (post dose 1 “PD1”: 20 mg/kg; post dose 2 “PD2”: 40 mg/kg; post dose 3 “PD3”: 80 mg/kg; post dose 4 “PD4”:160 mg/kg) or 100 % DMSO. Data were collected from drug-treated (JNJ7777120 [n = 12]) or vehicle-treated (100 % DMSO [n = 6]) mice. Data reflect mean ± standard deviation. Parameters for single dose protocol (SD, 160 mg/kg) are shown below PMD data All animals were anesthetized with urethane/xylazine and brain temperatures were held at 36.0 ± 0.2 °C and rectal at 37.0 ± 0.2 °C throughout the experiments. Sample size remained constant over entire experiment
| PMD parameters | Groups | Baseline | PD1 (1–20 min) | PD2 (21–40 min) | PD3 (41–60 min) | PD4 (61–80 min) |
|---|---|---|---|---|---|---|
| SpO2 (%) | JNJ7777120 (12) | 91.6 ± 2.9 | 90.5 ± 3.5 | 90.8 ± 4.1 | 90.0 ± 3.6 | 89.1 ± 3.3 |
| DMSO (6) | 92.5 ± 2.1 | 90.8 ± 3.2 | 90.8 ± 3.4 | 90.4 ± 2.5 | 89.6 ± 2.6 | |
| Heart rate (bpm) | JNJ7777120 (12) | 349.6 ± 61.0 | 329.3 ± 48.6 | 277.8 ± 51.4 | 253.3 ± 51.1 | 295.1 ± 81.8 |
| DMSO (6) | 338.2 ± 35.2 | 325.7 ± 46.2 | 300.4 ± 54.7 | 281.4 ± 50.8 | 270.6 ± 73.4 | |
| Respiration rate (ipm) | JNJ7777120 (12) | 176.8 ± 8.7 | 177.4 ± 9.8 | 179.5 ± 10.7 | 180.2 ± 12.4 | 179.6 ± 10.4 |
| DMSO (6) | 170.8 ± 11.9 | 174.2 ± 10.8 | 179.1 ± 10.0 | 178.9 ± 11.6 | 180.0 ± 11.7 |
| SD parameters | Groups | Baseline | 1–20 min | 21–40 min | 41–60 min | 61–80 min | 81–100 min | 101–120 min |
|---|---|---|---|---|---|---|---|---|
| SpO2 (%) | JNJ7777120 (11) | 89.8 ± 4.9 | 89.7 ± 4.8 | 90.0 ± 5.1 | 89.3 ± 4.4 | 89.4 ± 5.4 | 89.0 ± 6.1 | 88.4 ± 5.3 |
| DMSO (6) | 89.3 ± 6.7 | 89.6 ± 5.4 | 89.0 ± 6.7 | 89.5 ± 5.8 | 88.7 ± 5.8 | 88.1 ± 6.1 | 87.3 ± 4.0 | |
| Heart rate (bpm) | JNJ7777120 (11) | 307.6 ± 36.0 | 356.2 ± 35.3 | 336.9 ± 54.3 | 339.7 ± 60.8 | 364.4 ± 58.1 | 426.2 ± 73.1 | 481.9 ± 70.5 |
| DMSO (6) | 351.7 ± 23.7 | 344.2 ± 24.0 | 325.7 ± 40.6 | 321.8 ± 49.7 | 325.3 ± 57.7 | 366.0 ± 66.0 | 413.7 ± 53.6 | |
| Respiration rate (ipm) | JNJ7777120 (11) | 176.4 ± 8.3 | 180.3 ± 5.5 | 179.6 ± 7.7 | 178.1 ± 9.2 | 178.4 ± 9.5 | 180.9 ± 10.1 | 180.2 ± 11.5 |
| DMSO (6) | 178.5 ± 8.0 | 179.2 ± 8.5 | 178.8 ± 10.9 | 177.9 ± 12.2 | 177.0 ± 12.5 | 174.8 ± 10.0 | 172.1 ± 10.7 |
DISCUSSION
Our findings demonstrate that meclizine, diazepam, and JNJ7777120 alter vestibular macular response characteristics as reflected by the VsEP. Several notable features of the effects are outlined below.
Changes in Peripheral and Central Components of the VsEP were Modest
VsEP changes in latency (P1 and N1), amplitude (P1-N1), and shifts in threshold reflect peripheral actions of drugs on the neuroepithelium of the otoconial organs and/or vestibular nerve. The changes observed here were dose-dependent and modest at doses used. Meclizine elevated VsEP thresholds by ~ 3 dB, which is virtually at the limit of our ability to detect threshold shifts. Despite being small, we cannot rule out the possibility that such changes contribute to or reflect processes leading to the improvement in patients’ perceptions of clinical symptoms. Threshold shifts produced by JNJ7777120 were somewhat larger and in the opposite direction (i.e., lower thresholds − 3.8 dB). Potentially important peripheral changes in latencies and amplitudes also occurred with JNJ7777120 administration, and this was reflected as an average modest decrease in latencies on the order of 70 µs and average amplitude increase of about 0.3 µV (27 % increase; Fig. 10a, b and Table 9). Improved thresholds (Fig. 10c) are consistent with decreased latencies and increased amplitudes, all of which point to an enhanced neuroepithelial sensitivity and improved onset activation timing in macular responses to transient head motion.
The results demonstrate that a single dose of diazepam (60 mg/kg) significantly altered macular central VsEP response components (e.g., VsEP latency change in P2; Fig. 7a and Table 6) with essentially no effect on peripheral latencies (P1, N1), amplitudes (P1-N1), or thresholds. Peripheral action was also suggested with the finding of latency shifts in P1 and N1 at the highest doses (PMD). This only occurred at the highest doses where there may be an increased possibility of non-specific action.
In any case, the results indicate that diazepam produces its’ largest effects on central vestibular nuclei and its effects there lead to delayed activation of brainstem macular pathways. Reduced respiratory rates in the diazepam-treated group were also indicative of the well-known general central sedative effects of benzodiazepines (reviewed in Mehdi 2012; Woods and Charney 1988). There was no evidence that meclizine or JNJ7777120 acted on brainstem macular relays.
The Effects of Drugs Were Relatively Slow to Develop
The effects of JNJ7777120 developed slowly reaching significant levels after approximately an hour. There is little information regarding the pharmacokinetics of JNJ7777120. However, being dissolved in DMSO one may reason that the drug was well distributed to the tissues including the brain and labyrinth (e.g., Budavari et al. 1996; Brayton 1986; Hucker et al. 1966; Kolb et al. 1967). The slow developing effects of the drug may in part be due to pharmacokinetics and part pharmacodynamics. JNJ7777120 is an H4 antagonist, and like other histamine receptors, H4 activation is believed to be mediated by G-protein pathways. In previous behavioral studies using rats, the effects of JNJ7777120 developed over approximately 1.5 h (reaching a maximum at 6 h) after intraperitoneal drug injection (Desmadryl et al. 2012), and in another case (Wersinger et al. 2013), the onset of effects occurred within 1 h. Thus, the time course observed here is consistent with that of therapeutic benefit in rats with peripheral vestibular deficits. In vitro, the effects of JNJ7777120 on single neurons are reportedly very rapid, occurring within seconds (Wersinger et al. 2013). Assuming the effects in vitro are related to therapeutic benefits, such findings suggest that pharmacokinetics may play a more important role in the slowly developing effects in vivo.
The time profile for diazepam is presented in Fig. 7a (VsEP latencies). Changes in P2 latency following drug injection reflect an initial rapid increase over the first 20 min and then a more gradual latency increase thereafter over the next hour. Diazepam is rapidly absorbed within 30 min following oral administration and widely distributed throughout the body (Adamec et al. 1981; Hironaka et al. 1984; Schwartz et al. 1965). Although small, the changes seen here reflect a more rapid development for diazepam effects compared to JN7777120, possibly due in part to rapid actions on the ionotropic GABAA channel.
Temporal Profiles Were Monotonic Increasing or Decreasing
Drug effects observed for most measures reflected gradual response changes over a 120-min post-drug period without a prominent peak or plateau. This suggests that maximum drug effects on the VsEP may occur at times longer than 2 h.
Drug Actions on Peripheral Vestibular Function
Despite large doses, neither meclizine nor diazepam altered peripheral macular function dramatically based on the VsEP. One could argue that the drugs did not reach the perilymph and target cells of the maculae. This possibility is unlikely since both meclizine and diazepam are highly lipid-soluble, appear rapidly in the blood stream and readily pass into the brain across endothelial tight junctions and arguably across the blood-labyrinth barrier as well (Chovan et al. 1985; Hironaka et al. 1984; Plumb 2008; Schwartz et al. 1965; Wang et al. 2012). A computational model based on the molecular structure of drugs is available, (http://swissadme.ch/), which provides an indication of how readily drugs pass through the blood–brain and other barriers (Daina et al. 2017). The blood–labyrinth barrier is morphologically and functionally similar to the blood–brain barrier (Jahnke 1980; Juhn et al. 2001). Based on lipid solubility and polar properties of the molecules, the model predicts that the blood–labyrinth barrier is highly permeable to all three tested drugs.
Alternatively, one could argue that the doses used were insufficient to see substantial peripheral effects. However, the doses used here were large, being 6 to 10 times those recommended for clinical use in animals or those used to control behavioral symptoms following vestibular injury in rodents.
One parsimonious explanation for the finding of small effects on peripheral vestibular function is that both meclizine and diazepam act most effectively centrally to control symptoms. In that regard, the fact that P2 latency was shifted with diazepam clearly indicates that diazepam acts to some extent directly or indirectly on central macular relays themselves. Our findings provide no direct evidence that meclizine acts on central vestibular macular pathways.
There is an additional important possibility. The VsEP reflects macular responses to transient head motion and depends largely on vestibular macular calyx-bearing afferents with phasic (rapidly adapting) response characteristics and irregular spontaneous discharge patterns (e.g., calyx only and dimorph afferents; Jones et al. 2011, 2015; Lee et al. 2017; Curthoys et al. 2019). It is possible that these drugs act preferentially on hair cells and/or macular afferents mediating tonic (slowly or non-adapting) response characteristics, sensory elements to which the VsEP test is not robustly sensitive (see further discussion below).
We also cannot rule out potential effects of meclizine at time periods beyond 80 min. This is unlikely, since meclizine’s action reportedly starts within about one hour following oral administration in humans (e.g., Skidgel et al. 2011).
The H4 Receptor Antagonist (JNJ7777120) and Vestibular Function
The effects of JNJ7777120 on the peripheral components of the VsEP, although modest in magnitude, were unique among the drugs studied here. The changes were clearly systematic and indicated that the drug acted primarily on peripheral vestibular elements rather than central macular relays. This result supports the hypothesis that H4 receptors act to modify activity of vestibular primary afferent neurons in intact mammals (Desmadryl et al. 2012; Wersinger et al. 2013).
Chabbert and colleagues showed in vitro that JNJ7777120 elicited reversible “inhibitory” effects evidenced by a reduction in the duration of primary afferent tonic discharge during a sustained step membrane depolarization (Desmadryl et al. 2012; Wersinger et al. 2013). Based on the results here, peripheral VsEP latency (P1) shortened, amplitude (P1-N1) increased, and threshold improved (decreased) following JNJ7777120 treatments. These findings together represent an enhancement of vestibular responses rather than inhibition/suppression. At first glance, the two findings appear to be contradictions. However, the following hypothesis provides a basis for considering the two observations as being entirely consistent.
The changes in the VsEP observed here suggest that JNJ7777120 administration leads to a more precise synchronization of vestibular afferent spike discharges in response to the onset of the transient stimulus. The temporal precision of post synaptic onset responses can be improved by reducing the time constant of terminal post synaptic dendrites (e.g., Rothman and Manis 2003). This would favor synchronous collective discharge during the activation of large numbers of primary afferent neurons thus increasing the precision of population activation timing. Under these circumstances, a calyx-bearing vestibular primary afferent becomes more rapidly adapting less integrative and more responsive to transient stimulation while becoming less responsive to sustained (tonic) or slowly changing stimuli. To explain the effects of JNJ7777120 therefore, we first propose that JNJ7777120 acts on vestibular ganglion cells to shorten the membrane time constant by increasing membrane conductance in calyx-bearing ganglion dendrites. Although the specific mechanism of H4 receptor action remains undetermined, we can suggest candidate channels that could mediate such changes in dendrites and the VsEP.
Membrane Channel Candidates Mediating Conductance Changes
At the cellular level, JNJ7777120 transforms ganglion cell discharge behavior into more rapidly adapting patterns (Desmadryl et al. 2012; Wersinger et al. 2013). Kalluri and colleagues have shown that the relative magnitude of low-voltage-activated potassium currents (ILV) in vestibular primary afferent neurons can determine the cells spontaneous discharge regularity and corresponding spike discharge in response to dynamic and static stimulation (Kalluri et al. 2010; Ventura and Kalluri 2019). Several investigators have described similar changes by blocking components of ILV (Perez et al. 2009, 2010; Iwasaki et al. 2008; Kalluri et al. 2010). We therefore propose that JNJ7777120 acts to increase the conductance of ILV in calyx-bearing vestibular afferent neurons expressing the corresponding channels. This would decrease terminal afferent input impedance, decrease the time constant of post-synaptic membranes, shift the response of cells to a more rapidly adapting pattern with precise timing of onset activation. These changes would enhance VsEP responses by reducing latencies, increasing amplitudes and improving thresholds as observed in the current study. Similar effects on the VsEP have been reported recently for the drug retigabine (Lee et al. 2017), which activates (opens) KCNQ potassium channels contributing to ILV, thus increasing available ILV current. The simultaneous reduction in slowly adapting or tonic activity may be the key physiological change underlying a clinical benefit to such drugs. Similar actions of JNJ7777120 would explain our findings as well as those of Chabbert and coworkers (Desmadryl et al. 2012; Wersinger et al. 2013). This scenario implies that the H4 receptor normally acts to reduce ILV membrane currents thus leading to more slowly adapting spike patterns with increased tonic discharge in calyx-bearing afferents, a hypothesis requiring further testing. Hypothetically, JNJ7777120 counters H4 action.
The VsEP provides a general assessment of the macular neuroepithelium and this involves recording the collective action of large numbers of primary afferent neurons. In terms of the general neuroepithelial response characteristics with JNJ7777120 administration, the results suggest to us as noted that macular sensors become more sensitive to dynamic rapidly changing stimuli and less sensitive to steady or slowly changing events under the influence of JNJ7777120. The reduced sensitivity to slowly changing tonic stimuli is of special interest since this feature may be viewed as an “inhibition” or suppression of vestibular responses. This would seem to support the possible therapeutic potential of JNJ7777120. One prediction from these findings is that JNJ7777120 administration will reduce the gain of vestibulo-ocular counter rolling and possibly angular vestibular ocular reflexes (VOR) by reducing the number of cells responding to slowly changing head motions. Although the precise mechanism of action of JNJ7777120 is not yet clear, promising candidate potassium channels that could mediate these effects have been identified including DTX-sensitive Kv1 channels (e.g., Iwasaki et al. 2008) and XE991-sensitive Kv7 (KCNQ) channels (e.g., Kalluri et al. 2010; Perez et al. 2009, 2010) in the vestibular neuroepithelium.
Our findings indicate that the commonly prescribed medications, meclizine and diazepam act to some extent to alter peripheral vestibular macular function but diazepam also acts effectively centrally to exert its suppressive effects. It is argued that the novel pharmacological agent, JNJ7777120, acts in the periphery by enhancing macular responses to transient rapidly changing stimuli and reducing the responses to tonic slowly changing stimuli.
Funding
This work was supported by the American Academy of Audiology Foundation, the Nebraska Tabacco Settlement Biomedical Research Foundation, and the Department of Special Education and Communication Disorders (SECD), University of Nebraska-Lincoln (UNL). This work was completed in partial fulfillment of the requirements for the Ph.D. degree (CL) in the Department of SECD, UNL.
Declarations
Ethics Approval
All experimental procedures were approved by the institutional animal care and use committee (IACUC) at University of Nebraska-Lincoln and undertaken in accordance with NIH guidelines.
Conflict of Interest
The authors declare no competing interests.
Footnotes
Publisher's Note
Springer Nature remains neutral with regard to jurisdictional claims in published maps and institutional affiliations.
Contributor Information
Choongheon Lee, Email: choongheon_lee@urmc.rochester.edu.
Timothy A. Jones, Email: timothy.jones@unl.edu
References
- Adamec RE, McNaughton B, Racine R, Livingston KE. Effects of diazepam on hippocampal excitability in the rat: action in the dentate area. Epilepsia. 1981;22(2):205–215. doi: 10.1111/j.1528-1157.1981.tb04103.x. [DOI] [PubMed] [Google Scholar]
- Baloh RW, Kerber K. Clinical Neurophysiology of the Vestibular System. 4. Oxford: Oxford University Press; 2011. [Google Scholar]
- Bobbin RP, Bledsoe SC Jr, Winbery SL, & Jenison GL (1985) Actions of putative neurotransmitters and other relevant compounds on Xenopus laevis lateral line. Auditory Biochemistry, 102–122
- Brayton CF. Dimethyl sulfoxide (DMSO): a review. Cornell Vet. 1986;76(1):61–90. [PubMed] [Google Scholar]
- Budavari S, O’Neil MJ, Smith A, Heckelman PE, Kinneary JF, editors. The Merck Index, 12th Edition (p. 551) Whitehouse Station, NJ: Merck Research Laboratories; 1996. [Google Scholar]
- Curthoys IS, Burgess AM, Goonetilleke SC. Phase-locking of irregular guinea pig primary vestibular afferents to high frequency (> 250 Hz) sound and vibration. Hear Res. 2019;373:59–70. doi: 10.1016/j.heares.2018.12.009. [DOI] [PubMed] [Google Scholar]
- Chovan JP, Klett RP, Rakieten N. Comparison of meclizine levels in the plasma of rats and dogs after intranasal, intravenous, and oral administration. J Pharm Sci. 1985;74(10):1111–1113. doi: 10.1002/jps.2600741022. [DOI] [PubMed] [Google Scholar]
- Daina A, Michielin O, Zoete V. SwissADME: a free web tool to evaluate pharmacokinetics, drug-likeness and medicinal chemistry friendliness of small molecules. Sci Rep. 2017;7:42717. doi: 10.1038/srep42717. [DOI] [PMC free article] [PubMed] [Google Scholar]
- Desmadryl G, Gaboyard-Niay S, Brugeaud A, Travo C, Broussy A, Saleur A, Chabbert C. Histamine H4 receptor antagonists as potent modulators of mammalian vestibular primary neuron excitability. Br J Pharmacol. 2012;167(4):905–916. doi: 10.1111/j.1476-5381.2012.02049.x. [DOI] [PMC free article] [PubMed] [Google Scholar]
- Ehrenberger K, Benkoe E, Felix D. Suppressive action of picrotoxin, a GABA antagonist, on labyrinthine spontaneous nystagmus and vertigo in man. Acta Otolaryngol. 1982;93(1–6):269–273. doi: 10.3109/00016488209130882. [DOI] [PubMed] [Google Scholar]
- Foster JD, Drescher MJ, Drescher DG. Immunohistochemical localization of GABAA receptors in the mammalian crista ampullaris. Hear Res. 1995;83(1–2):203–208. doi: 10.1016/0378-5955(95)00006-P. [DOI] [PubMed] [Google Scholar]
- Gaines GC. Generators of mammalian vestibular surface responses to head motion (Doctoral dissertation) Greenville, NC: East Carolina University; 2012. [Google Scholar]
- Greenblatt DJ, Divoll M. Diazepam versus lorazepam: relationship of drug distribution to duration of clinical action. Adv Neurol. 1982;34:487–491. [PubMed] [Google Scholar]
- Haas HL, Sergeeva OA, Selbach O. Histamine in the nervous system. Physiol Rev. 2008;88(3):1183–1241. doi: 10.1152/physrev.00043.2007. [DOI] [PubMed] [Google Scholar]
- Highstein SM, Holstein GR. The anatomy of the vestibular nuclei. Prog Brain Res. 2006;151:157–203. doi: 10.1016/S0079-6123(05)51006-9. [DOI] [PubMed] [Google Scholar]
- Hill SJ. Distribution, properties, and functional characteristics of three classes of histamine receptor. Pharmacol Rev. 1990;42(1):45–83. [PubMed] [Google Scholar]
- Hironaka T, Fuchino K, Fujii T. Absorption of diazepam and its transfer through the blood-brain barrier after intraperitoneal administration in the rat. J Pharmacol Exp Ther. 1984;229(3):809–815. [PubMed] [Google Scholar]
- Holt JC, Lysakowski A, Goldberg JM. The efferent vestibular system. In: Ryugo DK, Fay RR, Popper AN, editors. Auditory and Vestibular Efferents. New York: Springer; 2011. pp. 134–186. [Google Scholar]
- Housley GD, Norris CH, Guth PS. Histamine and related substances influence neurotransmission in the semicircular canal. Hear Res. 1988;35(1):87–97. doi: 10.1016/0378-5955(88)90043-3. [DOI] [PubMed] [Google Scholar]
- Hucker HB, Ahmad PM, Miller EA. Absorption, distribution and metabolism of dimethylsulfoxide in the rat, rabbit and guinea pig. J Pharmacol Exp Ther. 1966;154(1):176–184. [PubMed] [Google Scholar]
- Iwasaki S, Chihara Y, Komuta Y, Ito K, Sahara Y. Low-voltage-activated potassium channels underlie the regulation of intrinsic firing properties of rat vestibular ganglion cells. J Neurophysiol. 2008;100(4):2192–2204. doi: 10.1152/jn.01240.2007. [DOI] [PubMed] [Google Scholar]
- Jahnke K. The blood-perilymph barrier Archives of oto-rhino-laryngology. 1980;228(1):29–34. doi: 10.1007/BF00455891. [DOI] [PubMed] [Google Scholar]
- Jones SM, Erway LC, Bergstrom RA, Schimenti JC, Jones TA. Vestibular responses to linear acceleration are absent in otoconia-deficient C57BL/6JEi-het mice. Hear Res. 1999;135(1):56–60. doi: 10.1016/S0378-5955(99)00090-8. [DOI] [PubMed] [Google Scholar]
- Jones SM, Erway LC, Johnson KR, Yu H, Jones TA. Gravity receptor function in mice with graded otoconial deficiencies. Hear Res. 2004;191(1):34–40. doi: 10.1016/j.heares.2004.01.008. [DOI] [PubMed] [Google Scholar]
- Jones TA, Jones SM. Short latency compound action potentials from mammalian gravity receptor organs. Hear Res. 1999;136:75–85. doi: 10.1016/S0378-5955(99)00110-0. [DOI] [PubMed] [Google Scholar]
- Jones TA, Jones SM, Vijayakumar S, Brugeaud A, Bothwell M, Chabbert C. The adequate stimulus for mammalian linear vestibular evoked potentials (VsEPs) Hear Res. 2011;280(1):133–140. doi: 10.1016/j.heares.2011.05.005. [DOI] [PMC free article] [PubMed] [Google Scholar]
- Jones TA, Lee C, Gaines GC, Grant JW. On the high frequency transfer of mechanical stimuli from the surface of the head to the macular neuroepithelium of the mouse. J Assoc Res Otolaryngol. 2015;16(2):189–204. doi: 10.1007/s10162-014-0501-9. [DOI] [PMC free article] [PubMed] [Google Scholar]
- Jones TA, Stockard JJ, Weidner W. The effects of temperature and acute alcohol intoxication on brain stem auditory evoked potentials in the cat. Electroencephalogr Clin Neurophysiol. 1980;49(1):23–30. doi: 10.1016/0013-4694(80)90348-X. [DOI] [PubMed] [Google Scholar]
- Jones TA. Vestibular short latency responses to pulsed linear acceleration in unanesthetized animals. Electroencephalogr Clin Neurophysiol. 1992;82(5):377–386. doi: 10.1016/0013-4694(92)90007-5. [DOI] [PubMed] [Google Scholar]
- Juhn SK, Hunter BA, Odland RM. Blood-labyrinth barrier and fluid dynamics of the inner ear. Int Tinnitus J. 2001;7(2):72–83. [PubMed] [Google Scholar]
- Kalluri R, Xue J, Eatock RA. Ion channels set spike timing regularity of mammalian vestibular afferent neurons. J Neurophysiol. 2010;104(4):2034–2051. doi: 10.1152/jn.00396.2010. [DOI] [PMC free article] [PubMed] [Google Scholar]
- Kiss R, Keseru GM. Histamine H4 receptor ligands and their potential therapeutic applications: an update. Expert Opin Ther Pat. 2012;22(3):205–221. doi: 10.1517/13543776.2012.665447. [DOI] [PubMed] [Google Scholar]
- Kiss R, Keseru GM. Novel histamine H4 receptor ligands and their potential therapeutic applications: an update. Expert Opin Ther Pat. 2014;24(11):1185–1197. doi: 10.1517/13543776.2014.959494. [DOI] [PubMed] [Google Scholar]
- Kitahara T, Takeda N, Ohno K, Araki T, Kubo T, Kiyama H. Expression of GABAA receptor γ1 and γ2 subunits in the peripheral vestibular system of the rat. Brain Res. 1994;650(1):157–160. doi: 10.1016/0006-8993(94)90220-8. [DOI] [PubMed] [Google Scholar]
- Kolb KH, Jaenicke G, Kramer M, Schulze PE. Absorption, distribution and elimination of labeled dimethyl sulfoxide in man and animals. Ann N Y Acad Sci. 1967;141(1):85–95. doi: 10.1111/j.1749-6632.1967.tb34869.x. [DOI] [PubMed] [Google Scholar]
- Lacour M, Sterkers O. Histamine and betahistine in the treatment of vertigo. CNS Drugs. 2001;15(11):853–870. doi: 10.2165/00023210-200115110-00004. [DOI] [PubMed] [Google Scholar]
- Lee C, Holt JC, Jones TA. The effect of M-current modulation on mammalian vestibular responses to transient head motion. J Neurophysiol. 2017;118(6):2991–3006. doi: 10.1152/jn.00384.2017. [DOI] [PMC free article] [PubMed] [Google Scholar]
- Lee C, Jones TA. Neuropharmacological targets for drug action in vestibular sensory pathways. Journal of audiology & otology. 2017;21(3):125–132. doi: 10.7874/jao.2017.00171. [DOI] [PMC free article] [PubMed] [Google Scholar]
- Lee C, Jones TA. Effects of ketamine compared with urethane anesthesia on vestibular sensory evoked potentials and systemic physiology in mice. J Am Assoc Lab Anim Sci. 2018;57(3):268–277. doi: 10.30802/AALAS-JAALAS-17-000131. [DOI] [PMC free article] [PubMed] [Google Scholar]
- Matsuoka I, Ito J, Takahashi H, Sasa M, Takaori S. Experimental vestibular pharmacology: a minireview with special reference to neuroactive substances and antivertigo drugs. Acta Otolaryngol. 1985;419:62–70. doi: 10.1080/00016489.1985.12005655. [DOI] [PubMed] [Google Scholar]
- Mehdi T. Benzodiazepines revisited. British Journal of Medical Practitioners. 2012;5(1):501. [Google Scholar]
- Meza G. Modalities of GABA and glutamate neurotransmission in the vertebrate inner ear vestibule. Neurochem Res. 2008;33(8):1634–1642. doi: 10.1007/s11064-008-9734-5. [DOI] [PubMed] [Google Scholar]
- Mihic SJ, Harris RA. Hypnotics and Sedatives. In: Brunton LL, Chabner BA, Knollman B, editors. Goodman & Gilman's the Pharmacological Basis of Therapeutics. 12. New York: McGraw-Hill Companies; 2011. pp. 458–468. [Google Scholar]
- Nazareth AM, Jones TA. Central and peripheral components of short latency vestibular responses in the chicken. J Vestib Res. 1998;8(3):233–252. doi: 10.3233/VES-1998-8305. [DOI] [PubMed] [Google Scholar]
- Pérez C, Limón A, Vega R, Soto E. The muscarinic inhibition of the potassium M-current modulates the action-potential discharge in the vestibular primary-afferent neurons of the rat. Neuroscience. 2009;158(4):1662–1674. doi: 10.1016/j.neuroscience.2008.11.023. [DOI] [PubMed] [Google Scholar]
- Pérez C, Vega R, Soto E. Phospholipase C-mediated inhibition of the M-potassium current by muscarinic-receptor activation in the vestibular primary-afferent neurons of the rat. Neurosci Lett. 2010;468(3):238–242. doi: 10.1016/j.neulet.2009.11.004. [DOI] [PubMed] [Google Scholar]
- Plumb DC. Plumb’s Veterinary Drug Handbook. 6. Stockholm, WI: Pharma Vet Inc.; 2008. [Google Scholar]
- Pettorossi VE, Troiani D, Petrosini L. Diazepam enhances cerebellar inhibition on vestibular neurons. Acta Otolaryngol. 1982;93(1–6):363–373. doi: 10.3109/00016488209130894. [DOI] [PubMed] [Google Scholar]
- Rothman JS, Manis PB. The roles potassium currents play in regulating the electrical activity of ventral cochlear nucleus neurons. J Neurophysiol. 2003;89(6):3097–3113. doi: 10.1152/jn.00127.2002. [DOI] [PubMed] [Google Scholar]
- Schwartz JC, Arrang JM, Garbarg M, Pollard H. A third histamine receptor subtype: characterisation, localisation and functions of the H3-receptor. Agents Actions. 1990;30(1–2):13–23. doi: 10.1007/BF01968988. [DOI] [PubMed] [Google Scholar]
- Schwartz MA, Koechlin BA, Postma E, Palmer S, Krol G. Metabolism of diazepam in rat, dog, and man. J Pharmacol Exp Ther. 1965;149(3):423–435. [PubMed] [Google Scholar]
- Simmons MA. Pharmacology an Illustrated Review. New York: Thieme Medical Publishers; 2012. General principles of pharmacology; pp. 82–84. [Google Scholar]
- Skidgel RA, Kaplan AP, Erdos EG. Histamine, Bradykinin, and Their Antagonists. In: Brunton LL, Chabner BA, Knollman B, editors. Goodman & Gilman's the Pharmacological Basis of Therapeutics. 12. New York: McGraw-Hill Companies; 2011. pp. 911–935. [Google Scholar]
- Thurmond RL, Desai PJ, Dunford PJ, Fung-Leung WP, Hofstra CL, Jiang W, Edwards JP. A potent and selective histamine H4 receptor antagonist with anti-inflammatory properties. J Pharmacol Exp Ther. 2004;309(1):404–413. doi: 10.1124/jpet.103.061754. [DOI] [PubMed] [Google Scholar]
- Tomoda K, Nagata M, Harada N, Iwai H, Yamashita T. Effect of histamine on intracellular Ca2+ concentration in guinea pig isolated vestibular hair cells. Acta Otolaryngol Suppl. 1997;528:37–40. [PubMed] [Google Scholar]
- Tritto S, Botta L, Zampini V, Zucca G, Valli P, Masetto S. Calyx and dimorphic neurons of mouse scarpa's ganglion express histamine H3 receptors. BMC Neurosci. 2009;10(1):70. doi: 10.1186/1471-2202-10-70. [DOI] [PMC free article] [PubMed] [Google Scholar]
- Ventura CM, Kalluri R. Enhanced activation of HCN channels reduces excitability and spike-timing regularity in maturing vestibular afferent neurons. J Neurosci. 2019;39(15):2860–2876. doi: 10.1523/JNEUROSCI.1811-18.2019. [DOI] [PMC free article] [PubMed] [Google Scholar]
- Wang Z, Lee B, Pearce D, Qian S, Wang Y, Zhang Q, Chow MS. Meclizine metabolism and pharmacokinetics: formulation on its absorption. J Clin Pharmacol. 2012;52(9):1343–1349. doi: 10.1177/0091270011414575. [DOI] [PubMed] [Google Scholar]
- Wersinger E, Gaboyard-Niay S, Travo C, Soto E, Baez A, Vega R, & Chabbert C (2013) Symptomatic treatment of vestibular deficits: Therapeutic potential of histamine H4 receptors. Journal of Vestibular Research, 23(3):153-159 [DOI] [PubMed]
- Woods SW, & Charney DS (1988) Benzodiazepines. A review of benzodiazepine treatment of anxiety disorders: pharmacology, efficacy and implications for pathophysiology. In Last, C. G., & Hersen, M. (Eds.), Handbook of Anxiety Disorders (pp. 413–444). New York: Pergamon Press
- Zhang J, Han XH, Li HZ, Zhu JN, Wang JJ. Histamine excites rat lateral vestibular nuclear neurons through activation of post-synaptic H2 receptors. Neurosci Lett. 2008;448(1):15–19. doi: 10.1016/j.neulet.2008.10.027. [DOI] [PubMed] [Google Scholar]