

Abstract
Background and aim:
Dysregulation of glucose metabolism is a common complication of transfusions in Transfusion Dependent Thalassemia (TDT) patients. For early diagnosis of glucose disturbances, screening is recommended. The age of starting and the type of screening vary; the more common methods are assessment of RPG, FPG, 2h PG and 2 hours OGTT. The combined assessment of glucose tolerance and insulin response during OGTT is rarely recommended. The main objective of the study is the evaluation of simultaneous assessment of Glucose Tolerance (GT) and Insulin Response (IR) during OGTT in patients with TDT.
Methods:
43 TDT patients aged 12-28years, without clinical evidence of glucose disturbances, were randomly selected for the study. The 2-hour OGTT in 30 minutes intervals was applied. Plasma glucose and insulin were assessed in all samples using routine laboratory methods.
Results:
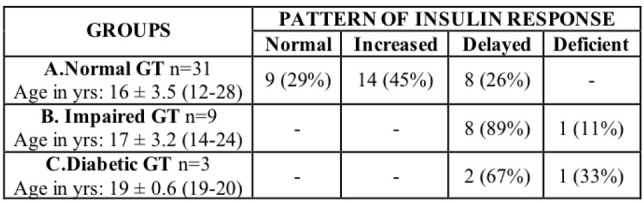
Of 43 patients 31(72%) had Normal GT; of them 9 (29%) had normal insulin response (NIR), 14 (45%) high IR and 8(26%) delayed peak IR. Delayed peak IR was found in 8 of the 9 patients with Impaired GT and in 2 of the 3 with diabetic GT. Deficient IR (hypoinsulinemia) was found in two patients.
Conclusions:
Simultaneous assessment of GT and IR during OGTT in TDT patients, seems to be a most sensitive and creditable screening test for early diagnosis of glucose disturbances. High IR and delayed peak IR in normoglycemic patients are valuable indices for diagnosis of the pre-diabetic state that precede the development of glucose disturbances in TDT patients and start proper follow and management. (www.actabiomedica.it).
Keywords: β-thalassemia, Glucose metabolism, OGTT, Insulin resistance
Introduction
Intensive therapy with frequent transfusions and chelation in patients with Thalassemia Major (TM) increased survival and improved patients’ quality of life. However, transfusions cause a series of complications of which the more common are related to iron overload. One of the complications of iron overload is the dysregulation of glucose metabolism. The pathogenetic mechanisms are not yet clearly defined, but the toxic effects of iron on pancreatic β- cells is certainly crucial (1, 2). Disturbances of glucose metabolism in TDT children start by the end of the first decade. After the first decade of life, the prevalence and severity of glucose disturbances increase gradually and are positively related to age and annual blood consumption and negatively to compliance with chelation therapy (3, 4).
Meta-analysis evaluation of 44 studies with 16,605 TDT patients, screened mainly by OGTT reported a high prevalence of Impaired Fasting Glucose (IFG), Impaired Glucose Tolerance (IGT), and Diabetic Glucose Tolerance (Diabetic GT) of 17.2 %, 12.4 % and 6.5 % respectively. The prevalence of glucose disturbances varied widely in these studies and were positively related to age and iron overload (5).
The current practice in following TDT patients above the age of 10 years, is to screen annually for glucose disturbances with main objectives the early diagnosis and treatment of disturbances. The screening strategy for abnormalities of glucose metabolism in TDT patients varies widely as regard to the methods, the age of starting and the intervals between screening. The most commonly used methods for screening are the random plasma glucose (RPG), fasting plasma glucose (FPG), 2hours post-prandial glucose (2h- PG), and 2 hours oral glucose tolerance test (OGTT) (6). There are also wide variations for the age of starting screening as well for the rate of testing recommended by international and national committees. In an ICET-A report, a table summarizing the recommendations of the most active relative committees is included (7). However, in clinical practice this is not rare. None of the committees, recommends (even optional) glucose tolerance (GT) combined with insulin response (IRsp) during OGTT.
To our knowledge publications on the patterns of insulin response during OGTT in TDT patients are not frequently reported.
In this study we report and analyze the data on the disturbances of glucose homeostasis in 43 TDT children and young people, evaluating the sensitivity and credibility of combined glucose tolerance and insulin response during OGTT for early diagnosis and management of glucose disturbances in TDT young patients.
Patients and Methods
A total of 43 transfusion dependent children and young people with TM aged 12-20 years (except 3, aged 24, 24 and 28 years), without any clinical evidence of glucose dysregulation were studied. The patients were on long term follow and treatment in our Unit and were randomly selected for this study on the combined glucose and insulin response during OGT testing. All patients followed the national protocol of treatment, receiving blood transfusions with 8-10 ml/kg/BW packed red cells infused slowly, in intervals of 2-3 weeks and chelation treatment with desferrioxamine (DFO) 40-50 mg/kg/BW subcutaneously, based on the daily input of transfusional iron.
The study was designed to evaluate if there are advantages of combined assessment of glucose tolerance and insulin response during OGTT in screening TDT patients for early diagnosis and management of disturbances of glucose metabolism.
In all patients the glucose tolerance (GT) and insulin response (IRsp) were simultaneously assessed during OGTT. The patients received 1.75 g/kg /BW (maximum dose 75g) of 33 % concentration of glucose after an overnight fast. Venous blood samples for glucose and insulin determination were obtained right after oral glucose consumption and at intervals of 30 minutes up to 2 hours. Plasma glucose and insulin were assessed by routine laboratory methods; the glucose oxidase method for plasma glucose and radioimmunoassay commercially available kits, for plasma insulin.
Based on the results of OGTT patients were classified in the following groups according to the criteria of American Diabetes Association(8):
Normal glucose tolerance (NGT) = Fasting Plasma Glucose (FPG) ≤ 100ml/dl (≤ 5.6 mmol/L) and 2h PG <140mg/dl (<7.8mmol/L).
Impaired glucose tolerance (IGT) = FPG >110 mg/dl (>6.1 mmol/L) and 2 h PG > 140 mg/dl (>7.8 mmol/L) up to 199 mg/dl (11.1 mmol/L).
Diabetic glucose tolerance (DGT) or Diabetes Mellitus (DM) = FPG > 126 mg/dl (>7.8 mmol/L) and 2 h PG ≥200mg/dl (>11, 1 mmol/L.)
Based on the changes in insulin secretion (IS) levels during OGTT in TDT patients, corresponding to pancreatic insulin reserves, patients were assigned in the four distinct patterns (types), used in our unit:
i) Normal insulin secretion (NIS); ii) High insulin secretion (HIS)-hyperisulinaemia (assessed on fasting plasma insulin secretion (FPIS) levels, fasting plasma glucose levels and HOMA-IR (> 3.5); iii) Delayed insulin secretion (DIS) based on the time of peak insulin (at 60’and 90’) and levels >35μU/ml); and iv) Deficient or Low insulin secretion (LIS) with all insulin values during OGTT <30 μU/ml).
This classification is rather arbitrary, but considering the limited information on changes of insulin response during OGTT in TDT patients at this period, proved valuable.
A number of studies relative to normal insulin response after an oral glucose dose or during OGTT in healthy children and adolescents have been published. Elrick et al described a new method for evaluating glucose metabolism using an oral glucose load (9) while Reaven et al described the role of insulin resistance and insulin secretion in evaluating the results of OGTT in normal individuals (10). Other studies assessed the pediatric reference values for insulin from OGTT and the prevalence of hyperinsulinenia in obese children (11, 12) .
Statistical Analysis
For our analysis, data are presented as means ± standard deviation. For the comparison between two groups, unpaired parametric t-tests were used. P values <0.05 were considered significant. Statistical analysis was performed and graphs were created using graphpad Prism version 8.
Ethics.
The Ethic Committee of Aghia Sophia Children Hospital approved permission for medical review, waiver of informed consent and anonymous publication of data, collected for routine diagnostic and treatment procedures, according to the Declaration of Helsinki.
Results
The classification of 43 TDT patients based on the results of glucose tolerance and insulin response (secretion) in relation to age, are summarized in Table 1.
Table 1.
Classification of 43 TDT patients based on the evaluation of glucose tolerance and insulin response results during OGTT. Relation to age.
|
Of 43 patients 31(72 %) had NGT; 9(21 %) IGT; and 3(7 %) diabetic GT. The severity and prevalence of glucose intolerance seems to increase with age.
The analytical data (mean + SD) of glucose tolerance during OGTT in 43 patients are summarized in table 2, and illustrated in figure 1, while the relative data on insulin response (secretion) are presented in table 3 and figure 2.
Table 2.
Plasma glucose levels (mean ± SD) in mmol/L during OGTT in the three groups (NGT, IGT, Diabetic GT) of 43 TDT patients.

|
Figure 1.

Pattern of plasma glucose changes during OGTT in three groups of Glucose Tolerance (Normal, Impaired and diabetic) in 43 TDT patients.
Table 3.
Plasma insulin levels (mean ± SD) in μU/ml during OGTT in the four insulin response (secretion) patterns, in 43 TDT patients. I. Normal, II. High (Increased), III. Delayed, IV. Deficient.

|
Figure 2.

Pattern of plasma insulin changes during OGTT in the four types of insulin response: I. Normal, II. High (Increased), III. Delayed and IV. Deficient, in 43 TDT patients
The most interesting finding in this series of young patients with thalassemia is the wide changes in the pattern of insulin secretion in the group of patients with normal glucose tolerance. Only 9 (29 %) had normal insulin secretion pattern, while 14 (45 %) had high insulin secretion (hyper- secretion) and 8 (26 %) had delayed peak insulin secretion (response) pattern. On the other hand none of the patients with impaired or diabetic glucose tolerance had normal or increased insulin secretion; the majority of patients (8/9) with impaired glucose tolerance and 2/3 with diabetic glucose tolerance had delayed peak insulin response with a peak insulin level above 30μU/ml, at 90 minutes. Only one patient from each of the last two groups had low insulin secretion with insulin peak levels below 30 μU/ml (hypoinsulinemia) (Table 3, figure 2).
Of interest is the fact that in the delayed peak insulin secretion pattern, the fasting and peak plasma insulin levels in patients with normal glucose tolerance, are lower compared to those with impaired and diabetic glucose tolerance. HOMA-IR homeostatic assessment in the delayed insulin pattern is normal (2.55) in NGT patients and high (4.12) in IGT patients; these findings indicate that the delayed peak insulin pattern consists of two subtypes, the one, in patients with NGT has normal insulin secretion and the other (the more severe) in patients with IGT has high-resistant insulin secretion (HOMA-IR 4.12) and is combined with impaired and diabetic GT disturbances. Furthermore, comparing the peak levels of insulin between the two subtypes, it was found that the patients with IGT had statistically significant higher insulin levels (p=0.0017), with the peak of insulin secretion occurring at 90 minutes versus 60 minutes in the milder subtype in normoglycaemic patients.
Discussion
It is well documented that carbohydrate tolerance declines with age in apparently normal individuals leading to a progressive rise of blood glucose. Disturbances of glucose homeostasis vary from increased insulin resistance and mild glucose intolerance to overt diabetes mellitus (3). In TDT patients, glucose intolerance has been showed to start by the end of the first decade of life and since then, glucometabolic status is characterized by a deterioration of glucose tolerance over time. The rate of deterioration is related to several factors (8). A retrospective study on a group of 82 TDT patients aged 13-16 years followed annually with OGTT for 10 years showed that the prevalence of IGT increased progressively from 13,4 % to 39 % over the first 4 years remaining constant over the following 6 years after intensification of chelation. Diabetes on the other hand had a very low prevalence of 0.5 % at baseline rising to 2.4 % by the age of 21-24 years(13). Thus, it is recommended that all TDT patients be screened annually for disturbances of glucose metabolism.
As stated, extensive studies on the type and prevalence of glucose disturbances in TDT patients had been published for a wide range of populations, screened by various methods (5). The extreme differences reported for the type and prevalence of glucose disturbances are basically due to the wide variation of cohorts in regard to age, severity of clinical phenotype, compliance to treatment, degree of iron over load and others (3). The more frequent methods of screening were, and still are, the assessment of random plasma glucose (RPG), fasting plasma glucose (FPG), 2 hours post prandial, and OGTT (7).
In contrast, data on disturbances in insulin secretion during OGTT analyzing the patterns of insulin response in TDT patients, to our knowledge are limited. Most data reported on disturbances of insulin secretion concern studies with Intravenous Glucose Tolerance Test (IVGTT) on normal individuals.
Intravenous glucose tolerance and plasma insulin response studied in 27 children with TM less than 11 years of age and 10 health controls of comparable age showed: i) no differences in fasting plasma glucose and insulin levels between the two groups. ii) Differences were found at 10 and 20 minutes of intravenous glucose administration both in glucose levels (considerably higher) and insulin levels (considerably lower) in thalassemic children. iii) Evidence of depression of pancreatic function was found in 6 of 27 thalassemic children(14). In contrast in another study on insulin resistance and β-cell function in 36 chronically transfused children aged 8-15 years no disturbances were found (15). This may be due to mild clinical phenotypes of patients as well as to differences in transfusions rate and in the annual consumption of blood.
In a study on 24 adult patients with thalassemia major, statistically highly significant differences of increased fasting glucose levels and reduced pancreatic β-cell insulin secretion at fasting state (estimated by SC- HOMA) were found in thalassemic patients compared to healthy controls (16).
In an interesting study, Glucose, Insulin and C peptide levels during OGTT were assessed in 36 thalassemic patients (22 with NGT, 6 with IGT and 7 with diabetic GT) and 32 healthy controls. During OGTT, patients with IGT presented with hyperinsulenemia and delayed peak insulin. The C-peptide/insulin ratio was reduced in patients with impaired glucose tolerance compared to controls. Insulin sensitivity was significantly reduced in patients with impaired or diabetic glucose tolerance compared to healthy controls (17).
The results of our study, clearly demonstrated that in the group of 43 TDT children and young people aged 12-20 years (except of three older patients) with a moderate degree of iron over load (ferritin ranging between 1,000- 3,000 ng/ml) and BMI within normal range for age and sex, the prevalence of patients with NGT was 72 % (31/43), with IGT 21 % (9/43) and with diabetic GT 7 % (3/43). More interesting were the findings of insulin response (secretion) during OGGT and especially among the 31 patients with normal glucose tolerance. In this group only 9 (29 %) patients had normal insulin levels while in the remaining, insulin secretion was impaired; 14 patients had hyper secretion of insulin (insulin resistance), 8 had delayed peak insulin but no one had deficient insulin secretion (hypoinsulinemia). In contrast none of the patients with impaired and diabetic glucose tolerance, had normal or high insulin secretion. All patients with IGT had delayed peak insulin response (with insulin levels above 35 μU/ml) except one with deficient insulin response (hypoinsulinemia).
The most interesting finding in our study was the differences in the levels of insulin secretion in the delayed type of insulin response, between patients with NGT and patients with IGT or Diabetic GT. The fasting insulin levels of patients with delayed insulin response were lower in patients with NGT compared to those with IGT but statistically non significant (p=0.09) while the homeostatic model assessment of insulin resistance (HOMA-IR) was normal (2.54) in patients with NGT and high (4.12) in patients with IGT (18). Furthermore, in patients with IGT the peak levels of insulin were significantly higher (p=0.0017) occurring at 90 minutes versus 60 minutes for normoglycemic patients. These differences indicate that the delayed response pattern consists of two subtypes; the mild in normoglycemic patients and the severe in patients with glucose disturbances.
The data obtained from the evaluation of glucose tolerance and insulin response during OGTT are of great importance since these data, combined with our clinical experience in managing patients with thalassemia and glucose disturbances, can assist in guiding therapeutic interventions. More precisely, based on these results, we suggest that patients with delayed insulin response and especially those with high secretion of insulin and normoglycemia, would benefit from diet and exercise alone as a measure to delay the development of irregularities in glucose metabolism. On the contrary, those with impaired or diabetic GT and delayed peak insulin would benefit more from the administration of oral hypoglycemics, in addition to diet and exercise. In our experience, in these patients oral hypoglycemics postponed development of insulin dependent diabetes for many years (19).
Undoubtedly, the preliminary findings of this study have limitations and for confirmation further studies on a larger group of patients and with more precise evaluation of changes of insulin response during OGTT are needed. The main limitations concern the small cohort of young patients, the arbitrary staging of insulin response changes and the non-consideration of the interaction with factors influencing glucose metabolism, as BMI for healthy individuals and degree of iron overload and liver function for transfused patients with thalassemia.
In conclusion the results of this study, showed clearly, that the assessment of glucose tolerance parallel to insulin response during OGTT increases its sensitivity for early diagnosis of pre-diabetic state, preceding the development of glucose disturbances and lead to proper follow up and management, that can delay the development of insulin dependent diabetes mellitus in TDT patients. To this end changes in insulin secretion, as the high secretion of resistant insulin and the delayed peak insulin response in normoglycemic patients are predictors indices for the development of impaired glucose tolerance in TDT children and young people without clinical symptoms of glucose dysregulation.
Acknowledgements:
The authors thanks Professor Vincenzo De Sanctis for valuable advices.
Conflict of Interest:
Each author declares that he or she has no commercial associations (e.g. consultancies, stock ownership, equity interest, patent/licensing arrangement etc.) that might pose a conflict of interest in connection with the submitted article
References
- De Sanctis V, Soliman AT, Yassin M. Iron load and glucose metabolism in subjects with β-thalassemia major. Αn overview. Curr Diabetes Reν. 2012;9:332–341. doi: 10.2174/1573399811309040005. [DOI] [PubMed] [Google Scholar]
- Dmochowski K, Finewood D, Francobe W, Tyler B, Zinman B. Factors determining glucose tolerance in thalassemia. J Clin Endocrino Metab. 1993;77:448–447. doi: 10.1210/jcem.77.2.8345055. [DOI] [PubMed] [Google Scholar]
- De Sanctis V, Soliman AT, Elsedfy H, et al. Diabetes and glucose metabolism in thalassemia major. An update. Expert Rev Hematolog. 2016;9:401–408. doi: 10.1586/17474086.2016.1136209. [DOI] [PubMed] [Google Scholar]
- Mowla A, Karimi M, De Sanctis V. Prevalence of diabetes mellitus and impaired glucose in β-thalassemia patients with or without hepatis C virus. Pediatr Endocrinol Rev. 2004;(Suppl 2):282–284. [PubMed] [Google Scholar]
- He LN, Chen W, Yang Y, et al. Prevalence of abnormal glucose metabolism and other endocrine disorders in patients with β-Thalassemia Major. A meta analysis. Biomed Res Int. 2019 April 18;2019 doi: 10.1155/2019/6573497. 2019:6573497. Doi 10.1155/2019/6573497. [DOI] [PMC free article] [PubMed] [Google Scholar]
- De Sanctis V, Soleman AT, Daar S, et al. Detecting glucose related disturbances in patients with Transfusion Depended Thalassemia. From old to new concept. RIMA (Endo Thal) 2019;17(2):41–52. [Google Scholar]
- De Sanctis V, Soliman AT, Elsedfy H, et al. The ICET-A recommendations for the diagnosis and management of disturbances of glucose homeostasis in Thalassemia Major patient. Mediterr J Hematol Infect Dis. 2016;8:e2016058. doi: 10.4084/MJHID.2016.058. [DOI] [PMC free article] [PubMed] [Google Scholar]
- American Diabetes Association. Classification and diagnosis of Diabetes: Standards of Medical Care. Diabetes Care. 2020;43(Suppl 1):S14–S31. doi: 10.2337/dc20-S002. [DOI] [PubMed] [Google Scholar]
- Elrick H, Stimmler L, Hlad CJ, Arai Y., Jr Plasma insulin response and oral and intravenous glucose administration. J Endocrinol Metab. 1964;24:1076–1082. doi: 10.1210/jcem-24-10-1076. [DOI] [PubMed] [Google Scholar]
- Reaven GH, Brand RG, Ida Chen H-D, Mathur AS, Goldfine I. Insulin resistance and insulin secretion are determinants of oral glucose tolerance in normal individuals. Diabetes. 1993;42:1324–1332. doi: 10.2337/diab.42.9.1324. [DOI] [PubMed] [Google Scholar]
- Korner A, Scheuerman K, Neef M, et al. Pediatric reference values from OGTT and prevalence of hyperinsulinemia in obese children. ESPE. 2014;82 Abstracts FC12.4. [Google Scholar]
- Deschamps I, Giron BJ, Lestradet H. Blood insulin levels during oral glucose tolerance tests in the obese child. Influence of age, sex, degree and duration of obesity. Arch Fr Pediatr. 1975;32(3):247–257. [PubMed] [Google Scholar]
- Kattamis C, Ladis V, Tsousis D, Kalounenou I, Theodoridis C. Evolution of glucose intolerance and diabetes in transfused patients with thalassemia. Pediatr Endocrinol Rev. 2004;2(Suppl 2):267–271. [PubMed] [Google Scholar]
- Kattamis C, Theodoridis C, Kanavakis E. Intravenous glucose and plasma insulin in children with homozygous β-thalassemia. Aust Paediatr J. 1982;18:186–187. doi: 10.1111/j.1440-1754.1982.tb02024.x. [DOI] [PubMed] [Google Scholar]
- Suvarna J, Ingle H, Deshmukh CT. Insulin resistance and beta cell function in chronically transfused patients of thalassemia major. Indian Pediatr. 2006;43:393–400. [PubMed] [Google Scholar]
- Angelopulos NG, Zervas A, Livadas S, et al. Reduced insulin secretion in normoglycemic patients with beta thalassemia. Diabet Med. 2006;23:1327–1331. doi: 10.1111/j.1464-5491.2006.01988.x. [DOI] [PubMed] [Google Scholar]
- Cario H, Holl RW, Debatin KM, Kohn E. Insulin sensitivity and beta cell secretion in thalassemia major with secondary haemochromatosis: assessment by oral glucose tolerance test. Eur J Pediatrics. 2003;162:139–146. doi: 10.1007/s00431-002-1121-7. [DOI] [PubMed] [Google Scholar]
- Mathews DR, Hosker JP, Rundeski AS, et al. Homeostasis model assessment: insulin resistance and β-cell function from fasting plasma glucose and insulin concentration in man. Diabetologia. 1985;28:412–419. doi: 10.1007/BF00280883. [DOI] [PubMed] [Google Scholar]
- Ladis V, Theodoridis C, Palamidou F, Frisiras S, Berdousi H, Kattamis C. Glucose disturbances and regulation with glibenclamide in thalassemia. J Pediatr Endocrnol Metab. 1998;11(Suppl 3):871–877. [PubMed] [Google Scholar]