

Abstract
Living cells rely on a finely tuned symphony of inorganic ion gradients composed of both cations and anions. This delicate balance is maintained by biological receptors all acting in concert to selectively recognize and position ions for homeostasis. These dynamic processes can be intercepted and visualized with optical microscopy at the organismal, tissue, cellular and subcellular levels using fluorescent protein-based biosensors. Since the first report of such tool for calcium (Ca2+) in 1997, outstanding biological questions and innovations in protein engineering along with associated fields have driven the development of new biosensors for Ca2+ and beyond. In this Review, we summarize a workflow that can be used to generate fluorescent protein-based biosensors to study monoatomic ions in biology. To showcase the scope of this approach, we highlight recent advances reported for Ca2+ biosensors and in detail discuss representative case studies of biosensors reported in the last four years for potassium (K+), magnesium (Mg2+), copper (Cu2+/+), lanthanide (Ln3+) and chloride (Cl−) ions.
Keywords: ions, genetically encoded fluorescent biosensor, protein engineering, fluorescence imaging
Graphical abstract

Introduction
Inorganic ions are essential nutrients for all forms of life, found over a wide concentration range with varying physical properties such as size, shape and charge (Crichton, 2012). To maintain global ion homeostasis at the organismal, tissue, cellular and subcellular levels, biological receptors (i.e. transporters, chaperones, enzymes, nonproteinaceous ligands) have evolved to selectively recognize and position ions with spatial and temporal fidelity, thus requiring a high degree of thermodynamic and kinetic control (Crichton, 2012). Our understanding of these highly dynamic, yet orchestrated processes has been accelerated by combining biochemistry, cell biology and analytical techniques (e.g. ICP-MS/OES, ion-selective electrodes, X-ray fluorescence microscopy) with fluorescent biosensors. A fluorescent biosensor provides a readout of an ion binding event, which can be visualized in real-time in living samples using optical microscopy (Cox, 2019). Indeed, fluorescent biosensors can be based on chromophore-containing small molecules, nucleic acids, proteins and even combinations thereof. Our present discussion will be restricted to fluorescent protein-based biosensors for monoatomic ions. A general workflow to generate biosensors is outlined in Fig. 1A.
Fig. 1.

(A) General workflow to generate biosensors for monoatomic ions. (B)–(G) Fluorescent biosensors for monoatomic ions consist of ion binding domain (intrinsic and extrinsic) and fluorescent protein reporter modules that can be assembled using six different design strategies. (H) Chemical structures of representative chromophores in fluorescent proteins. Covalently bound chromophores are shown with dashed lines or conjugated to an amino acid from the protein. Abbreviations: FP, fluorescent protein; FRET, Förster resonance energy transfer; GFP, green fluorescent protein; PSB, protonated Schiff base; HBR, 4-hydroxybenzylidene rhodanine.
A biosensor design typically consists of two modules: an ion binding domain and a fluorescent protein reporter (Fig. 1B–G). The ion binding domain can be a naturally occurring or engineered biological receptor (extrinsic) or within the fluorescent reporter itself (intrinsic). The fluorescent protein reporter module is typically based on a derivative of green fluorescent protein (GFP) from Aequorea victoria, which has a tripeptide chromophore based on tyrosine (Fig. 1H) (Broch and Gautier, 2020). However, a fluorescent protein can also be defined as a protein that binds or interacts with a naturally occurring or chemically synthesized chromophore. Examples of such chromophores include flavin mononucleotide (FMN), the heme catabolic intermediate biliverdin, a protonated retinylidene Schiff base, 4-hydroxybenzylidene rhodanine analogs (HBR), and the Janelia Fluor 635 HaloTag ligand (Fig. 1H) (Broch and Gautier, 2020).
There are six commonly used designs to assemble these two modules into a biosensor (Fig. 1B–G). In a single fluorescent protein biosensor, the fluorescent protein has an intrinsic ion binding domain that can form a direct or an indirect interaction with the chromophore (Fig. 1B) (Wachter et al., 2000; Arosio et al., 2007). A more common design relies on an extrinsic ion binding domain that can be inserted into a split fluorescent protein or, alternatively, the ion binding domain can be split itself and fused to the termini of a circularly permuted fluorescent protein (Fig. 1C) (Kostyuk et al., 2019; Nasu et al., 2021). When the desired ion binds, the extrinsic ion binding domain undergoes a conformational change, which in turn alters the chromophore environment. The relative positioning of the modules and connecting linkers, having variable composition and length, can significantly influence the resulting fluorescence properties.
A third biosensor design uses two fluorescent proteins in different combinations. A single fluorescent protein biosensor with an intrinsic ion binding domain can be fused to another fluorescent protein (Zajac et al., 2020). If the two fluorescent proteins have spectral overlap and are positioned with an optimal distance, Förster resonance energy transfer (FRET) can occur (Figs 1D and E) (Carlson and Campbell, 2009; Lindenburg and Merkx, 2014; Bajar et al., 2016). Alternatively, an extrinsic ion binding domain can be inserted between a FRET pair (Fig. 1F) (Lindenburg and Merkx, 2014).
In the chemigenetic design, an extrinsic ion binding domain can be fused to the termini of an engineered protein that noncovalently (e.g. HBR) or covalently (e.g. HaloTag ligand) interacts with a chemically synthesized chromophore (Fig. 1G) (Broch and Gautier, 2020; Gautier and Tebo, 2020). When the desired ion binds, the resulting conformational change enhances binding or activation of the chromophore, inducing a fluorescence change.
Given the number of design strategies and modules to select from, a range of biosensors with different properties can be generated. Along these lines, a biosensor in general should selectively bind an ion, resulting in a fluorescence intensity change (intensiometric) or an excitation/emission shift (ratiometric) over a large dynamic range. The biosensor should also have appropriate thermodynamic (Kd) and kinetic parameters (kon and koff) to equilibrate with biological receptors and provide a readout of ‘loosely-bound’ or labile ions pools without perturbing homeostasis. Similar parameters should be considered for biologically relevant ions that could interfere. Other properties such as optical brightness, photostability and localization can also be considered. If the resulting properties are not ideal, properties can be optimized through protein engineering as described for specific case studies highlighted below (Packer and Liu, 2015). Since biosensors are typically characterized in vitro and then translated and validated in living systems, it is important to re-evaluate properties with appropriate controls for the desired ion in each biological context of study.
Biosensors have been extensively developed and reviewed for calcium (Ca2+) and zinc (Zn2+) (Greenwald et al., 2018; Pratt et al., 2021). Here, we will provide an overview of recent advances for Ca2+ as a motivation and highlight representative case studies reported from 2017 to 2021 for monoatomic ions, including potassium (K+), magnesium (Mg2+), copper (Cu2+/+), lanthanide (Ln3+) and chloride (Cl−). For each biosensor, we will describe the details of the design and modules, evolution, in vitro properties, and biological applications. We will conclude with a brief perspective on emerging opportunities in the field.
Calcium
Calcium is a tightly regulated alkaline earth ion (~100 nM labile in eukaryotic cells) that has broad and well-established roles in signal transduction, charge balance and structural integrity (Clapham, 2007). To visualize Ca2+ in these processes, biosensors have mostly relied on the eukaryotic Ca2+ binding protein calmodulin (CaM, 16.7 kDa) (Greenwald et al., 2018; Kostyuk et al., 2019). The N- and C-terminal domains of CaM are made up of two EF hand motifs that cooperatively bind up to four Ca2+ ions primarily through glutamate and aspartate residues (Fig. 2A). The binding of Ca2+ induces a conformational change that enables CaM to bind hydrophobic protein targets or synthetic peptides such as M13 from the myosin light chain kinase. This conformational change can be converted into a fluorescent readout by fusing CaM, CaM/M13 or similar Ca2+ binding proteins/peptides to single fluorescent proteins, fluorescent protein FRET pairs, or chemigenetic platforms (Fig. 2).
Fig. 2.

Biosensors for calcium (Ca2+) have been based on the fusion of Ca2+ binding domains to (A) single split or circularly permuted fluorescent proteins, (B) fluorescent protein FRET pairs or (C) chemigenetic platforms. Crystal structures are shown for Ca2+-bound GCaMP2 variant (PDB ID: 3EK8) for (A), Twitch-2B variant (PDB ID: 6GEZ) for (B) and HaloCaMP V2 (PDB ID: 6U2M) for (C). In each schematic, the fluorescent protein component, Ca2+ binding domain(s) and linker regions are shown for representative examples.
When CaM or CaM/M13 are fused to different termini of a single fluorescent protein or between fragments of a split fluorescent protein, the Ca2+-induced conformational change alters the fluorescence signal by preventing water molecules from accessing the chromophore (Wang et al., 2008). This in turn tunes the pKa of the chromophore, generating a turn-on fluorescence response. The GCaMP and Camgaroo biosensors are early examples of this design strategy (Fig. 2A) (Baird et al., 1999; Nakai et al., 2001). Alternatively, CaM/M13 have also been inserted between a fluorescent protein FRET pair such that Ca2+ binding can tune the FRET ratio. This design strategy was first applied with the Cameleon biosensor series (Fig. 2B) (Miyawaki et al., 1997).
Indeed, derivatives of these starting points with improved and new properties have been generated through protein engineering methods (e.g. structure-guided, directed evolution, computational approaches) and/or by exchanging modules (Greenwald et al., 2018; Kostyuk et al., 2019). Recent efforts have, in large part, been motivated by multiplexing and capturing Ca2+ dynamics in vivo, particularly in the brain (Fig. 4A). This has resulted in biosensors with properties such as (i) red-shifted emission (e.g. K-GECO1, NIR-GECO1, jREX-GECO1, GAF-CaMP2, jYCaMP1, iGECI, FR-GECO1), (ii) improved imaging parameters (e.g. IP2.0, YTnC, jGCaMP7, NCaMP7, FGCaMP7, mNG-GECO1), (iii) reduced CaM-mediated toxicity (e.g. GCaMP-X), (iv) photoconversion (e.g. CaMPARI2, rsCaMPARI) and (v) multimodal imaging (e.g. GLICO) (Barykina et al., 2018, 2020; Hara-Kuge et al., 2018; Moeyaert et al., 2018; Shen et al., 2018; Yang et al., 2018; Dana et al., 2019; Farhana et al., 2019; Molina et al., 2019; Qian et al., 2019; Subach et al., 2019, 2020; Dalangin et al., 2020; Mohr, et al., 2020; Sha et al., 2020; Shemetov et al., 2020; Zarowny et al., 2020).
Fig. 4.

Representative imaging applications with biosensors for monoatomic ions. (A) Activity-snapshots of Ca2+ with photoconversion of CaMPARI in zebrafish larvae that are freely swimming (left) or treated with 4-aminopyridine to induce a seizure (right). (B) Two-photon, FRET imaging of K+ with GEPII 1.0 in the cremaster muscle of a living mouse. (C) Differential interference contrast and fluorescence microscopy images of MARIO to image Mg2+ in the nuclei of HeLa S3 cells during prophase (left) and anaphase (right). (D) Two-photon time-lapse imaging of intracellular pH and Cl− with LSSmClopHensor in a mouse cortex. (E) Visualization of Cl− at the membrane with GR1-CFP in exogenously supplemented E. coli. The images in each panel were reproduced with permission from the following references: (Fosque et al., 2015) © 2015 AAAS for A, (Bischof et al., 2017) © 2017 Springer Nature for B, (Maeshima et al., 2018) © 2018 Current Biology for C and (Sulis Sato et al., 2017) © 2017 PNAS for D. The image in panel (E) was kindly provided by Dr. Jasmine N. Tutol.
Beyond GFP-based biosensors, new starting points have been generated by fusing CaM and M13 or related peptides to different termni of chemigentic platforms that rely on synthetic chromophores (Fig. 2C). One such platform is the circularly permuted Fluorescence-Activating and absorption-Shifting Tag (cpFAST) that noncovalently interacts with the HBR chromophore and analogs (Tebo et al., 2018). The binding of Ca2+ enhances the affinity of the chromophore, thus increasing ridigity and fluorescence of the resulting complex. In another approach, the circularly permuted HaloTag covalently binds Janelia Fluor HaloTag ligands that can interconvert between a closed nonfluorescent lactone form to an open zwitterionic fluorescent form as a function of Ca2+ (Deo et al., 2021).
Even though the first fluorescent protein-based biosensor for Ca2+ was reported in 1997, these recent advances highlight that there is room for improvement with more forthcoming (Zhou et al., 2021). Taken together, the Ca2+ biosensor toolbox has not only enabled biological discoveries but has also served as the model of biosensor design and evolution for other ions as highlighted below (Table I).
Table I.
Description and overview of in vitro properties for fluorescent protein-based biosensors for K+, Mg2+, Cu2+, Ln3+ and Cl− ions
| Ion | Design | Name | λ ex /λ em (nm) | pH | R f /R 0 or F f /F 0 | K d (mM) | Reference |
|---|---|---|---|---|---|---|---|
| K+ | Double FP (extrinsic, FRET pair) | GEPII 1.0 | 430/475,525 | 7.4 | 3.2 | 4.2 × 10⁻¹ | Bischof et al. (2017) |
| K+ | Double FP (extrinsic, FRET pair) | lc-LysM GEPII 1.0 | 430/475,525 | 7.4 | Not available | 27.43 | Bischof et al. (2017) |
| K+ | Double FP (extrinsic, FRET pair) | KIRIN1 | 410/475,530 | 7.5 | 2.3 | 1.66 | Shen et al. (2019) |
| K+ | Double FP (extrinsic, FRET pair) | KIRIN1-GR | 470/520,600 | 7.5 | 1.2 | 2.56 | Shen et al. (2019) |
| K+ | Single FP (extrinsic) | GINKO1 | 400,500/514 | 7.5 | 2.5, a3.5 | a4.2 × 10−1 | Shen et al. (2019) |
| Mg2+ | Double FP (extrinsic, FRET pair) | MARIO | 435/480,530 | 7.2 | 2.53 | 7.2 | Maeshima et al. (2018) |
| Cu2+ | Single FP (intrinsic) | CreiLOV | 450/497,527 | 7.1 | 0.4 | 3.2 × 10⁻³ | Zou et al. (2020) |
| La3+ | Double FP (extrinsic, FRET pair) | LaMP1 | 433/475,529 | 7.2 | 6.0 | 9.4 × 10⁻⁹ | Mattocks et al. (2019) |
| Ce3+ | 6.7 | 1.6 × 10⁻⁸ | |||||
| Pr3+ | 5.7 | 1.3 × 10⁻⁸ | |||||
| Nd3+ | 6.0 | 1.2 × 10⁻⁸ | |||||
| Sm3+ | 5.7 | 1.2 × 10⁻⁸ | |||||
| Eu3+ | 6.3 | 1.6 × 10⁻⁸ | |||||
| Gd3+ | 6.3 | 1.0 × 10⁻⁸ | |||||
| Tb3+ | 5.7 | 1.8 × 10⁻⁸ | |||||
| Dy3+ | 6.5 | 2.6 × 10⁻⁸ | |||||
| Ho3+ | 5.6 | 2.9 × 10⁻⁸ | |||||
| Er3+ | 5.4 | 3.6 × 10⁻⁸ | |||||
| Y3+ | 5.7 | 4.4 × 10⁻⁸ | |||||
| Cl− | Single FP (intrinsic) | phiYFP | 400,480/540 | 5.5 | 3.5, 0.77 | 384 | Tutol et al. (2019b) |
| Cl− | Single FP (intrinsic) | mNeonGreen | 495/520 | 4.5 | 21 | 9.8 | Tutol et al. (2019a) |
| Cl− | Single FP (intrinsic) | GR1 | 530/705 | 5 | 1.6 | 203 | Tutol et al. (2021) |
Determined by the fluorescence excitation ratio.
Potassium
Potassium is an essential alkali ion with a steep concentration gradient favoring the intracellular space (~150 mM in the cytosol of eukaryotic cells) (Bischof et al., 2019). Beyond electrolyte balance and membrane potential, K+ can also regulate enzyme activity (Page and Di Cera, 2006; Bischof et al., 2019). Changes in K+ concentrations across extracellular and intracellular membranes drive this normal physiology, but, unsurprisingly, can also contribute to dysfunction with examples in cardiovascular and neurological diseases (Sica et al., 2002; Florence et al., 2012; Palmer and Clegg, 2019). To build a quantitative spatiotemporal map of K+ at the subcellular, cellular, and tissue levels, biosensors with high selectivity and dynamic ranges have recently emerged. Advances along these lines have been made by utilizing the selective cytoplasmic K+ binding protein Kbp (16-kDa) from Escherichia coli (Ashraf et al., 2016). Detailed biophysical characterization showed that Kbp undergoes a conformational change from an elongated to a globular shape when the LysM domain (lysin motif) rearranges to stabilize the K+-bound BON domain (bacterial OsmY and nodulation) (Fig. 3A). The specific residues that define the K+ binding pocket were not identified.
Fig. 3.
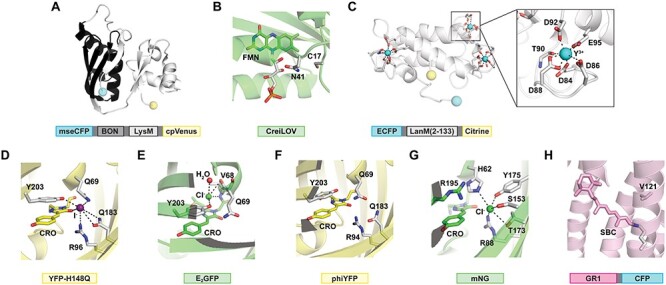
Representative biosensors for monoatomic ions. Structures or models are shown for (A) the potassium (K+) binding protein Kbp (BON domain highlighted in black, PDB ID: 5FIM) fused to mseCFP and cpV of GEPII biosensors, (B) the flavin-based precursor protein (PDB ID: 1N9L) of CreiLOV that is sensitive to cupric (Cu2+) ions, (C) the lanthanide (Ln3+) binding protein lanmodulin (LanM) bound to yttrium (Y3+) (PDB ID: 6MI5) fused to ECFP and Citrine of LaMP1, (D) YFP-H148Q with iodide (I−) (PDB ID: 1F09), (E) E2GFP with chloride (Cl−) (PDB ID: 2O24), (F) a phiYFP variant (PDB ID: 4HE4), (G) mNeonGreen with Cl− (PDB ID: 5LTP) and (H) GR1 based on the Gloeobacter violaceus rhodopsin (PDB ID: 6NWD). Chromophores or residues that are known or predicted to interact with each ion are shown as grey sticks with nitrogen atoms in blue, oxygen atoms in red, phosphorous atoms in orange and sulfur atoms in yellow and labeled with the single letter amino acid code and position number. In each schematic, the fluorescent protein(s), ion binding domain(s) and/or linker region(s) are shown. Abbreviations: FMN, flavin mononucleotide; CRO, GFP-like chromophore; SBC, Schiff base chromophore.
Based on this conformational change, the Malli lab created the GEPII family of FRET-based K+ biosensors (Bischof et al., 2017). For the design of GEPII 1.0, Kbp (residues 1–149) was inserted between a FRET pair consisting of mseCFP and cpV (λex = 430 nm; λem = 475 nm, λem = 525 nm). In the presence of 10 mM K+ GEPII 1.0 had a FRET ratio change (Rf/R0) of ~ 3.2-fold (Kd = 0.42 mM) at pH 7.4. The FRET ratio did not change in the presence of other biologically relevant cations such as Na+ and Ca2+, but NH4+ interfered at higher concentrations (Kd = 1.94 mM). Because of these robust properties, GEPII 1.0 was applied in purified form to detect K+ in biological fluids, cell viability assays, and tissues (Fig. 4B). It was also transiently expressed HeLa cells and determined to be selective for K+ over Na+ through permeabilization and ionophore treatments. To detect endogenous pools of K+, the affinity of GEPII 1.0 was weakened (Kd = 27.43 mM) by introducing the rational mutations D104N, E125Q and D135N in the LysM domain. The resulting biosensor called lc-LysM GEPII 1.0 had a similar selectivity profile as GEPII 1.0. As such, it was used to build a quantitative map of K+ in subcellular compartments of four different mammalian cell lines and was further multiplexed with the red-shifted Ca2+ biosensor CAR-GECO1 in INS-1 cells.
In parallel, the Dong and Campbell labs reported two FRET-based biosensors, KIRIN1 and KIRIN1-GR, and an intensity-based single fluorescent protein biosensor, GINKO1 (Shen et al., 2019). For the design of KIRIN1, Kbp (residues 2–149) was inserted between the mCerulean3 and cp173Venus FRET pair (λex = 410 nm; λem = 475 nm, λem = 530 nm) on the C-terminus. In the presence of 150 mM K+, KIRIN1 displayed a FRET ratio change (Rf/R0) of ~ 2.3-fold (Kd = 1.66 mM) at pH 7.5. For KIRIN1-GR, the Clover GFP and mRuby2 RFP FRET pair (λex = 470 nm; λem = 520, λem = 600 nm) was used instead. This resulted in a lower FRET ratio change (~1.2-fold) and weaker affinity (Kd = 2.56 mM). The FRET ratios for both KIRIN1 and KIRIN1-GR did not change in the presence of sodium (Na+), Mg2+, Ca2+ and Zn2+. To expand beyond the FRET strategy, inspiration was drawn from the GCaMP family of Ca2+ biosensors. The splitting of the Kbp domains, followed by insertion into cpEGFP did not generate a K+-sensitive starting point; instead, the insertion of Kbp at position 144 of EGFP resulted in GINKO1. At pH 7.5, the apo form displayed fluorescence excitation maxima at 400 nm and 502 nm, corresponding to the phenol and phenolate forms of the chromophore, respectively. Excitation of the phenolate form resulted in an emission maximum at 514 nm. The addition of 150 mM K+, shifted the fluorescence excitation maximum to 500 nm and resulted in a ~2.5-fold turn-on fluorescence response at 514 nm. Interestingly, a ~3.5-fold change in the fluorescence excitation ratio (Fex-500/Fex-400) was also observed (Kd = 0.42 mM), thus making GINKO1 an intensity and excitation ratiometric-based biosensor. Although significantly weaker, the affinity for Na+ was measurable (Fex-500/Fex-400 ~ 3 with 1 M Na+; Kd = 153 mM). The ability of KIRIN1 and GINKO1 to provide a dynamic readout of K+ was calibrated using fluorescence microscopy in HeLa cells with small molecules to deplete and elevate intracellular K+ levels. Following this validation, KIRIN1 and GINKO1 with the red-shifted Ca2+ indicator K-GECO1 were applied in stimulated rat cortical neurons and glia.
Magnesium
Magnesium is an alkaline earth ion with total intracellular concentrations ranging up to 20 mM eukaryotic cells (Jahnen-Dechent and Ketteler, 2012; de Baaij et al., 2015; Bischof et al., 2019). It plays an essential role in charge balance, structure and enzyme activity (Jahnen-Dechent and Ketteler, 2012; de Baaij et al., 2015; Bischof et al., 2019). This necessitates that ~95% of the Mg2+ pool is tightly bound to proteins and biomolecules, with the remainder in the labile pool (up to ~1 mM) to dynamically control biological processes (Jahnen-Dechent and Ketteler, 2012; de Baaij et al., 2015; Bischof et al., 2019). Along these lines, biosensors have supported these findings and provided additional biological insights. The first such demonstration was by the Merkx lab in 2013 with the biosensor MagFRET, generated through the fusion of a fluorescent protein FRET pair to the Mg2+ binding domain of human centrin 3 (Lindenburg et al., 2013).
Then in 2018, the Nagai lab reported a FRET-based biosensor called MARIO using the Ca2+ biosensor Yellow Cameleon 3.60 as a scaffold (Nagai et al., 2004; Maeshima et al., 2018). Specifically, the CaM, linker, and M13 regions between the ECFP and Venus FRET pair (λex = 435 nm; λem = 480, λem = 530 nm) were first substituted with the ~30-kDa cytoplasmic domain of the Mg2+ transporter CorA (CorA-CD) from E. coli. This design relied on a Mg2+-induced conformational change to bring the ECFP and Venus FRET pair closer together (Payandeh and Pai, 2006). To improve the affinity and dynamic range of the starting point the following modifications were made to the CorA-CD resulting in MARIO: N-terminal residues (2–48) unrelated to Mg2+ binding were removed, mutations related to Mg2+-induced structural changes were made at K187A and R189A, and random mutations at I74D and I184D were introduced via error-prone PCR. At pH 7.2, the FRET ratio change (Rf/R0) increased by ~2.53-fold in the presence of 100 mM of Mg2+ (Kd = 7.2 mM). The residues that interact with Mg2+ in the pentameric assembly of CorA-CD consist of polar amino acids, including asparagine, glutamine, aspartate or glutamate (Payandeh and Pai, 2006; Lerche et al., 2017). Based on these residues, it is not surprising that MARIO could also bind Ca2+ (Kd = 6.2 mM); however, Ca2+ did not interfere in the biological applications because it influences physiological processes in the submicromolar range. Fusion of a nuclear localization sequence enabled time-lapse FRET imaging of Mg2+ levels in the cell cycle of HeLa S3 cells (Fig. 4C).
Copper
Copper is an essential transition metal ion utilized by prokaryotic and eukaryotic organisms (Ma et al., 2009; Turski and Thiele, 2009; Banci et al., 2010). Since copper is redox active, primarily cycling between cuprous (Cu+) and cupric (Cu2+) oxidation states, labile and enzyme-bound pools are tightly regulated in the intracellular and extracellular space, resulting in no ‘free’ Cu2+/+ (Ma et al., 2009; Turski and Thiele, 2009; Banci et al., 2010). Biosensors have been based on the (i) fusion of fluorescent protein FRET pairs to Cu+ binding proteins Amt1 from Candida glabrata, Ace1 and Mac1 from Saccharomyces cerevisiae, and CDC 1551 from Mycobacterium tuberculosis, (ii) single fluorescent proteins with Cu2+ binding sites or (iii) Cu2+-sensitive FMN-based fluorescent proteins (FbFPs) containing a LOV (light, oxygen or voltage) domain, such as iLOV engineered from the Arabidopsis thaliana LOV2 domain and FbFP from Pseudomonas putida KT2440 (Hao et al., 2018; Bischof et al., 2019).
More recently, the Zastrow lab identified the FbFP CreiLOV from Chlamydomonas reinhardtii as a brighter and more photostable alternative to iLOV proteins for biosensing of Cu2+ (Zou et al., 2020). Sequence and structural alignment revealed that the putative CreiLOV Cu2+ binding site consists of FMN, C17 and N41 (Fig. 3B). Upon excitation at 450 nm, the fluorescence emission arising from the FMN chromophore at 497 nm along with a shoulder at 527 nm was most significantly quenched (~60%) by Cu2+ (Kd of 3.2 μM) at pH 7.1. The affinity was weakened at low pH and copper hydroxide likely precipitated at high pH, but the operational pH range of the sensor was maintained under physiological conditions. Importantly, cleavage of the polyhistidine tag and detailed analysis with Zn2+ confirmed the sensitivity of CreiLOV to Cu2+, but Cu+ has yet to be tested. Moreover, the quenching mechanism (i.e. static versus dynamic) remains to be determined. As a proof-of-concept, fluorescence intensity and lifetime measurements were carried out in E. coli expressing CreiLOV through permeabilization and exogenous supplementation with micromolar levels Cu2+ and metal chelators.
Lanthanides
Despite wide-spread use of the rare earth elements (i.e. scandium, yttrium, lanthanides) in biomedical, electronic and photonic industries, the biological role of these cations as enzyme cofactors has only emerged in the past decade, particularly in methylotrophic bacteria (Daumann, 2019; Featherston and Cotruvo, 2021). Given similarities in the relative abundance and physical properties (e.g. size, charge, Lewis acidity, solubility) of Ln3+ ions and other cations (M2+/3+), it is not surprising that Nature has evolved mechanisms that enable for the selective recognition and utilization of Ln3+ ions. Along these lines, the Cotruvo lab has reported the identification and characterization of the periplasmic Ln3+ binding protein lanmodulin (LanM) from Methylobacterium extorquens and its conversion into a first-generation FRET-based biosensor called LaMP1 (Mattocks et al., 2019).
Like CaM described above for Ca2+, LanM is a ~12-kDa protein that contains four EF hand loops, but the motifs form an eight or nine coordinate complex through five carboxylates (side chain of four aspartates and a glutamate) and a backbone carbonyl versus a seven-coordinate complex with CaM (Fig. 3C) (Featherston and Cotruvo, 2021). Notably, each EF hand of LanM has a proline residue at the second position and an aspartate residue at the ninth position. Both substitutions impart a thermodynamic preference for Ln3+ ions resulting in a significant cooperative, conformational change upon binding. Based on this, LaMP1 was generated by replacing the CaM and M13 domains of the FRET-based biosensor Cameleon D2 (ECFP and Citrine, λex = 433 nm; λem = 475 nm, λem = 529 nm) with LanM (A22–R133) (Mattocks et al., 2019). Without any further engineering, LaMP1 displayed FRET ratio changes (Rf/R0) from ~5.4 to 6.7 with picomolar affinity (Kd = 9.4–44 pM) for all the rare earth elements and selectivity over Ca2+ (Rf/R0 ~ 2.9; Kd = 1.2 mM) at pH 7.2. Little to no interference was observed from environmentally and biologically relevant cations, including Fe3+, Al3+, Mn2+, Cu2+, Mg2+, Na+ and K+. These robust in vitro properties enabled the application of LaMP1 to probe extracellular and intracellular Ln3+ ion homeostasis in live M. extorquens using a fluorescence plate reader assay.
Chloride
Chloride is the most abundant monoatomic anion found in virtually every living organism (up to ~70 mM in eukaryotic cells) (Reuter et al., 1998). In eukaryotic cells, the mobilization of Cl− via membrane bound transporters is linked to physiological functions such as cell volume, pH regulation and electrochemical gradients for signaling (Duran et al., 2010; Zajac et al., 2020). However, disruptions to Cl− homeostasis have been implicated in a range of disease states, including cancer, cystic fibrosis and neurodevelopmental disorders (Duran et al., 2010; Zajac et al., 2020). Investigating real-time Cl− dynamics in biological contexts such as these has been aided by the application of biosensors (Figs 3D, E and4D) (Arosio and Ratto, 2014; Sulis Sato et al., 2017; Ullrich et al., 2019; Yang et al., 2019a; Zajac et al., 2020). Pioneering studies demonstrated that variants of GFP were sensitive to Cl−, and in some cases to other halides and nitrate. With respect to GFP, the yellow fluorescent protein variant YFP-H148Q has five mutations: S65G, V68L, S72A, H148Q and T203Y (Wachter et al., 2000). The Y203 is essential as it π-stacks with the chromophore formed from G65-Y66-G67 and directly interacts with the anion in the binding pocket that is also made up of Q69, R96 and Q183 (Fig. 3D). Given this proximity, the binding of Cl− increased the pKa of the chromophore Y66. This in turn shifted the equilibrium from the highly fluorescent phenolate form to the nonfluorescent phenol form, resulting in a turn-off fluorescence response. Similarly, the E2GFP variant has the key T203Y mutation in addition to F64L, S65T and L231H (Arosio et al., 2007). However, the Cl− binding pocket consists of Y203, the peptide backbone formed from Q69 and V68 with the chromophore T65-Y66-G67, and a water molecule (Fig. 3E). Interestingly, the binding of Cl− did not shift the chromophore equilibrium, but rather the sensing mechanism was linked to a static quenching process. Indeed, these starting points and derivatives thereof have been evolved using protein engineering methods and/or fused to other fluorescent proteins to enable intensity (e.g. YFP-H148Q variants), ratiometric (e.g. Cl-Sensor, SuperClomeleon, mBeRFP), or dual analyte imaging (e.g. LSSmClopHensor) (Arosio and Ratto, 2014; Zajac et al., 2020; Salto et al., 2021).
Building from these advances, we have turned to natural and laboratory-guided evolution to sample the vast protein sequence space for Cl− biosensors with new properties. In 2019, we reported that the YFP from the jellyfish Phialidium sp. (phiYFP) is an excitation ratiometric, turn-on fluorescent sensor for Cl− (Tutol et al., 2019b). The basic local alignment search tool was first used to identify phiYFP as a high sequence identity homologue of YFP-H148Q with the exact same residues in the Cl− binding pocket and a chromophore made up of T65-Y66-G67 (Fig. 3F). Based on this, we expressed and purified apo phiYFP. From pH 5–9, the absorbance maximum at 525 nm decreased and shifted to 400 nm upon the addition of 400 mM Cl−. This absorbance change corresponded to the equilibrium of the chromophore Y66 from the phenolate to the phenol form. Like YFP-H148Q, the addition of 400 mM Cl− increased the chromophore Y66 pKa from 4.9 to 5.4 due to increased electrostatic repulsion. At pH 5.5, excitation of the phenolate form at 480 nm resulted in a single emission maximum at 540 nm that quenched by 23% with 400 mM Cl−. To our surprise, excitation of the phenol form at 400 nm resulted in a ~3.5-fold turn-on fluorescence response to Cl− at the emission maximum corresponding to the phenolate form, indicating an excited state proton transfer mechanism (Kd = 384 mM) (Chen et al., 2021). In the absence of an anion-bound X-ray crystal structure, the Cl− binding pocket was confirmed through site-saturation mutagenesis at Q69 and screening in cell extracts. The resulting leucine and histidine variants both displayed similar spectral features but with weak to no affinity for Cl− in purified form.
In parallel, we employed a structure-guided approach to identify that the GFP mNeonGreen has a unique Cl− binding pocket consisting of H62, R88, S153, T173 and Y175 with R195 above the G59-Y60-G61 chromophore (Fig. 3G), thus motivating our investigation (Tutol et al., 2019a). As expected, the chromophore Y60 converted from the phenolate (λabs = 505 nm) to the phenol (λabs = 400 nm) in a pH-dependent manner (pKa = 5.7). Interestingly, the addition of 25 mM Cl− lowered the pKa to 4.7, and titrations with Cl− at pH 4.5 showed that the chromophore Y60 converted from the phenol to the phenolate form. Excitation of the phenolate form at 495 nm resulted in a single emission maximum (λem = 520 nm) that increased in intensity by ~21-fold with 25 mM Cl− (Kd = 9.8 mM). This unique turn-on response was further connected to the noncoordinating residue R195 above the chromophore Y60 by introducing the R195Y mutation. The resulting biosensor had a turn-off fluorescence response to Cl− like YFP-H148Q and E2GFP described above.
Looking beyond the GFP family, we recently demonstrated the potential of designing biosensors for Cl− by engineering the proton-pumping rhodopsin from Gloeobacter violaceus (GR) (Tutol et al., 2021). GR is a membrane-spanning protein with a Schiff base chromophore (SBC) that is formed from the condensation of K257 and all-trans-retinal (Fig. 3H). The protonation state of the SBC controls the on–off fluorescent states of GR and is stabilized by the D121 counterion position. Based on this, we hypothesized that D121 could be mutated such that Cl− could bind and serve as the counterion to the protonated SBC, thereby tuning the fluorescence of GR. To test this, a site-saturation mutagenesis library was generated at D121 and screened using a fluorescence-based assay in live E. coli. GR was fused to cyan fluorescent protein (CFP) to control for variability in expression and provide a ratiometric readout. In the presence of 400 mM Cl−, a turn-on fluorescence response was observed with leucine < threonine ≈ asparagine < isoleucine < valine mutants at pH 5. The valine mutant defined as GR1 was further characterized in E. coli and purified form (λex = 530 nm; λem = 705 nm). In E. coli, GR1-CFP displayed a ~2.5-fold turn-on fluorescence response to 400 mM Cl− (Kd = 42 mM), and control experiments showed that GR1-CFP did not pump nor sense membrane potential. Results from the bulk fluorescence measurements translated to the single cell level using confocal fluorescence microscopy (Fig. 4E). In purified form GR1 displayed a ~1.6-fold turn-on fluorescence response to 400 mM Cl− (Kd = 203 mM). Despite the difference between the response of GR1 in live E. coli versus detergent micelles, the in vitro data suggested that GR1 operated in the excited state by shifting the pKa of the SBC from 3.1 to 4.8 in the presence of 400 mM Cl−. Collectively, our lab’s advances highlight how changes at the sequence level can afford new starting points, and, although pH-dependent, these biosensors can be improved through protein engineering for cellular imaging applications.
Summary and outlook
The development and application of fluorescent protein-based biosensors to visualize cellular ion dynamics remains to be a vibrant area of research. In this Review, we have highlighted how the pioneering efforts for Ca2+ biosensors have led to new biosensors for other monoatomic ions. Indeed, biological questions have and will serve as the driving force for biosensor development and innovation. This interplay not only lies at the intersection of protein engineering and cell biology, but also overlaps with biochemistry, genomics, spectroscopy, microscopy and computer/data science. Exciting opportunities that could broadly extend to biosensors for ions include but not limited to, (i) directed evolution in mammalian cells, (ii) machine-learning-guided directed evolution, (iii) de novo protein design, (iv) multiplex imaging with different biosensors and (v) combining fluorescence imaging with other imaging modalities (Farhana et al., 2019; Yang et al., 2019b; Shemetov et al., 2020; Werley et al., 2020; Hendel and Shoulders, 2021; Quijano-Rubio et al., 2021). Looking forward, we anticipate that new biosensors for ions will emerge, and in combination with complementary techniques, could provide us with a more complete picture of how the interplay of ions define the inorganic chemistry of life.
Acknowledgments
We thank members of the Dodani Lab for helpful discussions and editorial feedback during the preparation of this review. This review is the sole responsibility of the authors and does not represent the views of the funding sources.
Contributor Information
Kiheon Baek, Department of Chemistry and Biochemistry, The University of Texas at Dallas, 800 West Campbell Road, Richardson, TX 75080, USA.
Ke Ji, Department of Chemistry and Biochemistry, The University of Texas at Dallas, 800 West Campbell Road, Richardson, TX 75080, USA.
Weicheng Peng, Department of Chemistry and Biochemistry, The University of Texas at Dallas, 800 West Campbell Road, Richardson, TX 75080, USA.
Sureshee M Liyanaarachchi, Department of Chemistry and Biochemistry, The University of Texas at Dallas, 800 West Campbell Road, Richardson, TX 75080, USA.
Sheel C Dodani, Department of Chemistry and Biochemistry, The University of Texas at Dallas, 800 West Campbell Road, Richardson, TX 75080, USA.
Funding
Support was provided by startup funds from The University of Texas at Dallas, the National Institute of General Medical Sciences of the National Institutes of Health [R35GM128923], and the Welch Foundation [AT-2060-20210327] to S.C.D.
References
- Arosio, D., Garau, G., Ricci, F., Marchetti, L., Bizzarri, R., Nifosì, R. and Beltram, F. (2007) Biophys. J., 93, 232–244. [DOI] [PMC free article] [PubMed] [Google Scholar]
- Arosio, D. and Ratto, G.M. (2014) Front. Cell. Neurosci., 8, 258. [DOI] [PMC free article] [PubMed] [Google Scholar]
- Ashraf, K.U., Josts, I., Mosbahi, K., Kelly, S.M., Byron, O., Smith, B.O. and Walker, D. (2016) Structure, 24, 741–749. [DOI] [PubMed] [Google Scholar]
- Baird, G.S., Zacharias, D.A. and Tsien, R.Y. (1999) Proc. Natl. Acad. Sci. USA, 96, 11241–11246. [DOI] [PMC free article] [PubMed] [Google Scholar]
- Banci, L., Bertini, I., Ciofi-Baffoni, S., Kozyreva, T., Zovo, K. and Palumaa, P. (2010) Nature, 465, 645–648. [DOI] [PubMed] [Google Scholar]
- Bajar, B.T., Wang, E.S., Zhang, S., Lin, M.Z. and Chu, J. (2016) Sensors, 16, 1488. [DOI] [PMC free article] [PubMed] [Google Scholar]
- Barykina, N.V., Doronin, D.A., Subach, O.M.et al. (2018) Sci. Rep., 8, 15233. [DOI] [PMC free article] [PubMed] [Google Scholar]
- Barykina, N.V., Sotskov, V.P., Gruzdeva, A.M.et al. (2020) Int. J. Mol. Sci., 21, 3012. [Google Scholar]
- Bischof, H., Burgstaller, S., Waldeck-Weiermair, M., Rauter, T., Schinagl, M., Ramadani-Muja, J., Graier, W.F. and Malli, R. (2019) Cells, 8, 492. [DOI] [PMC free article] [PubMed] [Google Scholar]
- Bischof, H., Rehberg, M., Stryeck, S.et al. (2017) Nat. Commun., 8, 1422. [DOI] [PMC free article] [PubMed] [Google Scholar]
- Broch, F. and Gautier, A. (2020) ChemPlusChem, 85, 1487–1497. [DOI] [PubMed] [Google Scholar]
- Carlson, H.J. and Campbell, R.C. (2009) Curr. Opin. Biotechol., 20, 19–27. [DOI] [PubMed] [Google Scholar]
- Chen, C., Tutol, J.N., Tang, L., Zhu, L., Ong, W.S.Y., Dodani, S.C. and Fang, C. (2021) Chem. Sci., 12, 11382–11393. [DOI] [PMC free article] [PubMed] [Google Scholar]
- Clapham, D.E. (2007) Cell, 131, 1047–1058. [DOI] [PubMed] [Google Scholar]
- Cox, G. (2019) Fundamentals of Fluorescence Imaging. CRC Press, Boca Raton, Florida. [Google Scholar]
- Crichton, C. (2012) Bioloigcal Inorganic Chemistry: A New Introduction to Molecular Structure and Function (2nd ed). Elsevier, Amsterdam, Netherlands. [Google Scholar]
- Dalangin, R., Drobizhev, M., Molina, R.S.et al. (2020) bioRxiv. 10.1101/2020.11.12.380089. [DOI] [Google Scholar]
- Dana, H., Sun, Y., Mohar, B.et al. (2019) Nat. Methods, 16, 649–657. [DOI] [PubMed] [Google Scholar]
- Daumann, L.J. (2019) Angew. Chem. Int. Ed. Engl., 58, 12795–12802. [DOI] [PubMed] [Google Scholar]
- deBaaij, J.H.F., Hoenderop, J.G.J. and Bindels, R.J.M. (2015) Physiol. Rev., 95, 1–46. [DOI] [PubMed] [Google Scholar]
- Deo, C., Abdelfattah, A.S., Bhargava, H.K., Berro, A.J., Falco, N., Farrants, H., Moeyaert, B., Chupanova, M., Lavis, L.D. and Schreiter, E.R. (2021) Nat. Chem. Biol., 17, 718–723. [DOI] [PubMed] [Google Scholar]
- Duran, C., Thompson, C.H., Xiao, Q. and Hartzell, H.C. (2010) Annu. Rev. Physiol., 72, 95–121. [DOI] [PMC free article] [PubMed] [Google Scholar]
- Farhana, I., Hossain, M.N., Suzuki, K., Matsuda, T. and Nagai, T. (2019) ACS Sens., 4, 1825–1834. [DOI] [PubMed] [Google Scholar]
- Featherston, E.R. and Cotruvo, J.A.Jr. (2021) Biochim. Biophys. Acta, Mol. Cell Res., 1868, 118864. [DOI] [PubMed] [Google Scholar]
- Florence, G., Pereira, T. and Kurths, J. (2012) Commun. Nonlinear Sci. Numer. Simul., 17, 4700–4706. [Google Scholar]
- Fosque, B.F., Sun, Y., Dana, H.et al. (2015) Science, 347, 755–760. [DOI] [PubMed] [Google Scholar]
- Gautier, A. and Tebo, A.G. (2020) Curr. Opin. Chem. Biol., 57, 58–64. [DOI] [PubMed] [Google Scholar]
- Greenwald, E.C., Mehta, S. and Zhang, J. (2018) Chem. Rev., 118, 11707–11794. [DOI] [PMC free article] [PubMed] [Google Scholar]
- Hao, Z., Zhu, R. and Chen, P.R. (2018) Curr. Opin. Chem. Biol., 43, 87–96. [DOI] [PubMed] [Google Scholar]
- Hara-Kuge, S., Nishihara, T., Matsuda, T., Kitazono, T., Teramoto, T., Nagai, T. and Ishihara, T. (2018) PLoS One, 13, e0194707. [DOI] [PMC free article] [PubMed] [Google Scholar]
- Hendel, S.J. and Shoulders, M.D. (2021) Nat. Methods, 18, 346–357. [DOI] [PMC free article] [PubMed] [Google Scholar]
- Jahnen-Dechent, W. and Ketteler, M. (2012) Clin. Kidney J., 5, i3–i14. [DOI] [PMC free article] [PubMed] [Google Scholar]
- Kostyuk, A.I., Demidovich, A.D., Kotova, D.A., Belousov, V.V. and Bilan, D.S. (2019) Int. J. Mol. Sci., 20, 4200. [DOI] [PMC free article] [PubMed] [Google Scholar]
- Lerche, M., Sandhu, H., Flöckner, L., Högbom, M. and Rapp, M. (2017) Structure, 25, 1175–1186. [DOI] [PubMed] [Google Scholar]
- Lindenburg, L. and Merkx, M. (2014) Sensors, 14, 11691–11713. [DOI] [PMC free article] [PubMed] [Google Scholar]
- Lindenburg, L.H., Vinkenborg, J.L., Oortwijn, J., Aper, S.J.A. and Merkx, M. (2013) PLoS One, 8, e82009. [DOI] [PMC free article] [PubMed] [Google Scholar]
- Ma, Z., Jacobsen, F.E. and Giedroc, D.P. (2009) Chem. Rev., 109, 4644–4681. [DOI] [PMC free article] [PubMed] [Google Scholar]
- Maeshima, K., Matsuda, T., Shindo, Y.et al. (2018) Curr. Biol., 28, 444–451. [DOI] [PubMed] [Google Scholar]
- Mattocks, J.A., Ho, J.V. and Cotruvo, J.A.Jr. (2019) J. Am. Chem. Soc., 141, 2857–2861. [DOI] [PubMed] [Google Scholar]
- Miyawaki, A., Llopis, J., Heim, R., McCaffery, J.M., Adams, J.A., Ikura, M. and Tsien, R.Y. (1997) Nature, 388, 882–887. [DOI] [PubMed] [Google Scholar]
- Moeyaert, B., Holt, G., Madangopal, R.et al. (2018) Nat. Commun., 9, 4440. [DOI] [PMC free article] [PubMed] [Google Scholar]
- Mohr, M.A., Bushey, D., Aggarwal, A.et al. (2020) Nat. Methods, 17, 694–697. [DOI] [PMC free article] [PubMed] [Google Scholar]
- Molina, R.S., Qian, Y., Wu, J., Shen, Y., Campbell, R.E., Drobizhev, M. and Hughes, T.M. (2019) Biophys. J., 116, 1873–1866. [DOI] [PMC free article] [PubMed] [Google Scholar]
- Nakai, J., Ohkura, M. and Imoto, K. (2001) Nat. Biotechnol., 19, 137–141. [DOI] [PubMed] [Google Scholar]
- Nagai, T., Yamada, S., Tominaga, T., Ichikawa, M. and Miyawaki, A. (2004) Proc. Natl. Acad. Sci. USA, 101, 10554–10559. [DOI] [PMC free article] [PubMed] [Google Scholar]
- Nasu, Y., Shen, Y., Kramer, L. and Campbell, R.E. (2021) Nat. Chem. Biol., 17, 509–518. [DOI] [PubMed] [Google Scholar]
- Packer, M.S. and Liu, D.R. (2015) Nat. Rev. Genet., 16, 379–394. [DOI] [PubMed] [Google Scholar]
- Page, M.J. and Di Cera, E. (2006) Physiol. Rev., 86, 1049–1092. [DOI] [PubMed] [Google Scholar]
- Palmer, B.F. and Clegg, D.J. (2019) Am. J. Kidney Dis., 74, 682–695. [DOI] [PubMed] [Google Scholar]
- Payandeh, J. and Pai, E.F. (2006) EMBO J., 25, 3762–3773. [DOI] [PMC free article] [PubMed] [Google Scholar]
- Pratt, E.P.S., Damon, L.J., Anson, K.J. and Palmer, A.E. (2021) Biochim. Biophys. Acta, Mol. Cell Res., 1868, 118865. [DOI] [PMC free article] [PubMed] [Google Scholar]
- Qian, Y., Piatkevich, K.D., Mc Larney, B.et al. (2019) Nat. Methods, 16, 171–174. [DOI] [PMC free article] [PubMed] [Google Scholar]
- Quijano-Rubio, A., Yeh, H.W., Park, J.et al. (2021) Nature, 591, 482–487. [DOI] [PMC free article] [PubMed] [Google Scholar]
- Reuter, D., Zierold, K., Schröder, W.H. and Frings, S. (1998) J. Neurosci., 18, 6623–6630. [DOI] [PMC free article] [PubMed] [Google Scholar]
- Sulis Sato, S., Artoni, P., Landi, S.et al. (2017) Proc. Natl. Acad. Sci. USA, 114, E8770–E8779. [DOI] [PMC free article] [PubMed] [Google Scholar]
- Salto, R., Giron, M.D., Puente-Muñoz, V., Vilchez, J.D., Espinar-Barranco, L., Valverde-Pozo, J., Arosio, D. and Paredes, J.M. (2021) ACS Sens., 6, 2563–2573. [DOI] [PMC free article] [PubMed] [Google Scholar]
- Sha, F., Abdelfattah, A.S., Patel, R. and Schreiter, E.R. (2020) Elife, 9, e57249. [DOI] [PMC free article] [PubMed] [Google Scholar]
- Shemetov, A.A., Monakhov, M.V., Zhang, Q.et al. (2020) Nat. Biotechnol., 39, 368–377. [DOI] [PMC free article] [PubMed] [Google Scholar]
- Shen, Y., Dana, H., Abdelfattah, A.S.et al. (2018) BMC Biol., 16, 9. [DOI] [PMC free article] [PubMed] [Google Scholar]
- Shen, Y., Wu, S.Y., Rancic, V., Aggarwal, A., Qian, Y., Miyashita, S.I., Ballanyi, K., Campbell, R.E. and Dong, M. (2019) Commun. Biol., 2, 18. [DOI] [PMC free article] [PubMed] [Google Scholar]
- Sica, D.A., Struthers, A.D., Cushman, W.C., Wood, M., Banas, J.S.Jr. and Epstein, M. (2002) J. Clin. Hypertens., 4, 198–206. [DOI] [PMC free article] [PubMed] [Google Scholar]
- Subach, O.M., Barykina, N.V., Anokhin, K.V., Piatkevich, K.D. and Subach, F.V. (2019) Int. J. Mol. Sci., 20, 3488. [DOI] [PMC free article] [PubMed] [Google Scholar]
- Subach, O.M., Sotskov, V.P., Plusnin, V.V.et al. (2020) Int. J. Mol. Sci., 21, 1644. [Google Scholar]
- Tebo, A.G., Pimenta, F.M., Zoumpoulaki, M., Kikuti, C., Sirkia, H., Plamont, M.A., Houdusse, A. and Gautier, A. (2018) ACS Chem. Biol., 13, 2392–2397. [DOI] [PubMed] [Google Scholar]
- Turski, M.L. and Thiele, D.J. (2009) J. Biol. Chem., 284, 717–721. [DOI] [PMC free article] [PubMed] [Google Scholar]
- Tutol, J.N., Kam, H.C. and Dodani, S.C. (2019a) ChemBioChem, 20, 1759–1765. [DOI] [PMC free article] [PubMed] [Google Scholar]
- Tutol, J.N., Lee, J., Chi, H., Faizuddin, F.N., Abeyrathna, S.S., Zhou, Q., Morcos, F., Meloni, G. and Dodani, S.C. (2021) Chem. Sci., 12, 5655–5663. [DOI] [PMC free article] [PubMed] [Google Scholar]
- Tutol, J.N., Peng, W. and Dodani, S.C. (2019b) Biochemistry, 58, 31–35. [DOI] [PMC free article] [PubMed] [Google Scholar]
- Ullrich, F., Blin, S., Lazarow, K., Daubitz, T., vonKries, J.P. and Jentsch, T.J. (2019) Elife, 8, e49187. [DOI] [PMC free article] [PubMed] [Google Scholar]
- Wachter, R.M., Yarbrough, D., Kallio, K. and Remington, S.J. (2000) J. Mol. Biol., 301, 157–171. [DOI] [PubMed] [Google Scholar]
- Wang, Q., Shui, B., Kotlikoff, M.I. and Sondermann, H. (2008) Structure, 16, 1817–1827. [DOI] [PMC free article] [PubMed] [Google Scholar]
- Werley, C.A., Boccardo, S., Rigamonti, A., Hansson, E.M. and Cohen, A.E. (2020) Nat. Commun., 11, 3881. [DOI] [PMC free article] [PubMed] [Google Scholar]
- Yang, J., Chen, J., Carmen, V., Del, M., Osei-Owusu, J., Chu, J., Yu, H., Sun, S. and Qiu, Z. (2019a) Science, 364, 395–399. [DOI] [PMC free article] [PubMed] [Google Scholar]
- Yang, K.K., Wu, Z. and Arnold, F.H. (2019b) Nat. Methods, 16, 687–694. [DOI] [PubMed] [Google Scholar]
- Yang, Y., Liu, N., He, Y., Liu, Y., Ge, L., Zou, L., Song, S., Xiong, W. and Liu, X. (2018) Nat. Commun., 9, 1504. [DOI] [PMC free article] [PubMed] [Google Scholar]
- Zajac, M., Chakraborty, K., Saha, S., Mahadevan, V., Infield, D.T., Accardi, A., Qiu, Z. and Krishnan, Y. (2020) J. Cell Sci., 133, jcs240390. [DOI] [PubMed] [Google Scholar]
- Zarowny, L., Aggarwal, A., Rutten, V.M.S.et al. (2020) ACS Sens., 5, 1959–1968. [DOI] [PubMed] [Google Scholar]
- Zhou, X., Belavek, K.J. and Miller, E.W. (2021) Biochemistry. 10.1021/acs.biochem.1c00350. [DOI] [PMC free article] [PubMed] [Google Scholar]
- Zou, W., Le, K. and Zastrow, M.L. (2020) ChemBioChem, 21, 1356–1363. [DOI] [PubMed] [Google Scholar]