

Abstract
Background:
Glioma is the most common malignant brain cancer. Accessibility to health care is an important factor affecting cancer outcome in the U.S. general population. The U.S. Military Health System (MHS) provides universal health care to its beneficiaries. It is unknown whether the universal health care has translated into improved survival outcomes among MHS beneficiaries with glioma. We compared overall survival of glioma patients in the MHS with that of the general population.
Methods:
The MHS cases were identified from the Department of Defense’s Automated Central Tumor Registry (ACTUR). Glioma cases from the general population were identified from the National Cancer Institute’s Surveillance, Epidemiology, and End Results (SEER) program. SEER cases were matched 2:1 to ACTUR cases by age, sex, race, histology and diagnosis year. All cases had histologically confirmed glioma diagnosed between January 1, 1987 and December 31, 2013. Kaplan-Meier analysis was conducted to compare survival among the ACTUR and SEER cases. Multivariable Cox proportional hazards models were used to estimate hazard ratios (HRs) and 95% confidence intervals (CIs).
Results:
The study included 2,231 glioma cases from ACTUR and 4,462 cases from SEER. ACTUR cases exhibited significantly better overall survival than SEER cases (HR = 0.74, 95% CI= 0.67–0.83). The survival advantage of the ACTUR patients was observed in most subgroups stratified by age, gender, race, diagnosis year, and histology. For glioblastoma, the survival advantage was observed in both the pre- and post-temozolomide periods.
Conclusions:
Universal MHS health care may have translated into improved survival outcomes in glioma. Future studies are warranted to identify factors contributing to the improved survival.
Keywords: Glioma, Survival, Universal Health Care, Military Health System
Precis:
Glioma patients in a universal care system had significant better survival than similar patients from the U.S. general population.
Introduction
Glioma is the most common type of malignant brain cancer in the United States, constituting approximately 81% of primary malignant brain tumors.1 Glioma are comprised of a broad group of brain tumors of glial origin. Glioblastoma is the most common primary brain cancer in adults and has a poor prognosis with a median survival time of only fourteen months.1
In the U.S. general population, access to health care, as reflected by health insurance, has an impact on survival among cancer patients.2–5 Lack or limited access to health care could affect the utilization of health care services, receipt of treatments, and quality of care delivered, which could lead to reduced survival, as shown in the U.S. general population.2, 6–9 In studies of brain cancer, studies have shown that patients without health insurance or with Medicaid had shorter survival than patients with other insurance coverage.10–12
While the mortality from malignant brain tumors is not a major component of cancer mortality in the U.S. general population, brain cancer ranks the third most common cause of cancer death in the U.S. active duty military, following colon cancer and leukemia.13 The military health system (MHS) provides universal health care to 9.5 million beneficiaries, including active duty service members, National Guard and Reserve members, retirees, and their family members.14 The beneficiaries receive medical care free of charge or with minimal out-of-pocket cost.14 However, it is unknown whether the universal health care access has translated into improved outcome among glioma patients in the MHS. In this study, we compared overall survival of glioma cases in the MHS with that of the general population. In addition, the standard-of-care changed for glioblastoma in 2005, when radiation therapy plus temozolomide chemotherapy replaced radiation therapy alone.15 The change has been correlated with improved survival in general population and other populations with glioblastoma was noted.16–18 For this reason, we also compared overall survival of glioblastoma between MHS and the general population for the time period before 2005, as well as 2005 and after.
Materials and Methods
Data sources
The data source for MHS beneficiaries was the Automated Central Tumor Registry (ACTUR) of the Department of Defense (DoD) and the data for the general population were from the Surveillance, Epidemiology, and End Results (SEER) program of the National Cancer Institute (NCI). ACTUR records and tracks cancer patients who are diagnosed and/or receive cancer treatment at military treatment facilities (MTFs). ACTUR complies with the uniform data standards set by the North American Association of Central Cancer Registries (NAACCR).19 Data are collected on demographics, tumor characteristics, cancer treatment, follow up, vital status and other information. The use of de-identified ACTUR data was approved by the institutional review board of Walter Reed National Military Medical Center.
The SEER program is a U.S. cancer registry program that collects population-based data from the areas covered by the SEER cancer registries. In this study, we used data from the SEER-18 registries (Atlanta, Connecticut, Detroit, Hawaii, Iowa, New Mexico, San Francisco-Oakland, Seattle-Puget Sound, Utah, Los Angeles, San Jose-Monterey, Rural Georgia, the Alaska Native, Greater California, Greater Georgia, Kentucky, Louisiana, and New Jersey), which represents 28% of the U.S. general population.20 Data are collected on demographics, tumor characteristics, first cancer treatment, follow up, vital status, and other information. The SEER data are de-identified for public use.
Study Populations
Adult cases (ages 18 or older) diagnosed with histologically confirmed primary glioma between January 1, 1987 and December 31, 2013 were identified from the ACTUR and SEER databases. Glioma was defined with the cancer site codes (C71.0 to C71.9) and morphology codes (9440, 9441,9442, 9381, 9401,9421,9400,9410, 9411, 9420, 9424, 9382, 9450, 9451, 9460, 9391, 9392, 9393, 9380, 9423, 9430) of the International Classification of Diseases for Oncology, third edition (ICD-O-3).21 Cases with diagnosis from death certificate only or autopsy were excluded. Cases with multiple primary tumors were excluded to minimize effects of other cancers on the study outcomes. To reduce potential confounding effects of demographic variables and histology on survival, the ACTUR and SEER patients were matched on age (within 5 years), sex (male and female), race (white, black, Asian/Pacific islander, other), histology (glioblastoma, non-glioblastoma astrocytoma, oligodendroglia tumor, ependymoma, and other gliomas)22, 23 and diagnosis year (1987–1989, 1990–1994, 1995–1999, 2000–2004, 2005–2009, 2010–2013) with a matching ratio of 1:2. Cases with missing values for matching variables were excluded.
Study Variables
Variables extracted from both ACTUR and SEER included demographics, cancer diagnosis, tumor features, surgery, follow up, and vital status. Since brain tumors do not typically spread outside of the brain, there are no standard staging systems for adult brain tumors.24 According to tumor clinical features and behaviors, brain tumors were graded into “well differentiated (grade I)”, “moderately differentiated (grade II)”, “poorly differentiated (grade III)”, “un-differentiated(grade IV)”using ICD-O-3 standard.25 Histology was grouped into glioblastoma, non-glioblastoma astrocytoma, oligodendroglia tumor, ependymoma, and other gliomas.22 Tumor location was defined as following groups: supratentorial (ICD-O-3 71.0–71.4), infratentorial (ICD-O-3 C71.6, 71.7), or other (ICD-O-3 71.5, 71.8, 71.9) if the site was unspecified or had overlapping regions.26 Site-specific surgery codes were used to define surgery types and then grouped into “cancer-directed surgery received”, “no cancer-directed surgery” or “unknown or missing” according to SEER guidelines.27 Receipt of radiation therapy was grouped into “yes”, “no”, and “unknown or missing”. All-cause mortality was used as the study outcome since data on cause of death were not complete in ACTUR.
Statistical Analysis
We first compared the distributions of demographic and tumor characteristics among ACTUR and SEER patients using the Chi-Square test. Kaplan-Meier curves with log rank test were used to compare overall survival between ACTUR and SEER cases. Multivariable Cox proportional hazards model for matched data was then used to estimate hazard ratios (HR) and 95% confidence intervals (CI) overall survival among ACTUR cases compared to SEER cases. The proportional hazards assumption was checked by plotting the log-log survival curves.28 Follow-up time was calculated from diagnosis to death during five-year period. If death was not observed during the period, follow-up time was censored at the end of the fifth year. Patients who were not dead through the end of the study without a full five-year follow-up time were censored on the study ending date (i.e. December 31, 2013). To control for potential confounding from non-matching variables, multivariable Cox regression models were used to adjust for tumor grade (grade I, grade II, grade III, grade IV, or unknown), tumor location (supratentorial, infratentorial, or other), ethnicity (Hispanic, non-Hispanic, unknown), cancer-directed surgery (yes, no, or unknown) and age as a continuous variable. The analysis was further stratified by age, sex, race, diagnosis year, tumor histology, surgery or radiation. Considering potential p value inflation due to testing multiple hypotheses in this analysis, we implemented the false discovery rate (FDR) correction for multiple comparisons and reported FDR-corrected p values.29
Finally, multivariable Cox regression models were used to compare survival of ACTUR cases with SEER case with glioblastoma in the temozolomide era (i.e. 2005–2013) and the pre-temozolomide era (1987–2003). Data from year 2004 was not used in this analysis because 2004 was a transition year between the two eras.18
All statistical analyses were conducted using SAS software version 9.4.0 (SAS Institute, Inc.). All reported p-values were two sided with a significance level of p<0.05.
Results
A total number of 2,231 cases were identified from ACTUR and 4,462 cases from SEER. Demographic and tumor characteristics of cases were shown in Table 1. The ACTUR and SEER cases had the same distributions of the matching variables (age group, sex, race, year of diagnosis and histology group). ACTUR cases were more likely to have well differentiated tumors (5.92% vs. 3.45%) and poorly differentiated tumors than the SEER cases (8.56% vs. 7.31%), but less likely to have moderately differentiated tumors (10.31% vs. 11.27%) (p<0.001) (Table 1). ACTUR cases had a higher percentage of supratentorial tumors (74.59% vs. 70.89%), a lower percentage of infratentorial tumors (6.54% vs. 7.53%) and tumors of other locations (18.87% vs. 21.58%) (p<0.001). In regard to surgery treatment, the ACTUR cases were less likely than the SEER cases to receive cancer-directed surgery (72.84% vs. 77.21%), but more likely to have missing information on surgery (3.72% vs. 0.96) (p<0.001).
Table 1.
Characteristics of glioma cases diagnosed during 1987–2013 from ACTUR and SEER registries
| ACTUR (N=2,231) | SEER (N4,462) | p-value | |||
|---|---|---|---|---|---|
| N | % | N | % | ||
| 1.00 | |||||
| 18–39 | 940 | 42.13 | 1880 | 42.13 | |
| 40–54 | 492 | 22.05 | 984 | 22.05 | |
| 55–64 | 424 | 19.00 | 848 | 19.00 | |
| 65 or older | 375 | 16.81 | 750 | 16.81 | |
| Sex | 1.00 | ||||
| Male | 1554 | 69.65 | 3108 | 69.65 | |
| Female | 677 | 30.35 | 1354 | 30.35 | |
| Race | 1.00 | ||||
| White | 2025 | 90.77 | 4050 | 90.77 | |
| Black | 140 | 6.28 | 280 | 6.28 | |
| Asian or Pacific Islander | 54 | 2.42 | 108 | 2.42 | |
| Other | 12 | 0.54 | 24 | 0.54 | |
| Year of diagnosis | 1.00 | ||||
| 1987–1989 | 240 | 10.76 | 480 | 10.76 | |
| 1990–1994 | 530 | 23.76 | 1060 | 23.76 | |
| 1995–1999 | 402 | 18.02 | 804 | 18.02 | |
| 2000–2004 | 378 | 16.94 | 756 | 16.94 | |
| 2005–2009 | 377 | 16.90 | 754 | 16.90 | |
| 2010–2013 | 304 | 13.63 | 608 | 13.63 | |
| Histology group | 1.00 | ||||
| Glioblastoma | 965 | 43.25 | 1930 | 43.25 | |
| Non-glioblastoma astrocytomas | 782 | 35.05 | 1564 | 35.05 | |
| Oligodendroglial tumors | 317 | 14.21 | 634 | 14.21 | |
| Ependymoma | 47 | 2.11 | 94 | 2.11 | |
| Other gliomas | 120 | 5.38 | 240 | 5.38 | |
| Tumor grade | <0.001 | ||||
| Well differentiated, grade1 | 132 | 5.92 | 154 | 3.45 | |
| Moderately differentiated, grade 2 | 230 | 10.31 | 503 | 11.27 | |
| Poorly differentiated, grade 3 | 191 | 8.56 | 326 | 7.31 | |
| Undifferentiated, grade 4 | 779 | 34.92 | 1564 | 35.05 | |
| Unknown | 899 | 40.30 | 1915 | 42.92 | |
| Tumor location | 0.006 | ||||
| Supratentorial | 1664 | 74.59 | 3163 | 70.89 | |
| Infratentorial | 146 | 6.54 | 336 | 7.53 | |
| Other locations | 421 | 18.87 | 963 | 21.58 | |
| Caner-directed surgery | <0.001 | ||||
| No | 523 | 23.44 | 974 | 21.83 | |
| Yes | 1625 | 72.84 | 3445 | 77.21 | |
| Unknown or Missing | 83 | 3.72 | 43 | 0.96 | |
| Radiation | <0.001 | ||||
| No | 659 | 29.54 | 1336 | 29.94 | |
| Yes | 1464 | 65.62 | 3012 | 67.50 | |
| Unknown or Missing | 108 | 4.84 | 114 | 2.55 | |
The median survival times were 20 months (95% CI=19 to 21 months) and 23 months (95% CI=21 to 25 months) for the SEER and ACTUR patients, respectively. The Kaplan-Meier survival curves showed slightly better overall survival for ACTUR than SEER, but the difference was not statistically significant (Log Rank p=0.08)(Figure 1). In multivariable Cox regression models, ACTUR cases exhibited significantly better overall survival than SEER cases (HR = 0.74, 95% CI=0.67 to 0.83) (Table 2). When the model was stratified by demographics, diagnosis year group and histology (Table 2), the significant survival advantage of the ACTUR cases was present among subgroups of cases aged 18–39 years (HR=0.77, 95% CI=0.63 to 0.95), 40–54 years (HR=0.69, 95% CI=0.56 to 0.85), 55–69 years (HR=0.73, 95% CI=0.60 to 0.88), men (HR=0.73, 95% CI=0.64 to 0.83), women (HR=0.75, 95% CI=0.62 to 0.91), whites (HR=0.82, 95% CI=0.75 to 0.90), blacks (HR=0.49, 95% CI=0.33 to 0.73) and those diagnosed during 1990–1994 (HR=0.63, 95% CI=0.44 to 0.91), 2000–2004 (HR=0.71, 95% CI=0.58 to 0.87), and 2005–2009 (HR=0.63, 95% CI=0.50 to 0.80). When stratified by age≥ 65 vs. <65, the Medicare eligible age, the HRs for those ≥ 65 and < 65 were 0.83 (95% CI=0.66–1.04) and 0.71 (95% CI=0.63–0.80), respectively. In stratified analysis by tumor histology, significantly better survival was present in glioblastomas (HR=0.77, 95% CI=0.67 to 0.89) and non-glioblastoma astrocytomas (HR=0.69, 95% CI=0.56 to 0.85). Significantly better survival of ACTUR cases than SEER cases was observed regardless of surgery receipt with a HR of 0.77 (95%CI=0.68 to 0.88) and 0.61 (95%CI=0.42 to 0.89) for patients with and without surgery, respectively. When stratified by radiation, the better survival was observed only among patients who did not receive radiation (HR=0.74, 95% CI=0.65–0.85).
Figure 1.
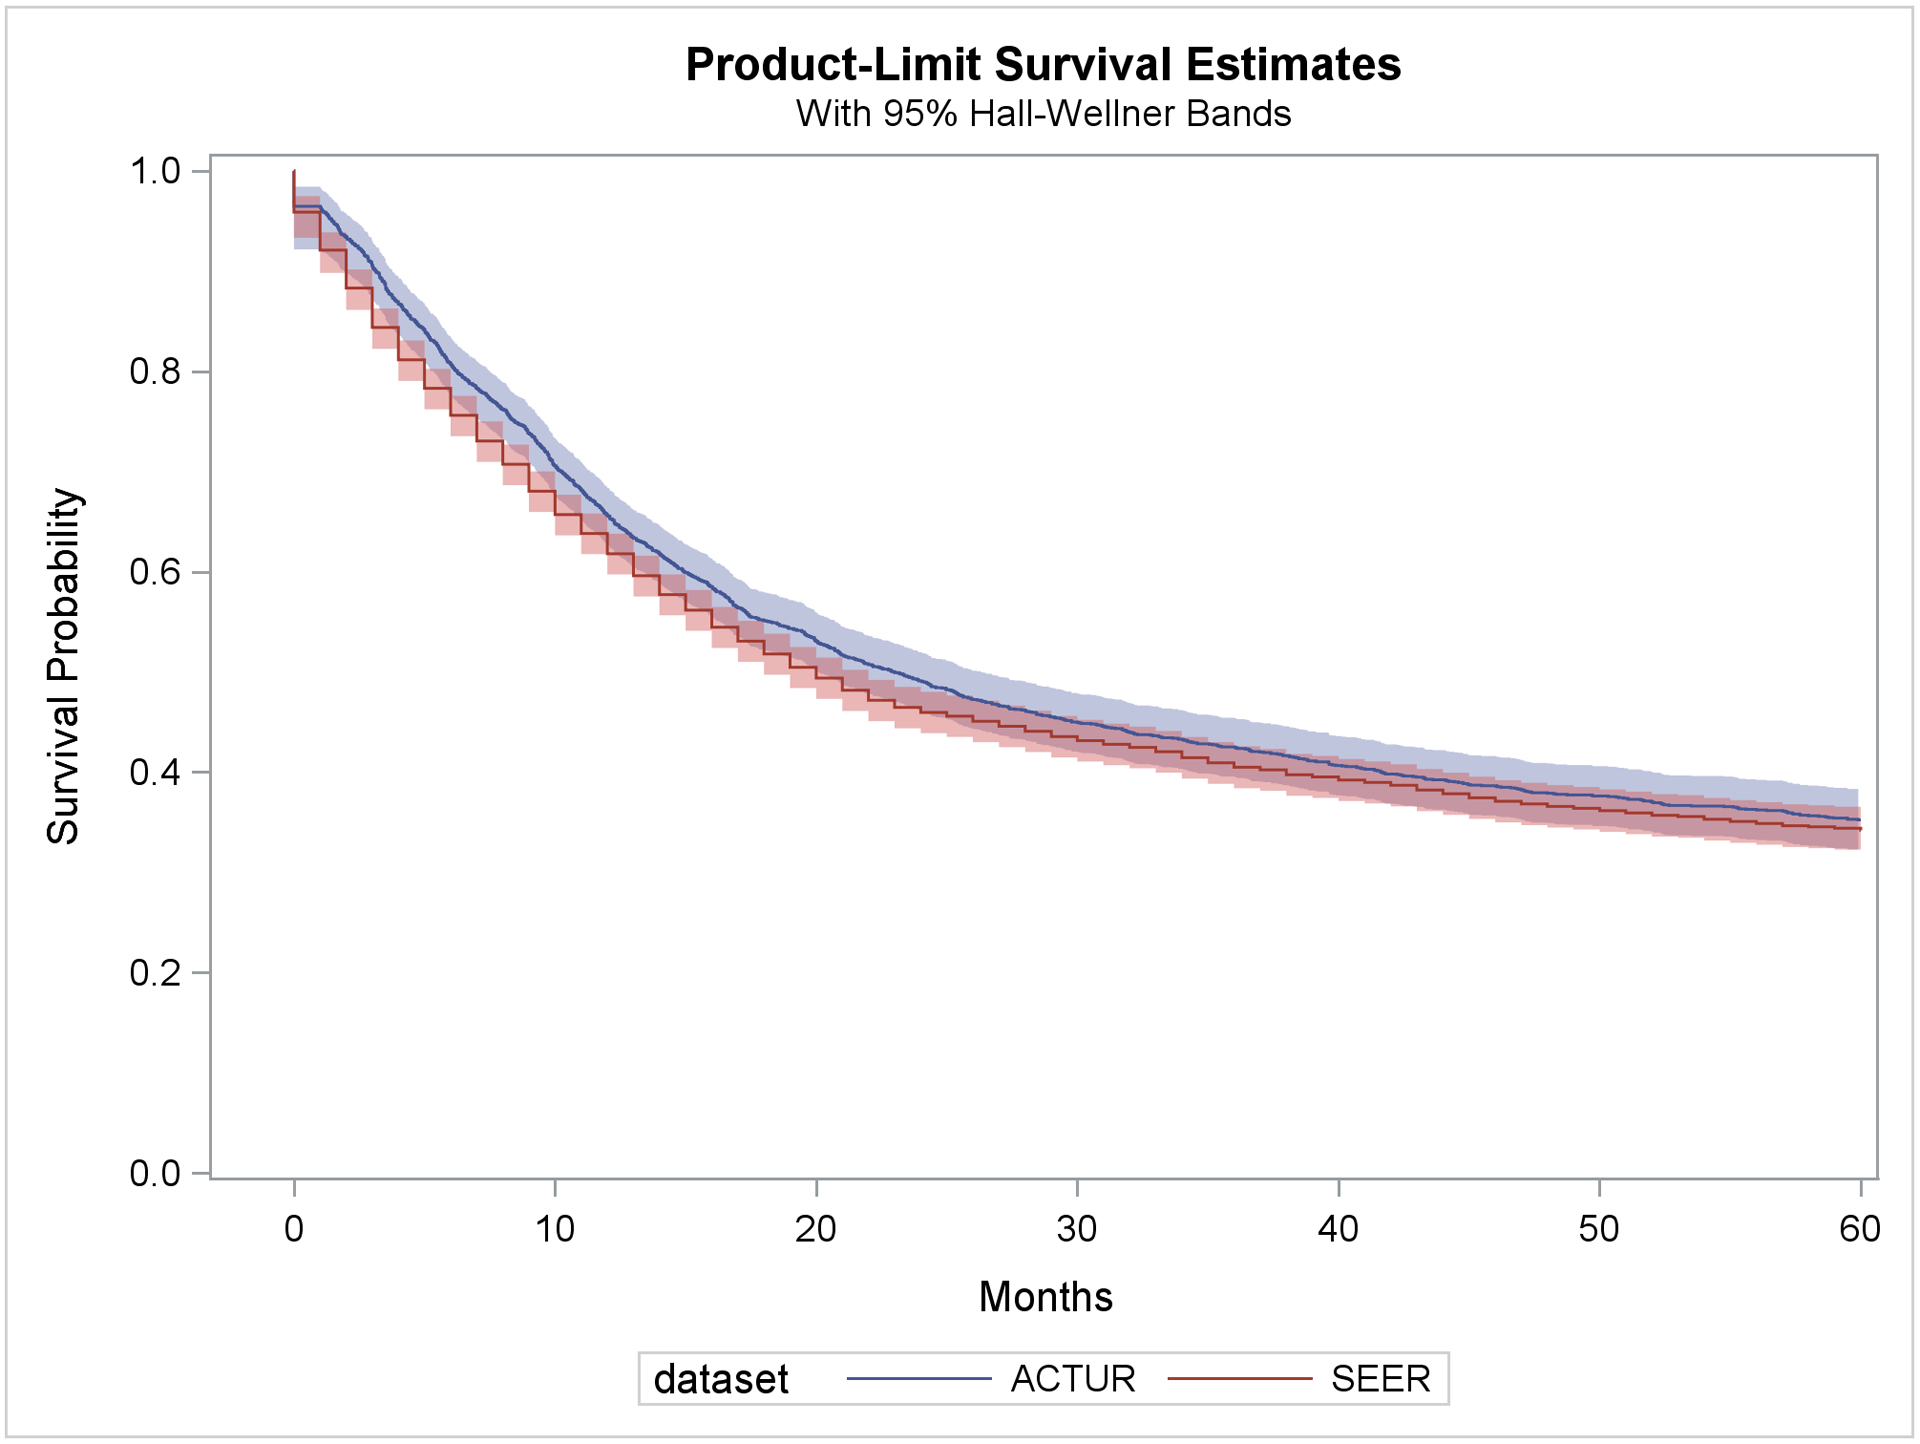
Kaplan-Meier survival curve for ACTUR and SEER patients with glioma diagnosed during 1987–2013
Table 2.
Overall and stratified hazard ratios of all-cause mortality comparing ACTUR with SEER among glioma cases diagnosed between 1987 and 2013
| Variables | Numbers | Adjusted HR (95% CI)* | p-value# | |
|---|---|---|---|---|
| All cases | Deaths | |||
| Overall | ||||
| SEER | 4462 | 2775 | 1.00 (ref.) | |
| ACTUR | 2231 | 1365 | 0.74 (0.67–0.83) | <0.001 |
| By age groups | ||||
| 18–39 | ||||
| SEER | 1880 | 649 | 1.00 (ref.) | |
| ACTUR | 940 | 299 | 0.77 (0.63–0.95) | 0.022 |
| 40–54 | ||||
| SEER | 984 | 671 | 1.00 (ref.) | |
| ACTUR | 492 | 338 | 0.69 (0.56–0.85) | 0.001 |
| 55–69 | ||||
| SEER | 1116 | 993 | 1.00 (ref.) | |
| ACTUR | 558 | 499 | 0.73 (0.60–0.88) | 0.002 |
| 70 or older | ||||
| SEER | 482 | 462 | 1.00 (ref.) | |
| ACTUR | 241 | 229 | 0.80 (0.60–1.05) | 0.168 |
| By sex | ||||
| Male | 3108 | 1953 | 1.00 (ref.) | |
| SEER | 1554 | 956 | 0.73 (0.64–0.83) | <0.001 |
| ACTUR | ||||
| Female | ||||
| SEER | 1354 | 822 | 1.00 (ref.) | |
| ACTUR | 677 | 409 | 0.75 (0.62–0.91) | 0.007 |
| By race | ||||
| White | ||||
| SEER | 4050 | 2515 | 1.00 (ref.) | |
| ACTUR | 2025 | 1245 | 0.82 (0.75–0.90) | <0.001 |
| Black | ||||
| SEER | 280 | 175 | 1.00 (ref.) | |
| ACTUR | 140 | 78 | 0.49 (0.33–0.73) | 0.001 |
| Asian or Pacific Islander | ||||
| SEER | 108 | 75 | 1.00 (ref.) | |
| ACTUR | 54 | 36 | 0.51 (0.22–1.16) | 0.168 |
| By year of diagnosis | ||||
| 1987–1989 | ||||
| SEER | 480 | 324 | 1.00 (ref.) | |
| ACTUR | 240 | 150 | 0.60 (0.30–1.19) | 0.195 |
| 1990–1994 | ||||
| SEER | 1060 | 719 | 1.00 (ref.) | |
| ACTUR | 530 | 361 | 0.63 (0.44–0.91) | 0.022 |
| 1995–1999 | ||||
| SEER | 804 | 525 | 1.00 (ref.) | |
| ACTUR | 402 | 270 | 0.93 (0.75–1.17) | 0.655 |
| 2000–2004 | ||||
| SEER | 756 | 504 | 1.00 (ref.) | |
| ACTUR | 378 | 230 | 0.71 (0.58–0.87) | 0.003 |
| 2005–2009 | ||||
| SEER | 754 | 457 | 1.00 (ref.) | |
| ACTUR | 377 | 207 | 0.63 (0.50–0.80) | <0.001 |
| 2010–2013 | ||||
| SEER | 608 | 246 | 1.00 (ref.) | |
| ACTUR | 304 | 147 | 0.85 (0.63–1.15) | 0.361 |
| By histology | ||||
| Glioblastoma | ||||
| SEER | 1930 | 1734 | 1.00 (ref.) | |
| ACTUR | 965 | 888 | 0.77 (0.67–0.89) | 0.001 |
| Non-glioblastoma astrocytomas | ||||
| SEER | 1564 | 758 | 1.00 (ref.) | |
| ACTUR | 782 | 344 | 0.69 (0.56–0.85) | 0.001 |
| Oligodendroglial tumors | ||||
| SEER | 634 | 166 | 1.00 (ref.) | |
| ACTUR | 317 | 72 | 0.79 (0.53–1.18) | 0.320 |
| Ependymoma | ||||
| SEER | 94 | 19 | 1.00 (ref.) | |
| ACTUR | 47 | 11 | 0.95 (0.19–4.76) | 0.951 |
| Other gliomas | ||||
| SEER | 240 | 98 | 1.00 (ref.) | |
| ACTUR | 120 | 50 | 1.04 (0.60–1.79) | 0.929 |
| By Surgery | ||||
| Yes | 3445 | 2006 | 1.00 (ref.) | |
| SEER | 1625 | 921 | 0.75 (0.66–0.86) | <0.001 |
| ACTUR | ||||
| No | ||||
| SEER | 974 | 736 | 1.00 (ref.) | |
| ACTUR | 523 | 377 | 0.57 (0.39–0.83) | 0.007 |
| Unknown | ||||
| SEER | 43 | 33 | 1.00 (ref.) | |
| ACTUR | 83 | 67 | 1.31 (0.39–4.42) | 0.712 |
| By Radiation | ||||
| Yes | ||||
| SEER | 3012 | 2081 | 1.00 (ref.) | |
| ACTUR | 1464 | 980 | 0.92 (0.65–1.30) | 0.712 |
| No | ||||
| SEER | 1336 | 617 | 1.00 (ref.) | |
| ACTUR | 659 | 311 | 0.74 (0.65–0.85) | <0.001 |
| Unknown | ||||
| SEER | 114 | 77 | 1.00 (ref.) | |
| ACTUR | 108 | 74 | 0.73 (0.48–1.11) | 0.195 |
All HRs were estimated from multivariable Cox proportional hazard model for matched data. In the overall analysis, HR was further adjusted for age (as continuous variable), Hispanic origin, tumor grade, tumor location, surgery and radiation. In stratified analysis, all variables adjusted in the overall analysis were adjusted except the stratified variable itself.
All p values were corrected for multiple comparisons.
HR=Hazard ratio; CI=Confidence Interval
Table 3 shows the comparisons of patients with glioblastoma for pre- temozolomide and temozolomide eras, respectively. Better survival of ACTUR glioblastoma cases than SEER cases was observed during both periods (HR=0.79, 95% CI=0.64 to 0.96 for 1987–2003, the pre- temozolomide era, and HR=0.82, 95% CI=0.66 to 1.01 for 2005–2013 period, the temozolomide era, respectively), although the HR for the temozolomide era was only borderline significant (Table 3).
Table 3.
Hazard ratios of all-cause mortality comparing ACTUR with SEER among glioblastoma cases stratified by diagnosis year period
| Variables | Numbers | Adjusted HR (95% CI)* | p-value | |
|---|---|---|---|---|
| All cases | Deaths | |||
| Year 1987–2003 | ||||
| SEER | 1227 | 1172 | 1.00 (ref.) | |
| ACTUR | 617 | 588 | 0.79 (0.64–0.96) | 0.019 |
| Year 2005–2013 | ||||
| SEER | 634 | 497 | 1.00 (ref.) | |
| ACTUR | 317 | 273 | 0.82 (0.66–1.01) | 0.065 |
Adjusted for age (as continuous variable), sex, race, Hispanic origin, year of diagnosis, tumor grade, tumor location, surgery and radiation
HR=Hazard ratio; CI=Confidence Interval
Discussion
In this study, we found that glioma cases in the MHS had better overall survival than those in the general population. Our results suggest that the MHS’s universal health care may improve glioma survival outcome.
We previously reported better overall survival of non-small cell lung cancer patients in MHS than in the SEER population.30 In a study of invasive breast cancer, Ru et al. (2017) found that MHS beneficiaries treated at a U.S. military medical center had higher breast cancer specific survival than did the SEER patients.31 The improved survival of MHS beneficiaries with different cancers may support the benefit of universal health care for cancer patients. In this study of glioma, we observed a nearly 25% reduced all-cause mortality for the MHS cases compared to that of the SEER cases. This adds additional evidence, suggesting that the improved survival may not be cancer-site specific.
In the MHS, beneficiaries receive medical care free of charge or with minimal out-of-pocket cost and thus financial barriers to care are minimized. Studies of the U.S. general population regarding influence of health care access (or health insurance status) on the survival of cancer patients have found that patients without health insurance or those with Medicaid had worse survival than patients with insurance, especially those with private insurance.2–4, 8, 32, 33. In studies of brain cancer, a SEER-based study of 13,665 adult patients with glioblastoma reported that uninsured patients and patients with Medicaid had significantly worse glioblastoma-specific survival than patients with other insurance plans.10 A recent study based on the National Cancer Database (NCDB) reported better overall survival for patients with private insurance and other insurance than for uninsured patients with glioblastoma.11
To the best of our knowledge, our study is the first study comparing survival of glioma patients in the MHS and the U.S. general populations. As one of the largest health care providers in the U.S., the MHS provides health care for 9.5 million beneficiaries.14 Regarding cancer care, the recent TRICARE (DoD’s health insurance program) report to congress showed better utilization of screening services for several cancers among beneficiaries compared to national bench marks.14 Early detection of low-grade glioma is essential to improve survival because low-grade glioma progresses rapidly to the non- “de-novo” high-grade glioma and death.34
In stratified analysis, the better survival for the MHS cases was observed in a majority of subgroups by demographics and tumor histology. In particular, better survival was significant for patients with glioblastoma and non-glioblastoma astrocytoma, the two most common types of glioma. The improved survival for glioblastoma, an aggressive tumor with poor prognosis, suggests that the survival advantage of the MHS cases was still evident for aggressive tumors. The better survival was not observed in other histological types likely due to either small numbers or low death rates of these rare types of glioma. In stratified analysis by race, although the CIs of HRs overlapped, it is noteworthy that the lowest reduced mortality was observed for blacks (i.e. a nearly 50% reduction in morality). This suggests that blacks, who have less access to care than whites in the general population,35, 36 may benefit more than whites from the universal health care provided by the MHS. It is also noteworthy that in the stratified analysis by surgery, the survival advantage of ACTUR over SEER was present regardless of whether patients received surgery or not. This suggests that the receipt of surgery might not modify the survival differences between the two populations. It is unknown why the survival advantage did not show among those who received radiation therapy. However, the role of radiation treatment on the survival difference should be better evaluated in the context of treatment combinations and modalities. The lack of association in this stratum may also be related to confounding factors that are not included in the study.
The mechanisms for the improved survival in the MHS may be related to multiple factors along the continuum of cancer care. In studies of the general population, the worse survival of uninsured patients and Medicaid patients with glioma was correlated with lower likelihood to receive recommended treatment modality,10–12, 37–39 higher odds of delayed treatment,38 and lack of primary care physicians.12 To our knowledge, there have been no studies of glioma that compare treatment receipt, health care delivery, quality of care or other factors between MHS and the general population. Further research on differences between the two populations on these factors is warranted to reveal possible mechanisms. As noted previously, the better survival of ACTUR over SEER was observed among cases with surgery and those without surgery, and that the better survival was present after adjusting for surgery in the models, indicating that surgery alone may not play an appreciable role in the survival difference observed. However, given the complexity of treatment modalities for glioma, a heterogonous group of diseases, the potential role of treatment adherence in the survival difference cannot be fully evaluated without an in-depth analysis of specific surgery types and other therapies.
We observed a similar survival advantage of ACTUR cases over SEER cases among glioblastoma patients during the temozolomide era and the pre- temozolomide period. The similar results suggest that the differences in overall survival between the two populations remained despite the change in standard care from radiation therapy alone to radiation therapy plus temozolomide.
Our study has the strength of having large numbers of cases of glioma, a relative rare cancer, from the DoD and SEER cancer registries. We also applied a matching procedure in the study design to rigorously control for confounding effects of prognostic factors on survival. However, due to the limitation of cancer registry data, confounding effects from other factors not available in the cancer registry data cannot be excluded. In addition, since all-cause mortality rather than cancer-specific death was used as the outcome, the potential effects from causes other than glioma on the survival difference cannot be excluded. Finally, there is a concern of potential overlap between cases from MHS and SEER. However, if there is overlap, the overlap would only dilute the survival difference between the two populations and the true hazard ratios would be lower than what are observed in this study. Thus, our current estimates of HRs are rather conservative.
In conclusion, we found better survival of glioma patients in the MHS than the U.S. general population. Universal care in the MHS may have translated into improved survival outcome of glioma. Future studies are warranted to identify health care and delivery factors that may contribute to the improved survival outcome in the MHS.
Acknowledgement:
The authors thank Joint Pathology Center and SEER program for using the cancer registry data.
Funding:
This project was supported by Murtha Cancer Center Research Program via Uniformed Services University of the Health Sciences under the auspices of the Henry. M. Jackson Foundation for the Advancement of Military medicine.
Footnotes
Publisher's Disclaimer: Disclaimers: The contents of this publication are the sole responsibility of the author(s) and do not necessarily reflect the views, opinions or policies of Uniformed Services University of the Health Sciences (USUHS), The Henry M. Jackson Foundation for the Advancement of Military Medicine, Inc., the Department of Defense (DoD), the Departments of the Army, Navy, or Air Force. Mention of trade names, commercial products, or organizations does not imply endorsement by the U.S. Government.
Conflict of Interest Disclosure: None
References
- 1.Ostrom QT, Gittleman H, Truitt G, Boscia A, Kruchko C, Barnholtz-Sloan JS. CBTRUS Statistical Report: Primary Brain and Other Central Nervous System Tumors Diagnosed in the United States in 2011–2015. Neuro Oncol. 2018;20: iv1–iv86. [DOI] [PMC free article] [PubMed] [Google Scholar]
- 2.Walker GV, Grant SR, Guadagnolo BA, et al. Disparities in stage at diagnosis, treatment, and survival in nonelderly adult patients with cancer according to insurance status. J Clin Oncol. 2014;32: 3118–3125. [DOI] [PMC free article] [PubMed] [Google Scholar]
- 3.Lee JM, Wang X, Ojha RP. The effect of health insurance on childhood cancer survival in the United States. Cancer. 2017;123: 4878–4885. [DOI] [PubMed] [Google Scholar]
- 4.Aizer AA, Falit B, Mendu ML, et al. Cancer-specific outcomes among young adults without health insurance. J Clin Oncol. 2014;32: 2025–2030. [DOI] [PMC free article] [PubMed] [Google Scholar]
- 5.Amini A, Yeh N, Jones BL, et al. Perioperative Mortality in Nonelderly Adult Patients With Cancer: A Population-based Study Evaluating Health Care Disparities in the United States According to Insurance Status. Am J Clin Oncol. 2018;41: 476–484. [DOI] [PubMed] [Google Scholar]
- 6.Ward EM, Fedewa SA, Cokkinides V, Virgo K. The association of insurance and stage at diagnosis among patients aged 55 to 74 years in the national cancer database. Cancer J. 2010;16: 614–621. [DOI] [PubMed] [Google Scholar]
- 7.Halpern MT, Ward EM, Pavluck AL, Schrag NM, Bian J, Chen AY. Association of insurance status and ethnicity with cancer stage at diagnosis for 12 cancer sites: a retrospective analysis. Lancet Oncol. 2008;9: 222–231. [DOI] [PubMed] [Google Scholar]
- 8.Slatore CG, Au DH, Gould MK. An official American Thoracic Society systematic review: insurance status and disparities in lung cancer practices and outcomes. Am J Respir Crit Care Med. 2010;182: 1195–1205. [DOI] [PubMed] [Google Scholar]
- 9.Wu XC, Lund MJ, Kimmick GG, et al. Influence of race, insurance, socioeconomic status, and hospital type on receipt of guideline-concordant adjuvant systemic therapy for locoregional breast cancers. J Clin Oncol. 2012;30: 142–150. [DOI] [PubMed] [Google Scholar]
- 10.Rong X, Yang W, Garzon-Muvdi T, et al. Influence of insurance status on survival of adults with glioblastoma multiforme: A population-based study. Cancer. 2016;122: 3157–3165. [DOI] [PubMed] [Google Scholar]
- 11.Rhome R, Fisher R, Hormigo A, Parikh RR. Disparities in receipt of modern concurrent chemoradiotherapy in glioblastoma. J Neurooncol. 2016;128: 241–250. [DOI] [PubMed] [Google Scholar]
- 12.Chandra A, Rick JW, Dalle Ore C, et al. Disparities in health care determine prognosis in newly diagnosed glioblastoma. Neurosurg Focus. 2018;44: E16. [DOI] [PMC free article] [PubMed] [Google Scholar]
- 13.Lee T, Williams VF, Clark LL. Incident diagnoses of cancers in the active component and cancer-related deaths in the active and reserve components, U.S. Armed Forces, 2005–2014. MSMR. 2016;23: 23–31. [PubMed] [Google Scholar]
- 14.The Evaluation of the TRICARE Program: Fiscal Year 2019 Report to Congress: https://health.mil/Military-Health-Topics/Access-Cost-Quality-and-Safety/Health-Care-Program-Evaluation/Annual-Evaluation-of-the-TRICARE-Program; AccessedJuly 24, 2019.
- 15.Stupp R, Mason WP, van den Bent MJ, et al. Radiotherapy plus concomitant and adjuvant temozolomide for glioblastoma. N Engl J Med. 2005;352: 987–996. [DOI] [PubMed] [Google Scholar]
- 16.Koshy M, Villano JL, Dolecek TA, et al. Improved survival time trends for glioblastoma using the SEER 17 population-based registries. J Neurooncol. 2012;107: 207–212. [DOI] [PMC free article] [PubMed] [Google Scholar]
- 17.Dubrow R, Darefsky AS, Jacobs DI, et al. Time trends in glioblastoma multiforme survival: the role of temozolomide. Neuro Oncol. 2013;15: 1750–1761. [DOI] [PMC free article] [PubMed] [Google Scholar]
- 18.Johnson DR, O’Neill BP. Glioblastoma survival in the United States before and during the temozolomide era. J Neurooncol. 2012;107: 359–364. [DOI] [PubMed] [Google Scholar]
- 19.Tryo J User’s Guide for ACTUR cancer registry software system abstacting module. 2007.
- 20.SEER*Stat Databases: November 2015 Submission. Case Listing and Frequency Sessions: https://seer.cancer.gov/data-software/documentation/seerstat/nov2015/Surveillance, Epidemiology, and End Results Program. AccessedJuly 31, 2019. [Google Scholar]
- 21.International Classification of Diseases for Oncology, 3rd Edition (ICD-O-3). World Health Organization. https://www.who.int/classifications/icd/adaptations/oncology/en/; AccessedJuly 31, 2019. [Google Scholar]
- 22.Ostrom QT, Cote DJ, Ascha M, Kruchko C, Barnholtz-Sloan JS. Adult Glioma Incidence and Survival by Race or Ethnicity in the United States From 2000 to 2014. JAMA Oncol. 2018;4: 1254–1262. [DOI] [PMC free article] [PubMed] [Google Scholar]
- 23.Ostrom QT, Cioffi G, Gittleman H, et al. CBTRUS Statistical Report: Primary Brain and Other Central Nervous System Tumors Diagnosed in the United States in 2012–2016. Neuro Oncol. 2019;21: v1–v100. [DOI] [PMC free article] [PubMed] [Google Scholar]
- 24.General Information About Adult Central Nervous Systems Tumors: https://www.cancer.gov/types/brain/hp/adult-brain-treatment-pdq.National Cancer Institute. AccessedJuly 31, 2019. [Google Scholar]
- 25.Grading Brain Tumors. Site-Specific Modules. SEER Training Modules, National Cancer Institute. https://training.seer.cancer.gov/brain/tumors/abstract-code-stage/grading.html.Accesed onJuly 31, 2019. [Google Scholar]
- 26.Topographic Sites. Brain and Other Central Nervous System Tumors. Site-Specific Modules. SEER Training Modules, National Cancer Intitute. https://training.seer.cancer.gov/brain/tumors/abstract-code-stage/topographic.html.AccessedJuly 31, 2019. [Google Scholar]
- 27.Standard Treatment & Surgery Codes, Brain and Other Nervous System Tumors. SEER Training Modules, National Cancer Institute. https://training.seer.cancer.gov/brain/tumors/abstract-code-stage/codes.html; AccessedJuly 31, 2019.
- 28.Lee EW JW. Statistical Methods for Survival Data Analysis, Third Edition. Hoboken, New Jersey: John Wiley & Sons, Inc., 2003. [Google Scholar]
- 29.Hochberg Y, Benjamini Y. More powerful procedures for multiple significance testing. Stat Med. 1990;9: 811–818. [DOI] [PubMed] [Google Scholar]
- 30.Lin J, Kamamia C, Brown D, et al. Survival among Lung Cancer Patients in the U.S. Military Health System: A Comparison with the SEER Population. Cancer Epidemiol Biomarkers Prev. 2018;27: 673–679. [DOI] [PMC free article] [PubMed] [Google Scholar]
- 31.Ru Y, Liu J, Fantacone-Campbell JL, et al. Comparative Survival Analysis of Invasive Breast Cancer Patients Treated by a U.S. Military Medical Center and Matched Patients From the U.S. General Population. Mil Med. 2017;182: e1851–e1858. [DOI] [PubMed] [Google Scholar]
- 32.Markt SC, Lago-Hernandez CA, Miller RE, et al. Insurance status and disparities in disease presentation, treatment, and outcomes for men with germ cell tumors. Cancer. 2016;122: 3127–3135. [DOI] [PMC free article] [PubMed] [Google Scholar]
- 33.Hsu CD, Wang X, Habif DV Jr., Ma CX, Johnson KJ. Breast cancer stage variation and survival in association with insurance status and sociodemographic factors in US women 18 to 64 years old. Cancer. 2017;123: 3125–3131. [DOI] [PubMed] [Google Scholar]
- 34.Claus EB, Walsh KM, Wiencke JK, et al. Survival and low-grade glioma: the emergence of genetic information. Neurosurg Focus. 2015;38: E6. [DOI] [PMC free article] [PubMed] [Google Scholar]
- 35.Shavers VL, Brown ML. Racial and ethnic disparities in the receipt of cancer treatment. J Natl Cancer Inst. 2002;94: 334–357. [DOI] [PubMed] [Google Scholar]
- 36.DeSantis CE, Siegel RL, Sauer AG, et al. Cancer statistics for African Americans, 2016: Progress and opportunities in reducing racial disparities. CA Cancer J Clin. 2016;66: 290–308. [DOI] [PubMed] [Google Scholar]
- 37.Brown DA, Himes BT, Kerezoudis P, et al. Insurance correlates with improved access to care and outcome among glioblastoma patients. Neuro Oncol. 2018;20: 1374–1382. [DOI] [PMC free article] [PubMed] [Google Scholar]
- 38.Pollom EL, Fujimoto DK, Han SS, Harris JP, Tharin SA, Soltys SG. Newly diagnosed glioblastoma: adverse socioeconomic factors correlate with delay in radiotherapy initiation and worse overall survival. J Radiat Res. 2018;59: i11–i18. [DOI] [PMC free article] [PubMed] [Google Scholar]
- 39.Sherwood PR, Dahman BA, Donovan HS, Mintz A, Given CW, Bradley CJ. Treatment disparities following the diagnosis of an astrocytoma. J Neurooncol. 2011;101: 67–74. [DOI] [PubMed] [Google Scholar]