

Abstract
BACKGROUND
Bilateral vestibular hypofunction is associated with chronic disequilibrium, postural instability, and unsteady gait owing to failure of vestibular reflexes that stabilize the eyes, head, and body. A vestibular implant may be effective in alleviating symptoms.
METHODS
Persons who had had ototoxic (7 participants) or idiopathic (1 participant) bilateral vestibular hypofunction for 2 to 23 years underwent unilateral implantation of a prosthesis that electrically stimulates the three semicircular canal branches of the vestibular nerve. Clinical outcomes included the score on the Bruininks–Oseretsky Test of Motor Proficiency balance subtest (range, 0 to 36, with higher scores indicating better balance), time to failure on the modified Romberg test (range, 0 to 30 seconds), score on the Dynamic Gait Index (range, 0 to 24, with higher scores indicating better gait performance), time needed to complete the Timed Up and Go test, gait speed, pure-tone auditory detection thresholds, speech discrimination scores, and quality of life. We compared participants’ results at baseline (before implantation) with those at 6 months (8 participants) and at 1 year (6 participants) with the device set in its usual treatment mode (varying stimulus pulse rate and amplitude to represent rotational head motion) and in a placebo mode (holding pulse rate and amplitude constant).
RESULTS
The median scores at baseline and at 6 months on the Bruininks–Oseretsky test were 17.5 and 21.0, respectively (median within-participant difference, 5.5 points; 95% confidence interval [CI], 0 to 10.0); the median times on the modified Romberg test were 3.6 seconds and 8.3 seconds (difference, 5.1; 95% CI, 1.5 to 27.6); the median scores on the Dynamic Gait Index were 12.5 and 22.5 (difference, 10.5 points; 95% CI, 1.5 to 12.0); the median times on the Timed Up and Go test were 11.0 seconds and 8.7 seconds (difference, 2.3; 95% CI, −1.7 to 5.0); and the median speeds on the gait-speed test were 1.03 m per second and 1.10 m per second (difference, 0.13; 95% CI, −0.25 to 0.30). Placebo-mode testing confirmed that improvements were due to treatment-mode stimulation. Among the 6 participants who were also assessed at 1 year, the median within-participant changes from baseline to 1 year were generally consistent with results at 6 months. Implantation caused ipsilateral hearing loss, with the air-conducted pure-tone average detection threshold at 6 months increasing by 3 to 16 dB in 5 participants and by 74 to 104 dB in 3 participants. Changes in participant-reported disability and quality of life paralleled changes in posture and gait.
CONCLUSIONS
Six months and 1 year after unilateral implantation of a vestibular prosthesis for bilateral vestibular hypofunction, measures of posture, gait, and quality of life were generally in the direction of improvement from baseline, but hearing was reduced in the ear with the implant in all but 1 participant. (Funded by the National Institutes of Health and others; ClinicalTrials.gov number, NCT02725463.)
APPROXIMATELY 1.8 MILLION ADULTS worldwide have severe bilateral vestibular hypofunction that results in chronic disequilibrium, oscillopsia, postural instability, and unsteady gait owing to failure of vestibular reflexes that stabilize the eyes, head, and body.1 Because affected persons must devote conscious effort to walking without falling, they have cognitive distraction, a risk of falling that is 31 times greater than that of an unaffected person, and the social stigma of “walking like a drunk.”2 They also have a disease-related economic burden and a reduction in health-related quality of life that are similar to those caused by adult-onset severe bilateral hearing loss or renal insufficiency.3
Current practice involves instructing these patients to perform vestibular rehabilitation exercises, to avoid the use of ototoxic medications such as aminoglycosides and sedating medications such as meclizine and benzodiazepines, and to avoid activities that increase the risk of injury (e.g., swimming, walking in poorly lit areas, and driving). Noninvasive devices that use sound, skin vibration, or galvanic stimulation4–7 can convey enough information regarding body motion and orientation to reduce postural instability; however, they do not facilitate gait.5
A total of 22 patients at three other centers were reported to have undergone implantation of modified cochlear implants that use electrodes to electrically stimulate branches of the vestibular nerve; such devices have been tested exclusively in the laboratory setting.8–12 We conducted a study to measure the clinical effects of a unilateral vestibular implant that provides long-term artificial sensation of head motion 24 hours per day by electrically stimulating vestibular nerve branches that innervate the semicircular canals.13
METHODS
PARTICIPANTS
Persons who had had adult-onset bilateral vestibular hypofunction for at least 1 year and had undergone at least 6 months of vestibular rehabilitation therapy were eligible for enrollment if they met the following criteria: severe bilateral vestibular hypofunction confirmed by clinical examination and objective tests of semicircular canal function; hearing in at least one ear that was adequate to support communication; and normal findings on magnetic resonance imaging and computed tomography of the temporal bones, internal auditory canals, and brain. Exclusion criteria were causes of vestibular reflex dysfunction unrelated to the labyrinth such as acoustic neuroma and cerebellar atrophy, the current use of substances that suppress the vestibular reflexes, and conditions expected to preclude safe participation in the study.14 Eight participants underwent implantation of the device. A ninth participant completed the screening process but did not undergo implantation of the device and was therefore excluded from the analyses. The eight participants were the only persons who received these implants at our institution.
STUDY OVERSIGHT
This single-center study, conducted at Johns Hopkins Hospital, was a prospective, nonrandomized, single-group study in which participants served as their own controls. It was designed by the investigators with input from the sponsors, including Labyrinth Devices, MED-EL (which, with Labyrinth Devices, jointly developed the device evaluated in the study), and the National Institutes of Health (NIH). Reviewers from the NIH, the Food and Drug Administration, the institutional review board at Johns Hopkins School of Medicine, and an independent data and safety monitoring board also provided input on the study design. Labyrinth Devices provided the implant systems, equipment, and funding to cover the participants’ travel expenses. MED-EL manufactured the implanted devices and some external components. The first six authors, the ninth and tenth authors, and the last author collected the data. The first, second, and last authors analyzed the data and wrote an earlier version of the manuscript. All the authors vouch for the accuracy and completeness of the data and analyses and for the fidelity of the study to the protocol, which is available with the full text of this article at NEJM.org. Confidentiality agreements were in place between the sponsor and Johns Hopkins University.
STUDY DESIGN
Testing was performed in an otolaryngology clinic at baseline (<1 week before surgery) and repeated approximately 3 weeks after unilateral implantation of the device. The device was then activated to begin electrical stimulation to each of the three semicircular canal branches 24 hours per day, as described below. Testing was repeated 6 months and 1 year after implantation. Active stimulation occurred continuously between visits. At the post-activation visits, we performed posture and gait tests both with the device set in its usual treatment mode (in which it provided information on the rotational velocity of the head) and during placebo-mode stimulation (when pulse rate and amplitude were kept constant, regardless of head motion). The tests were performed during each of the two stimulation modes on the same day, in random order, with participants and assessors unaware of stimulation mode.
DEVICE AND IMPLANTATION SURGERY
The device is a self-contained system that provides artificial sensation of head rotation by electrically stimulating the three semicircular canal branches of the vestibular nerve (Fig. 1). The design of the device, the surgical technique, and the stimulation protocols and adjustments have been described previously.13 Similar to a cochlear implant system, the device comprises an implanted stimulator, an electrode array, and an external processor. The stimulator is implanted unilaterally behind the ear that has poorer baseline hearing and vestibular function. The procedure is performed in a single operation while the patient is under general anesthesia. Electrical pulses are delivered to the semicircular canal branches of the vestibular nerve through three stimulating electrodes (chosen from a total of nine electrodes implanted in the three canals) and one reference electrode. The rotational velocity of the head is encoded in three dimensions by the modulation of pulse rates and amplitudes of stimulation through the electrodes. At the time of device activation and at subsequent testing sessions, stimulation settings are adjusted as needed to maximize strength and selectivity of vestibular nerve–branch stimulation, as indicated by the speed and direction of the perceived head motion and reflex head and eye movements.
Figure 1. Components and Mechanism of a Vestibular Implant.
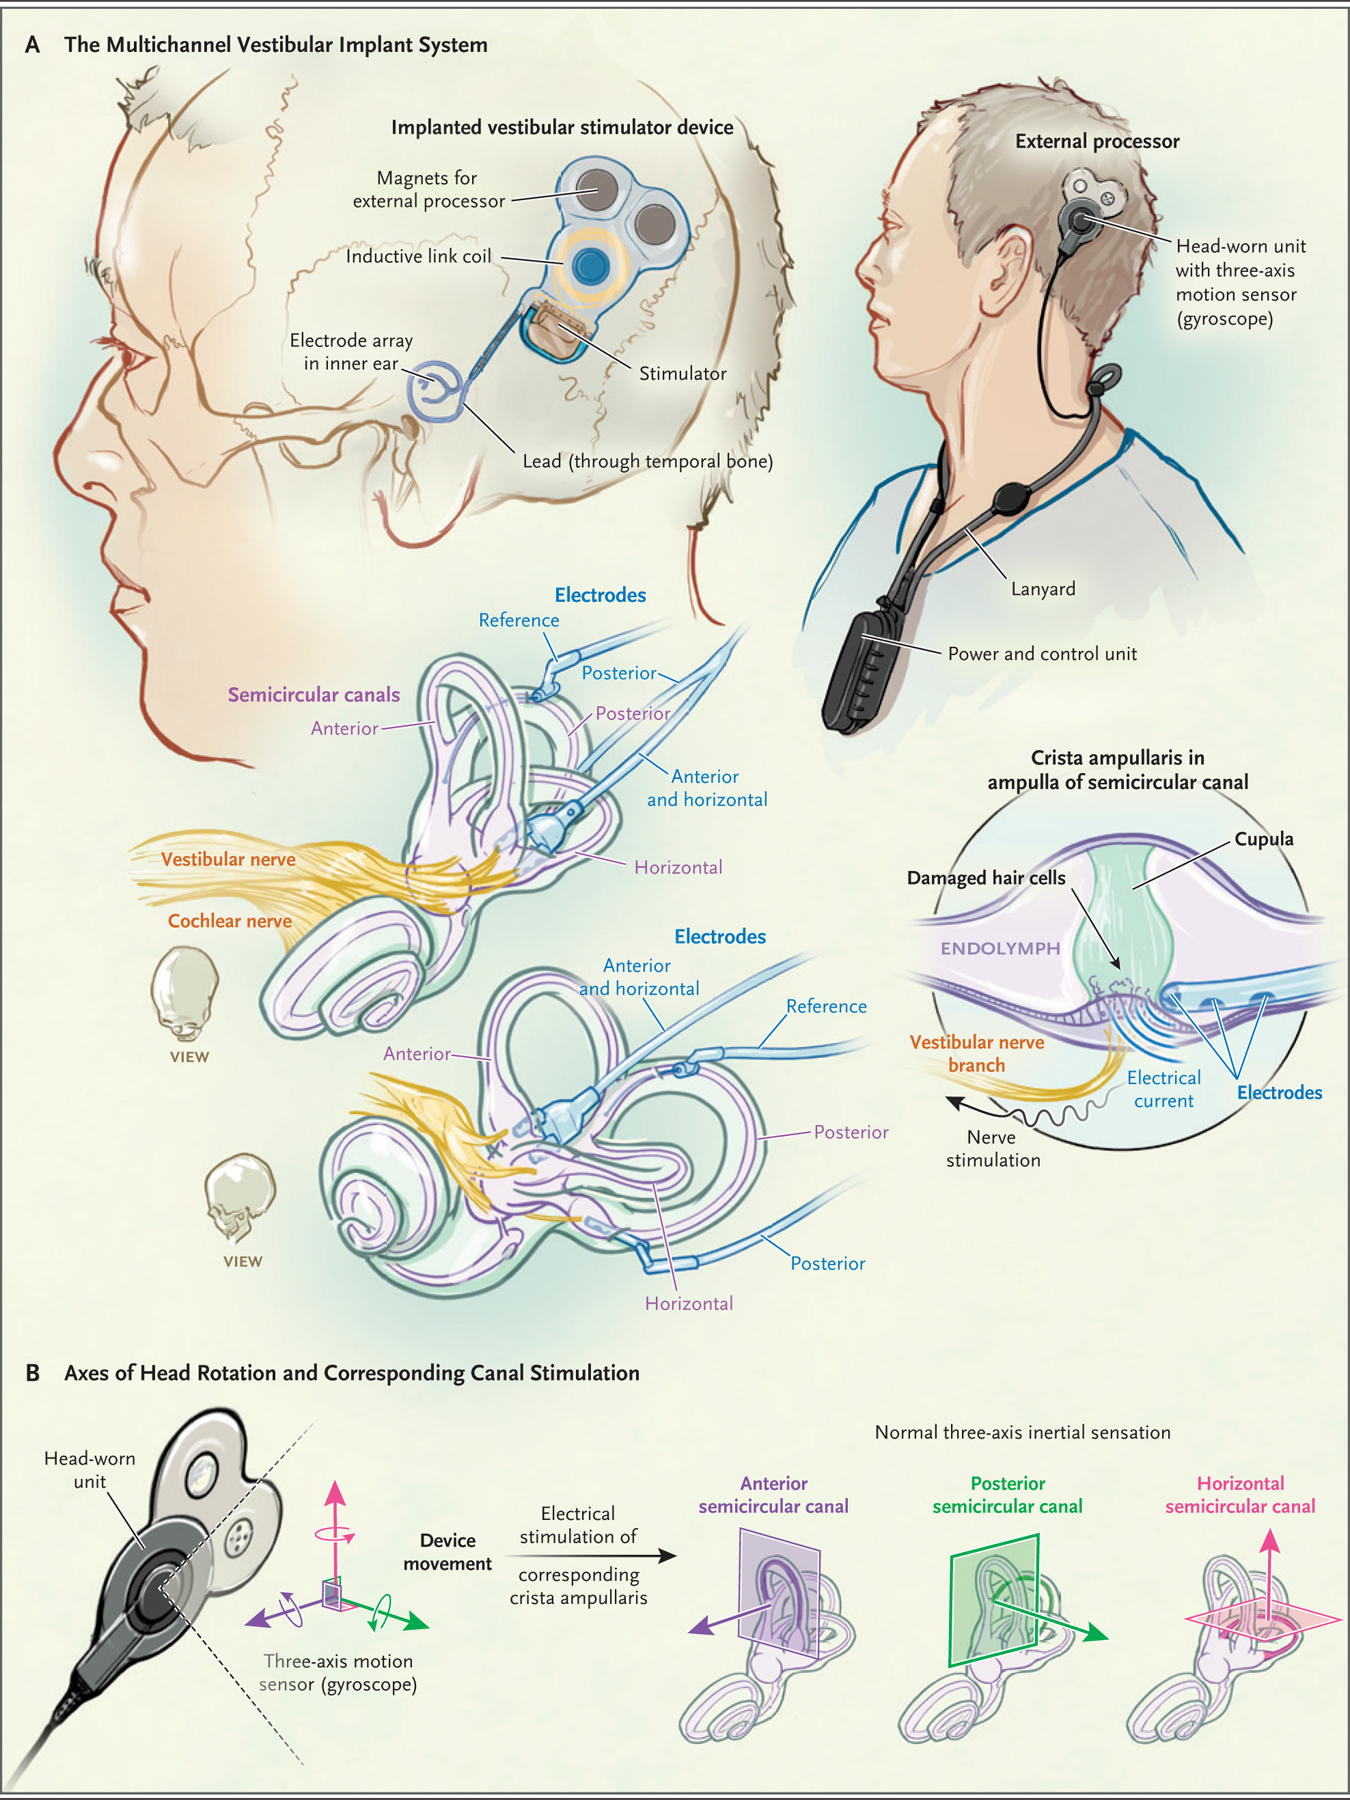
To bypass damaged hair cells in dysfunctional semicircular canals, a vestibular implant electrically stimulates vestibular nerve branches with the use of electrical current pulses that vary in rate and amplitude depending on head rotation speed and axis. The multichannel vestibular implant system (Panel A) comprises an implanted stimulator with electrodes designed for insertion in the semicircular canals; an external head-worn unit, which senses head rotation and transmits power and command signals to the stimulator with the use of a transcutaneous inductive link; and a power and control unit that houses a battery and a microprocessor that stores stimulus settings and controls pulse timing. To mimic nerve activity patterns that normally represent the speed and three-dimensional axis of head rotation, the system separates head rotational velocity into three components, each aligned with the axis of one semicircular canal, and then stimulates each canal separately (Panel B).
The external processor includes two components: a head-worn unit and a power and control unit. The head-worn unit, which is held on the scalp by three magnets, senses angular and linear head motion (only the former is used for the prosthesis) with a three-axis motion sensor and transmits power and commands wirelessly across the scalp to the implanted stimulator. The power and control unit sends data to a computer to allow for adjusting the device settings, controls and provides power to the unit worn on the head, and alerts the user when its battery is low. The power and control unit is typically worn on a lanyard (Fig. 1; and Fig. S1 in the Supplementary Appendix, available at NEJM.org) and uses a rechargeable battery that is exchanged daily.
The surgery involves creating a subperiosteal pocket and bone well to hold the stimulator and its inductive receiver, creating a path for the electrode leads of the stimulator to run through the temporal bone to the labyrinth, inserting the electrode arrays through holes (approximately 0.6 mm in diameter) drilled into each semicircular canal ampulla, and packing fascia and bone chips around the arrays. A reference electrode is placed either in the labyrinth common crus or in a subperiosteal pocket. All the operations were performed by one surgeon (the last author).
OUTCOMES
There were five outcomes related to posture and gait; four participant-reported outcomes related to dizziness, disability, and quality of life; and four outcomes related to hearing. Published minimally important differences between two measurements at different times (defined as half the standard deviation for normative data15) were used to provide context for the interpretation of individual and median within-participant changes.
Posture and Gait
The balance subtest (Balance Subtest 5) of the Bruininks–Oseretsky Test of Motor Proficiency, Second Edition, comprises seven standing tasks (standing on the floor on one foot and on both feet and on a low balance beam on one foot, each with eyes open and with eyes closed; and standing heel to toe on a low balance beam with eyes open) and two walking tasks (walking forward on the floor, with and without touching heel to toe.16 For each task, the better of two attempts is scored on a scale of 0 to 4 on the basis of time (standing tasks) or step count (walking tasks) until failure (i.e., moving from the set position, opening the eyes when they should be closed, or stepping off the line). The sum of the scores across the nine tasks ranges from 0 to 36, with higher scores indicating better performance. The minimally important difference is 1.55 points for young adults.16 We found no published normative data for adults older than 21 years of age.
The modified Romberg test involves having the participant stand for as long as possible on a foam pad with feet together, arms crossed, and eyes closed. The time to failure (i.e., moving out of position or opening the eyes) is measured for a maximum of 30 seconds for each of two attempts, and the longer duration of the two is reported.17 The minimally important difference is 4.21 seconds.18
The Dynamic Gait Index assesses walking on a level surface (with the participant’s usual gait and while changing gait speed, turning the head left and right, moving the head up and down, stepping over obstacles, stepping around obstacles, or making an abrupt 180-degree pivot) and walking up and down stairs.19 Each of the eight conditions is scored with the use of a standardized manual on a scale of 0 to 3; the sum of the scores ranges from 0 to 24, with higher scores indicating better gait performance. The minimally important difference is 0.75 points.20
In the Timed Up and Go test, a seated participant is instructed to rise, walk 3 m, turn around, and return and sit down.21 The mean completion time (in seconds) for three attempts is recorded, with shorter durations indicating better performance. In a study involving 413 women 65 to 85 years of age, the completion time on the Timed Up and Go test was less than 12 seconds for 92% of the women and less than 20 seconds for all the women.22 The minimally important difference is 1.3 seconds.23
Gait speed is measured during four attempts of walking 10 m in a well-lit, straight corridor at a comfortable pace. The time to traverse the middle 4 m is measured and reported as the mean velocity in meters per second; a faster speed indicates better performance. In a study involving 558 older adults, the mean (±SD) gait speed was 1.00±0.23 m per second.24 The minimally important difference is 0.12 m per second.24
Participant-Reported Outcomes
The Dizziness Handicap Inventory determines how often respondents have dizziness-related difficulty or distress in 25 scenarios, each on a scale that ranges from 0 (no distress) to 4.25 The overall score is the sum of all the responses; scores range from 0 (no respondent-perceived dizziness handicap) to 100. On the Vestibular Disorders Activities of Daily Living questionnaire, respondents rate their perceived disability for 28 activities on a scale of 1 (“independent”) to 10 (“too difficult; no longer perform”). The overall score is the median response, which ranges from 1 (least disability) to 10 (most disability).26,27 The minimally important difference for the Dizziness Handicap Inventory is 18 points; a minimally important difference is not specified for the Vestibular Disorders Activities of Daily Living questionnaire.28
The 36-Item Short-Form Health Survey (SF-36) assesses general health-related quality of life on the basis of responses to 36 questions.29 Its scoring protocol does not specify a composite score. However, SF-36 data can be transformed to a health utility index score (SF-36 utility; scores range from 0.3 [worst] to 1.0 [best]).30–32 The Health Utilities Index Mark 3 is a 15-question survey that is intended to measure health utility on a scale of 0 (death) to 1 (perfect health).33 The Health Utilities Index Mark 3 applies greater weight to hearing than does the SF-36 utility, but both yield similar scores for changes in health utility. The minimally important difference for each index is 0.03 points.33,34 To obtain aspects of the participant experience that were insufficiently described by participant-reported outcome questionnaires (none of which are specific to bilateral vestibular hypofunction), we recorded structured interviews.
Audiometry
We measured air- and bone-conducted pure-tone detection thresholds and open-set word discrimination scores (the percentage correct among sets of 50 consonant–nucleus–consonant monosyllabic words35). The words were presented to the participant through earphones while the participant was in a sound-isolation booth. A masking noise was played to the contralateral ear at 40 dB above its bone-conduction threshold if that threshold was at least 10 dB better than that of the testing ear. We computed pure-tone average detection thresholds at 500, 1000, 2000, and 4000 Hz.
To simulate real-world conditions, we measured sentence recognition scores on the AzBio sentences-in-noise test (scores range from 0 to 100%, with higher scores indicating better performance).36 During this speech perception test, a prerecorded list of 20 sentences, chosen at random without replacement from a set of 15 such lists, is presented through a speaker in front of the participant at a moderate volume (a sound pressure level of 60 dB), along with simultaneous noise (comprising the sum of ten other sentences) at a sound pressure level of 55 dB. We performed ocular and cervical vestibular-evoked myogenic potential testing to assess the function of the utricle and saccule, respectively, by delivering air-conducted 500-Hz tone bursts through earphones at a sound pressure level of 125 dB.37 For ocular vestibular-evoked myogenic potential testing, the normal range is 0 to 17 μV peak-to-peak amplitude, with higher values indicating greater utricle sensitivity to sound. For cervical vestibular-evoked myogenic potential testing, the normal range is a score of 1.3 to 3 (a dimensionless ratio of response amplitude to rectified pre-stimulus electromyographic activity), with higher values indicating greater saccule sensitivity to sound.
STATISTICAL ANALYSIS
The main results of each outcome are presented as medians and 95% confidence intervals of the within-participant change from preoperative baseline to 6 months and 1 year after implantation, during treatment-mode stimulation.38 We also used descriptive statistics to summarize the results obtained during placebo-mode stimulation at 6 months and 1 year after implantation. Missing data after implantation were imputed to the median of that participant’s previous postimplantation results; no preimplantation data were missing or imputed. Because there was no prespecified plan to adjust confidence intervals for multiple comparisons, the end points are presented only as point estimates with unadjusted confidence intervals.
RESULTS
PARTICIPANT CHARACTERISTICS AND STIMULATION SETTINGS
Three men and five women were enrolled in the study and underwent unilateral implantation of the device. The median age was 59 years (range, 50 to 66), and all the participants had adult-onset bilateral vestibular hypofunction that had been caused by the use of an aminoglycoside, with one exception: Participant 7 had idiopathic hypofunction (Table 1). Baseline testing occurred at a median of 4 years (range, 2 to 23) after the onset of symptoms. Two participants did not undergo testing at 1 year because of difficulty traveling as a result of the pandemic of coronavirus disease 2019.
Table 1.
Participant Characteristics.
| Participant No. (Sex, Age) | Cause of Bilateral Vestibular Hypofunction (Year of Symptom Onset) | Implant Surgery | Date of Device Activation | Date of Most Recent Test | Days of Use* | |
|---|---|---|---|---|---|---|
| Ear | Date | |||||
| 1 (M, 61 yr) | Gentamicin, intravenous infusion (2012) | Left | Aug. 12, 2016 | Sept. 7, 2016 | Oct. 29, 2018 | 812 |
| 2 (M, 57 yr) | Streptomycin, bilateral intratympanic injection (2007) | Left | Nov. 4, 2016 | Nov. 30, 2016 | Nov. 12, 2018 | 738 |
| 3 (F, 63 yr) | Gentamicin, intravenous infusion (2015) | Left | Feb. 3, 2017 | Feb. 23, 2017 | March 27, 2019 | 782 |
| 4 (F, 62 yr) | Gentamicin, intravenous infusion (2015) | Left | Dec. 15, 2017 | Jan. 4, 2018 | Dec. 3, 2018 | 354 |
| 5 (F, 50 yr) | Gentamicin, bilateral intratympanic injection (2009) | Right | Aug. 24, 2018 | Sept. 12, 2018 | Feb. 26, 2020 | 532 |
| 6 (F, 66 yr) | Gentamicin, intravenous infusion (2016) | Right | Aug. 31, 2018 | Sept. 26, 2018 | March 11, 2020 | 532 |
| 7 (F, 52 yr) | Cause unknown (2015) | Left | Jan. 14, 2019 | Feb. 6, 2019 | July 1, 2019 | 145 |
| 8 (M, 55 yr) | Gentamicin, intravenous infusion (1996) | Right | Sept. 13, 2019 | Oct. 9, 2019 | March 4, 2020 | 147 |
T he days of use were calculated on the basis of the date of the participant’s most recent test.
The median duration of the surgery was 285 minutes (range, 246 to 305). The reference electrode was inserted in the labyrinth common crus in seven participants and in a subperiosteal pocket in Participant 8. Three participants were discharged the same day; the remaining five were discharged the morning after surgery.
Summaries of the electrical stimulation settings that were chosen during the outpatient programming visit 3 weeks after implantation and at 6 months and 1 year after implantation are provided in Tables S1, S2, and S3.13 As of the date of each participant’s most recent test, all the participants had used their devices in treatment mode every day since activation (median duration of use at last assessment, 532 days; range, 145 to 812). All the participants wore the external unit 24 hours per day for at least 6 months. Participant 2 began taking it off at bedtime 2 years after implantation, and Participants 5, 7, and 8 began taking it off at bedtime at 6 months.
OUTCOMES
The following missing data from individual participants were imputed to the median of that participant’s previous postimplantation results: the response on one question each on the 3-week and 6-month postimplantation Dizziness Handicap Inventory for Participant 2; the scores on the AzBio sentences-in-noise test at 6 months for Participants 1 and 2; and the results of audiometric testing at 6 months for Participant 8. The missing 1-year data for the two participants who had been unable to complete testing as a result of the pandemic were not imputed.
Table 2 summarizes outcome results at baseline, at approximately 3 weeks after implantation (but before activation of the device), and during treatment-mode stimulation at 6 months and 1 year after implantation. Figure 2 shows individual and median within-participant changes in posture and gait measurements relative to baseline during both treatment-mode stimulation and placebo-mode simulation. During treatment-mode stimulation, the median within-participant change at 6 months was positive (in the direction of improvement) for all five tests, and confidence intervals included zero for three of the five tests. The median score on the balance subtest of the Bruininks–Oseretsky Test of Motor Proficiency changed from 17.5 at baseline to 21.0 at 6 months after implantation (median within-participant difference, 5.5 points, 95% confidence interval [CI], 0 to 10.0), and the median time on the modified Romberg test changed from 3.6 to 8.3 seconds (difference, 5.1; 95% CI, 1.5 to 27.6). The median score on the Dynamic Gait Index changed from 12.5 to 22.5 (difference, 10.5 points; 95% CI, 1.5 to 12.0), the median time on the Timed Up and Go test from 11.0 to 8.7 seconds (difference, 2.3; 95% CI, −1.7 to 5.0), and the median speed on the gait-speed test from 1.03 to 1.10 m per second (difference, 0.13; 95% CI, −0.25 to 0.30). Among the six participants who were also assessed at 1 year after implantation, the median within-participant changes from baseline to 1 year were generally consistent with results at 6 months. The median within-participant changes from baseline during placebo-mode stimulation were small, with confidence intervals crossing zero (Fig. 2, Tables S7 through S9, and Videos 1 through 8).
Table 2.
Study Outcomes.*
| Outcome | Baseline, 1 Wk before Implantation (N = 8) | Before Activation, Approximately 3 Wk after Implantation (N = 8) | Treatment Mode, 6 Mo after Implantation (N = 8) | Treatment Mode, 1 Yr after Implantation (N = 6) | Within-Participant Change from Baseline in the Direction of Improvement† | |
|---|---|---|---|---|---|---|
| Treatment Mode, 6 Mo after Implantation (N = 8) | Treatment Mode, 1 Yr after Implantation (N = 6) | |||||
| median (95% CI) | ||||||
| Posture‡ | ||||||
| Bruininks–Oseretsky Test of Motor Proficiency balance subtest score | 17.5 (9.0 to 20.0) | 13.5 (7.0 to 21.0) | 21.0 (11.0 to 28.0) | 25.5 (12.0 to 27.0) | 5.5 (0 to 10.0) | 7.0 (3.0 to 13.0) |
| Modified Romberg test — sec | 3.6 (2.0 to 8.9) | 2.5 (0.9 to 8.4) | 8.3 (4.4 to 30.0) | 14.5 (3.5 to 30.0) | 5.1 (1.5 to 27.6) | 11.0 (1.5 to 25.1) |
| Gait§ | ||||||
| Dynamic Gait Index score | 12.5 (9.0 to 22.5) | 13.5 (9.5 to 22.0) | 22.5 (21.0 to 24.0) | 22.0 (21.0 to 24.0) | 10.5 (1.5 to 12.0) | 9.5 (−0.5 to 11.0) |
| Timed Up and Go test — sec | 11.0 (8.2 to 19.5) | 11.4 (7.5 to 19.3) | 8.7 (6.8 to 14.5) | 9.3 (7.3 to 14.0) | 2.3 (−1.7 to 5.0) | 2.1 (0 to 5.5) |
| Gait speed — m/sec | 1.03 (0.55 to 1.27) | 1.08 (0.56 to 1.37) | 1.10 (0.81 to 1.35) | 1.22 (0.85 to 1.27) | 0.13 (−0.25 to 0.30) | 0.13 (−0.08 to 0.30) |
| Dizziness and disability¶ | ||||||
| Dizziness Handicap Inventory score | 79 (32 to 92) | 79 (40 to 94) | 19 (6 to 76) | 26 (0 to 40) | 50 (16 to 66) | 49 (32 to 70) |
| Vestibular Disorders Activities of Daily Living assessment score | 4 (1 to 6) | 4 (1 to 6) | 1 (1 to 6) | 1 (1 to 6) | 2 (0 to 4) | 2 (0 to 4) |
| Quality of life‖ | ||||||
| SF-36 utility score | 0.70 (0.56 to 0.83) | 0.71 (0.53 to 0.85) | 0.82 (0.68 to 0.90) | 0.84 (0.72 to 0.90) | 0.10 (0.06 to 0.24) | 0.11 (0.05 to 0.28) |
| Health Utilities Index Mark 3 score | 0.74 (0.42 to 0.85) | 0.47 (−0.04 to 0.83) | 0.72 (0.26 to 0.97) | 0.74 (0.35 to 0.97) | 0.07 (−0.22 to 0.18) | 0.11 (−0.45 to 0.18) |
| Hearing** | ||||||
| Pure-tone average, air-conducted — dB | 13.1 (9.0 to 47.5) | 53.8 (22.5 to 114.0) | 46.9 (17.5 to 112.5) | 35.0 (14.0 to 85.0) | −14.4 (−100.0 to −2.5) | −8.1 (−72.5 to −1.3) |
| Pure-tone average, bone-conducted — dB | 11.3 (7.5 to 35.0) | 38.1 (16.0 to 67.5) | 36.9 (10.0 to 66.3) | 47.5 (5.0 to 69.0) | −15.0 (−57.5 to 1.3) | −11.9 (−56.3 to 2.5) |
| CNC word discrimination test — % | 96 (78 to 100) | 80 (0 to 100) | 81 (0 to 96) | 84 (0 to 100) | −9 (−100 to −8) | −5 (−96 to 12) |
| AzBio sentences-in-noise test — % | 92 (90 to 99) | 94 (68 to 100) | 88 (80 to 100) | 96 (82 to 100) | −3 (−18 to 6) | 2 (−16 to 10) |
The widths of the confidence intervals (CI) have not been adjusted for multiple comparisons and cannot be used to infer a treatment effect.
Median within-participant changes in the direction of improvement relative to baseline (before implantation) are shown. The sign of within-participant change relative to baseline was inverted for the following outcomes, for which lower values indicate better performance: the Timed Up and Go test, the Dizziness Handicap Inventory, the Vestibular Disorders Activities of Daily Living assessment, the pure-tone average conducted through air, and the pure-tone average conducted through bone. The median within-participant difference is not necessarily equal to the difference between the baseline and postimplantation median scores.
Total scores on the balance subtest of the Bruininks–Oseretsky Test of Motor Proficiency range from 0 to 36, with higher scores indicating better performance.16 Time to failure on the modified Romberg test ranges from 0 to 30 seconds, with longer durations indicating better performance.17
Scores on the Dynamic Gait Index range from 0 to 24, with higher scores indicating better gait performance.19 For the Timed Up and Go test, shorter durations indicate better performance.21 For gait speed, a faster speed indicates better performance.
Scores on the Dizziness Handicap Inventory range from 0 to 100, with lower scores indicating a lower respondent-perceived dizziness handicap.25 Scores on the Vestibular Disorders Activities of Daily Living assessment range from 1 to 10, with lower scores indicating lower respondent-perceived disability.27
Scores on the health utility index derived from data from the 36-Item Short-Form Health Survey (SF-36 utility) range from 0.3 (worst) to 1 (best).29 Scores on the Health Utilities Index Mark 3 range from 0 (death) to 1 (perfect health).33
Air- and bone-conducted pure-tone detection thresholds were measured in the ear containing the implant; lower threshold levels indicate better hearing. Scores on the consonant–nucleus–consonant (CNC) word discrimination test range from 0 to 100%, with higher scores indicating better performance.35 Sentence recognition scores for sound field presentation to both ears with added noise on the AzBio sentences-in-noise test range from 0 to 100%, with higher scores indicating better performance.36
Figure 2. Changes in Posture and Gait.
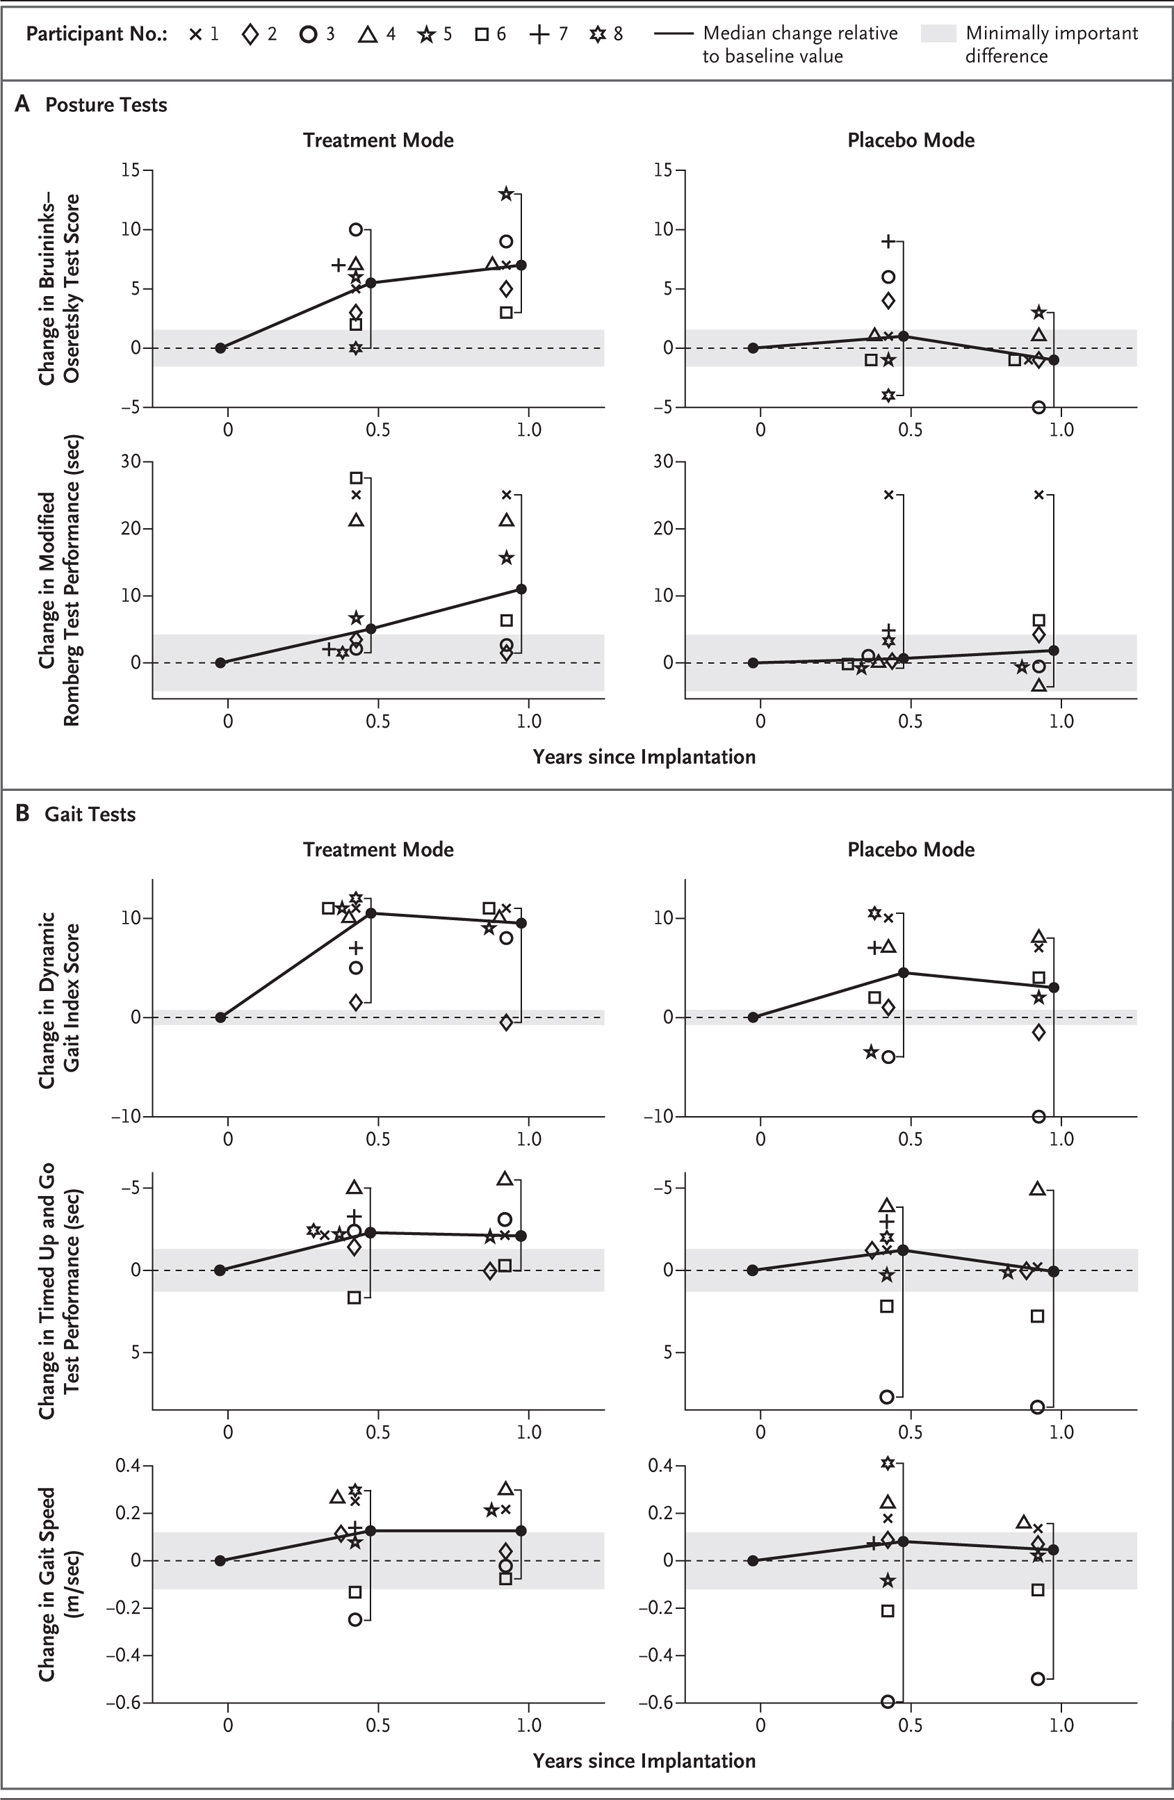
Panel A shows within-participant changes in posture tests during both treatment-mode stimulation and placebo-mode stimulation relative to baseline values measured before implantation. Total scores on the balance subtest of the Bruininks–Oseretsky Test of Motor Proficiency range from 0 to 36, with higher scores indicating better performance.16 Time to failure on the modified Romberg test ranges from 0 to 30 seconds, with longer durations indicating better performance.17 Panel B shows within-participant changes in gait tests during both treatment-mode stimulation and placebo-mode stimulation relative to baseline values measured before implantation. Scores on the Dynamic Gait Index range from 0 to 24, with higher scores indicating better gait performance.19 For the Timed Up and Go test, shorter durations indicate better performance.21 For gait speed, a higher speed indicates better performance. In both panels, data are shown for all eight participants at 6 months after implantation and for six participants (all except Participants 7 and 8) at 1 year after implantation. Gray shading denotes ±1 minimally important difference. Brackets depict the 95% confidence intervals of the medians, which are equivalent to the ranges. The widths of the confidence intervals have not been adjusted for multiple comparisons and cannot be used to infer a treatment effect. The y axis for the Timed Up and Go test is inverted so that a relative increase in performance is upward for all the outcomes.
The results of the assessments of participant-reported dizziness, disability, and quality-of-life measures are shown in Table 2 and Figure 3. The median within-participant change at 6 months was in the direction of improvement for all four measures related to these outcomes, and confidence intervals included zero for two of the four measures. The median score on the Dizziness Handicap Inventory changed from 79 at baseline to 19 at 6 months after implantation (median within-participant difference, 50 points; 95% CI, 16 to 66), and the median score on the Vestibular Disorders Activities of Daily Living assessment changed from 4 to 1 (difference, 2 points; 95% CI, 0 to 4). The median score on the SF-36 utility changed from 0.70 to 0.82 (difference, 0.10 points; 95% CI, 0.06 to 0.24), and the median score on the Health Utilities Index Mark 3 changed from 0.74 to 0.72 (difference, 0.07 points; 95% CI, −0.22 to 0.18). Among the six participants who were also tested at 1 year after implantation, the median within-participant changes from baseline were similar to those observed at 6 months. Figure S1 shows participants using their devices in daily life, and Videos 1 through 8 show structured interviews of all eight participants.
Figure 3. Changes in Dizziness, Disability, and Quality of Life.
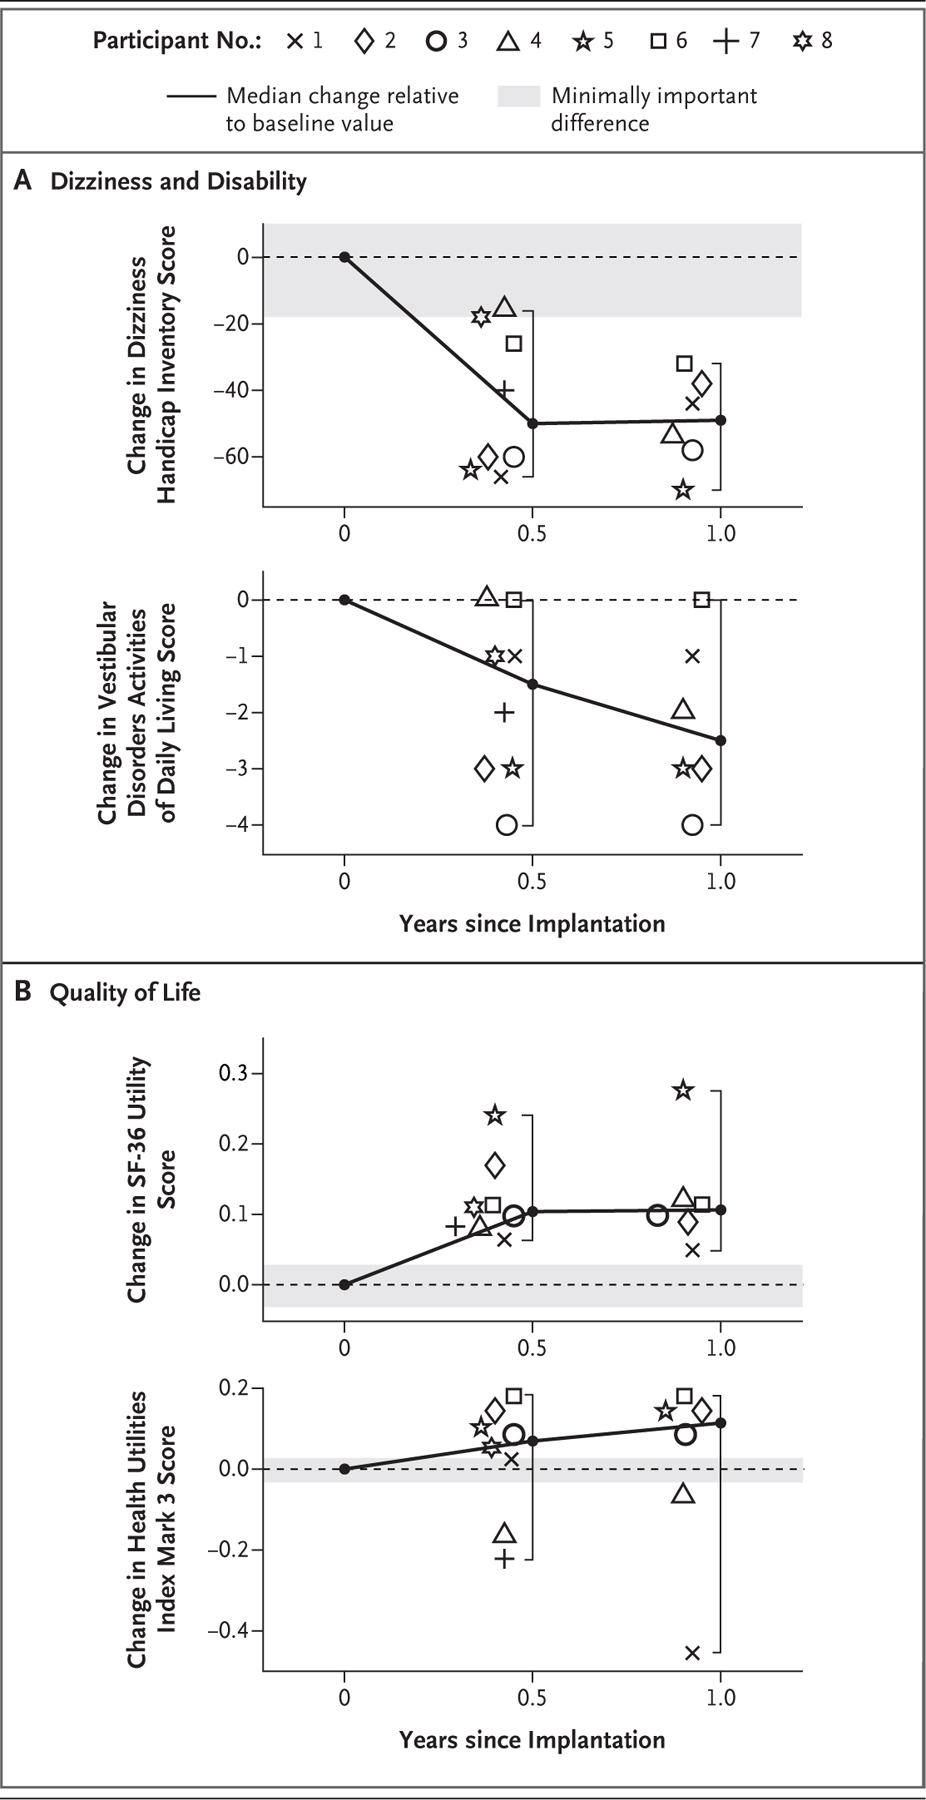
Panel A shows within-participant changes in assessments of dizziness and disability relative to preimplantation scores. Scores on the Dizziness Handicap Inventory range from 0 to 100, with lower scores indicating a lower respondent-perceived dizziness handicap.25 Scores on the Vestibular Disorders Activities of Daily Living assessment range from 1 to 10, with lower scores indicating lower respondent-perceived disability.27 Panel B shows within-participant changes in quality-of-life assessments relative to preimplantation scores. Scores on the health utility index derived from data from the 36-Item Short-Form Health Survey (SF-36 utility) range from 0.3 (worst) to 1 (best).29 Scores on the Health Utilities Index Mark 3 range from 0 (death) to 1 (perfect health).33 Data are shown individually for each of the eight participants at 6 months after implantation and for all but two participants (those who most recently underwent implantation) at 1 year. Gray shading denotes changes within ±1 minimally important difference as defined by published standards for each test. Brackets depict the 95% confidence intervals of the medians, which are equivalent to the ranges. The widths of the confidence intervals have not been adjusted for multiple comparisons and cannot be used to infer a treatment effect.
The results of the audiometric outcomes are presented in Table 2 and Figures S2 and S3. Implantation caused a bimodal distribution of hearing loss relative to baseline in the ear containing the implant; the air-conducted pure-tone average detection threshold 6 months after implantation increased (worsened) by 74 to 104 dB in three participants and by 3 to 16 dB in five participants. Word discrimination scores 6 months after implantation, assessed in the ear containing the implant, were 0% in the three participants with greater hearing loss and within 10% of the baseline scores for the other five participants. Sound-field AzBio sentences-in-noise recognition scores, which were based on the presentation of sentences to both ears, remained within 18% of the baseline score for all the participants, a finding that reflects intact contralateral hearing. No participant had detectable responses on vestibular-evoked myogenic potential testing of the ear containing the implant before or after surgery, with the exception of Participant 4, who had a cervical vestibular-evoked myogenic potential score of 1.02 at baseline and 1.00 after implantation.
ADVERSE EVENTS
Adverse events other than hearing loss included tinnitus, transient imbalance, dysgeusia, facial twitch, and tingling that stopped when the stimulus current was reduced (Table S10). One participant reported two falls after sudden discontinuations of stimulation related to a software error that was subsequently corrected. One participant reported a fall while walking with her device unpowered. One participant fractured his clavicle after falling while riding a bicycle with the device in treatment mode.
DISCUSSION
In eight participants with adult-onset bilateral vestibular hypofunction, prosthetic electrical stimulation of the semicircular canal branches of the vestibular nerve to convey an artificial sensation of rotational head movement resulted in changes in the direction of improvement from baseline in two of the five measures of posture and gait and in two of the four participant-reported outcomes related to dizziness, disability, and quality of life at 6 months. The results at 1 year after implantation were similar. Changes in the other three posture and gait measures and the other two participant-reported outcomes were generally in the direction of improvement, but the confidence intervals for the differences from baseline included zero at 6 months. Participants reported improvements in outcomes while using the devices continuously, since the time of device activation, at home during activities of daily living; thus, such findings are not limited to laboratory testing. The direction of improvement on these tests was corroborated by participant reports of subjective improvement in the ability to perform activities of daily life that require stable posture or walking without exerting conscious effort to avoid falling.
Posture and gait tests performed during placebo-mode stimulation showed changes at 6 months and at 1 year that were not significantly different from baseline measurements. Although this study was not powered to support statistical inference regarding the absence of placebo-mode stimulation effects, these data are consistent with an interpretation that changes in posture and gait performance observed during treatment-mode stimulation are not a result of placebo effects or spontaneous recovery.
Hearing loss in the ear containing the implant occurred in seven participants, with three having severe hearing loss and four having diminished hearing but retaining useful hearing in the ear with the implant. One factor that may have contributed to the hearing loss is hypersensitivity to bone-conducted sound, which can result from the presence of superior canal dehiscence or other conditions in which holes in the bone walls of the labyrinth alter the fluid dynamics of the inner ear.39,40 Surgically opening the ampullae to insert vestibular-implant electrodes may increase cochlear sensitivity to intraoperative drilling noise. Preserving a thin bone layer over each ampulla until all drilling is done and then opening each without a drill may reduce the risk of intraoperative noise-induced hearing loss.
In eight participants with severe bilateral vestibular hypofunction who received artificial sensation of head movement through prosthetic vestibular stimulation for more than 6 months, some measures of posture, gait, and participant-reported quality-of-life outcomes improved from baseline and others were generally in the direction of improvement. Surgery for the implantation resulted in reduced hearing in the ear with the implant in seven participants.
Supplementary Material
Acknowledgments
Supported by the National Institute on Deafness and Other Communication Disorders of the National Institutes of Health (grants R01DC013536 and 2T32DC000023), Labyrinth Devices, and MED-EL.
We thank the eight courageous study participants for their time, patience, and pioneering spirit; the engineers involved in the development of vestibular implant systems at MED-EL; Natan S. Davidovics, Ph.D., Gene Y. Fridman, Ph.D., Dale Roberts, M.S., and the other trainees, faculty, and staff at Johns Hopkins School of Medicine who facilitated this study; and the members of the data and safety monitoring board (David J. Eisenman, M.D., Frank R. Lin, M.D., Ph.D., and C. Matthew Stewart, M.D., Ph.D.).
Footnotes
Dr. Della Santina and Johns Hopkins University report holding royalty interests in pending and awarded patents related to forms of technology discussed in this article, as well as equity interest in Labyrinth Devices, of which Dr. Della Santina is the founder and chief executive officer. Terms of this arrangement are managed in accordance with Johns Hopkins University policies on conflicts of interest.
Disclosure forms provided by the authors are available with the full text of this article at NEJM.org.
A data sharing statement provided by the authors is available with the full text of this article at NEJM.org.
REFERENCES
- 1.Living without a balancing mechanism. N Engl J Med 1952;246:458–60. [DOI] [PubMed] [Google Scholar]
- 2.Ward BK, Agrawal Y, Hoffman HJ, Carey JP, Della Santina CC. Prevalence and impact of bilateral vestibular hypofunction: results from the 2008 US National Health Interview Survey. JAMA Otolaryngol Head Neck Surg 2013;139:803–10. [DOI] [PMC free article] [PubMed] [Google Scholar]
- 3.Sun DQ, Ward BK, Semenov YR, Carey JP, Della Santina CC. Bilateral vestibular deficiency: quality of life and economic implications. JAMA Otolaryngol Head Neck Surg 2014;140:527–34. [DOI] [PMC free article] [PubMed] [Google Scholar]
- 4.Honegger F, Hillebrandt IM, van den Elzen NGA, Tang K-S, Allum JH. The effect of prosthetic feedback on the strategies and synergies used by vestibular loss subjects to control stance. J Neuroeng Rehabil 2013;10:115. [DOI] [PMC free article] [PubMed] [Google Scholar]
- 5.Sienko KH, Whitney SL, Carender WJ, Wall C. The role of sensory augmentation for people with vestibular deficits: real-time balance aid and/or rehabilitation device? J Vestib Res 2017;27:63–76. [DOI] [PubMed] [Google Scholar]
- 6.Fitzpatrick RC, Day BL. Probing the human vestibular system with galvanic stimulation. J Appl Physiol (1985) 2004;96:2301–16. [DOI] [PubMed] [Google Scholar]
- 7.Barros CGC, Bittar RSM, Danilov Y. Effects of electrotactile vestibular substitution on rehabilitation of patients with bilateral vestibular loss. Neurosci Lett 2010;476:123–6. [DOI] [PubMed] [Google Scholar]
- 8.Sluydts M, Curthoys I, Vanspauwen R, et al. Electrical vestibular stimulation in humans: a narrative review. Audiol Neurootol 2020;25:6–24. [DOI] [PMC free article] [PubMed] [Google Scholar]
- 9.Merfeld DM, Lewis RF. Replacing semicircular canal function with a vestibular implant. Curr Opin Otolaryngol Head Neck Surg 2012;20:386–92. [DOI] [PubMed] [Google Scholar]
- 10.Rubinstein JT, Ling L, Nowack A, Nie K, Phillips JO. Results from a second-generation vestibular implant in human subjects: diagnosis may impact electrical sensitivity of vestibular afferents. Otol Neurotol 2020;41:68–77. [DOI] [PubMed] [Google Scholar]
- 11.Guyot J-P, Perez Fornos A. Milestones in the development of a vestibular implant. Curr Opin Neurol 2019;32:145–53. [DOI] [PMC free article] [PubMed] [Google Scholar]
- 12.Guinand N, van de Berg R, Cavuscens S, et al. Vestibular implants: 8 years of experience with electrical stimulation of the vestibular nerve in 11 patients with bilateral vestibular loss. ORL J Otorhino-laryngol Relat Spec 2015;77:227–40. [DOI] [PubMed] [Google Scholar]
- 13.Boutros PJ, Schoo DP, Rahman M, et al. Continuous vestibular implant stimulation partially restores eye-stabilizing reflexes. JCI Insight 2019;4(22):e128397. [DOI] [PMC free article] [PubMed] [Google Scholar]
- 14.Strupp M, Kim J-S, Murofushi T, et al. Bilateral vestibulopathy: diagnostic criteria consensus document of the classification committee of the Bárány Society. J Vestib Res 2017;27:177–89. [DOI] [PMC free article] [PubMed] [Google Scholar]
- 15.Wright A, Hannon J, Hegedus EJ, Ka-vchak AE. Clinimetrics corner: a closer look at the minimal clinically important difference (MCID). J Man Manip Ther 2012;20:160–6. [DOI] [PMC free article] [PubMed] [Google Scholar]
- 16.Bruininks RH, Bruininks BD. Bruininks-Oseretsky test of motor proficiency, second edition. London: Pearson, 2005. [Google Scholar]
- 17.Agrawal Y, Carey JP, Hoffman HJ, Sklare DA, Schubert MC. The modified Romberg Balance Test: normative data in U.S. adults. Otol Neurotol 2011;32:1309–11. [DOI] [PMC free article] [PubMed] [Google Scholar]
- 18.Vereeck L, Wuyts F, Truijen S, Van de Heyning P. Clinical assessment of balance: normative data, and gender and age effects. Int J Audiol 2008;47:67–75. [DOI] [PubMed] [Google Scholar]
- 19.Shumaway-Cook A, Woollacott M. Motor control: theory and practical applications. Baltimore: Williams & Wilkins, 1995. [Google Scholar]
- 20.Herman T, Inbar-Borovsky N, Brozgol M, Giladi N, Hausdorff JM. The Dynamic Gait Index in healthy older adults: the role of stair climbing, fear of falling and gender. Gait Posture 2009;29:237–41. [DOI] [PMC free article] [PubMed] [Google Scholar]
- 21.Centers for Disease Control and Prevention. Timed Up & Go (TUG). 2017. (https://www.cdc.gov/steadi/pdf/TUG_Test-print.pdf).
- 22.Bischoff HA, Stähelin HB, Monsch AU, et al. Identifying a cut-off point for normal mobility: a comparison of the timed ‘up and go’ test in community-dwelling and institutionalised elderly women. Age Ageing 2003;32:315–20. [DOI] [PubMed] [Google Scholar]
- 23.Ibrahim A, Singh DKA, Shahar S. ‘Timed Up and Go’ test: age, gender and cognitive impairment stratified normative values of older adults. PLoS One 2017;12(10):e0185641. [DOI] [PMC free article] [PubMed] [Google Scholar]
- 24.Brach JS, Perera S, Studenski S, Newman AB. The reliability and validity of measures of gait variability in community-dwelling older adults. Arch Phys Med Rehabil 2008;89:2293–6. [DOI] [PMC free article] [PubMed] [Google Scholar]
- 25.Jacobson GP, Newman CW. The development of the Dizziness Handicap Inventory. Arch Otolaryngol Head Neck Surg 1990;116:424–7. [DOI] [PubMed] [Google Scholar]
- 26.Cohen HS. Use of the Vestibular Disorders Activities of Daily Living Scale to describe functional limitations in patients with vestibular disorders. J Vestib Res 2014;24:33–8. [DOI] [PubMed] [Google Scholar]
- 27.Cohen HS, Kimball KT. Development of the Vestibular Disorders Activities of Daily Living Scale. Arch Otolaryngol Head Neck Surg 2000;126:881–7. [DOI] [PubMed] [Google Scholar]
- 28.Cohen HS, Kimball KT, Adams AS. Application of the Vestibular Disorders Activities of Daily Living Scale. Laryngoscope 2000;110:1204–9. [DOI] [PubMed] [Google Scholar]
- 29.Jenkinson C, Coulter A, Wright L. Short form 36 (SF36) health survey questionnaire: normative data for adults of working age. BMJ 1993;306:1437–40. [DOI] [PMC free article] [PubMed] [Google Scholar]
- 30.Lins L, Carvalho FM. SF-36 total score as a single measure of health-related quality of life: scoping review. SAGE Open Med 2016;4:2050312116671725. [DOI] [PMC free article] [PubMed] [Google Scholar]
- 31.Brazier J, Roberts J, Deverill M. The estimation of a preference-based measure of health from the SF-36. J Health Econ 2002;21:271–92. [DOI] [PubMed] [Google Scholar]
- 32.Ara R, Brazier J. Predicting the short form-6D preference-based index using the eight mean short form-36 health dimension scores: estimating preference-based health-related utilities when patient level data are not available. Value Health 2009;12:346–53. [DOI] [PubMed] [Google Scholar]
- 33.Horsman J, Furlong W, Feeny D, Torrance G. The Health Utilities Index (HUI): concepts, measurement properties and applications. Health Qual Life Outcomes 2003;1:54. [DOI] [PMC free article] [PubMed] [Google Scholar]
- 34.Fryback DG, Dunham NC, Palta M, et al. US norms for six generic health-related quality-of-life indexes from the National Health Measurement study. Med Care 2007;45:1162–70. [DOI] [PMC free article] [PubMed] [Google Scholar]
- 35.Peterson GE, Lehiste I. Revised CNC lists for auditory tests. J Speech Hear Disord 1962;27:62–70. [DOI] [PubMed] [Google Scholar]
- 36.Spahr AJ, Dorman MF, Litvak LM, et al. Development and validation of the AzBio sentence lists. Ear Hear 2012;33:112–7. [DOI] [PMC free article] [PubMed] [Google Scholar]
- 37.Nguyen KD, Welgampola MS, Carey JP. Test-retest reliability and age-related characteristics of the ocular and cervical vestibular evoked myogenic potential tests. Otol Neurotol 2010;31:793–802. [DOI] [PMC free article] [PubMed] [Google Scholar]
- 38.Campbell MJ, Gardner MJ. Calculating confidence intervals for some non-parametric analyses. Br Med J (Clin Res Ed) 1988;296:1454–6. [DOI] [PMC free article] [PubMed] [Google Scholar]
- 39.Iversen MM, Zhu H, Zhou W, Della Santina CC, Carey JP, Rabbitt RD. Sound abnormally stimulates the vestibular system in canal dehiscence syndrome by generating pathological fluid-mechanical waves. Sci Rep 2018;8:10257. [DOI] [PMC free article] [PubMed] [Google Scholar]
- 40.Ward BK, Carey JP, Minor LB. Superior canal dehiscence syndrome: lessons from the first 20 years. Front Neurol 2017;8:177. [DOI] [PMC free article] [PubMed] [Google Scholar]
Associated Data
This section collects any data citations, data availability statements, or supplementary materials included in this article.