

Abstract
Objective
Growing interest in measuring the cochlear duct length (CDL) has emerged, since it can influence the selection of cochlear implant electrodes. Currently the measurements are performed with ionized radiation imaging. Only a few studies have explored CDL measurements in magnetic resonance imaging (MRI). Therefore, the presented study aims to fill this gap by estimating CDL in MRI and comparing it with multislice computed tomography (CT).
Study Design
Retrospective data analyses of 42 cochleae.
Setting
Tertiary care medical center.
Methods
Diameter (A value) and width (B value) of the cochlea were measured in HOROS software. The CDL and the 2-turn length were determined by the elliptic circular approximation (ECA). In addition, the CDL, the 2-turn length, and the angular length were determined via HOROS software by the multiplanar reconstruction (MPR) method.
Results
CDL values were significantly shorter in MRI by MPR (d = 1.38 mm, P < .001) but not by ECA. Similar 2-turn length measurements were significantly lower in MRI by MPR (d = 1.67 mm) and ECA (d = 1.19 mm, both P < .001). In contrast, angular length was significantly higher in MRI (d = 26.79°, P < .001). When the values were set in relation to the frequencies of the cochlea, no clinically relevant differences were estimated (58 Hz at 28-mm CDL).
Conclusion
In the presented study, CDL was investigated in CT and MRI by using different approaches. Since no clinically relevant differences were found, diagnostics with radiation may be omitted prior to cochlear implantation; thus, a concept of radiation-free cochlear implantation could be established.
Keywords: CDL, cochlear implantation, temporal bone, CT, MRI
In cochlear implantation, optimal hearing perception can be achieved by correct electrode selection and appropriate cochlear coverage.1,2 Therefore, it is necessary to have a precise understanding of the cochlear duct length (CDL). In clinical practice, multislice computed tomography (CT)3,4 and cone beam CT5,6 are most commonly used. Experimental imaging systems such as micro-CT5,7 and synchrotron imaging8 have been shown to be more precise, but they are not applicable for use in humans due to their higher radiation exposure and the need for small imaging volumes.
Prior to cochlear implantation, magnetic resonance imaging (MRI) is normally performed for the assessment of the cochlear fluid signal and to exclude retrocochlear lesions and brain pathologies.9 The aim of the presented study was to investigate whether CDL measurements can be performed in MRI with similar accuracy to CT. For the measurement of CDL, 2 approaches were used. First, the elliptic circular approximation (ECA) formula was applied,5 which is the latest advanced formula with spiral functions.10 The second approach is multiplanar reconstruction (MPR), which is a new development in the field of 3-dimensional reconstructions of the cochlea.11
Methods
Patient Selection
Radiologic data sets were examined from 42 patients (21 women, 21 men) with an average age of 52.9 years (range, 28-73 years). In these sequential cases, acoustic neuromas were removed from August 2016 to June 2020, and CT and MRI data sets were available. In each case, the contralateral cochlea was examined in relation to the acoustic neuroma. The data sets were exported anonymously. The retrospective data analysis was performed in concordance with the Declaration of Helsinki and approved by the local ethic committee of the University of Würzburg (2020051202).
Radiologic Measurements
The CT data sets were acquired with a SOMATOM Definition AS+ scanner (Siemens) and commercially available software (Syngo CT; Siemens) with the following parameters: tube current, 38 mA; tube voltage, 120 kV; collimation, 0.6 mm; pitch, 0.55; slice thickness, 600 µm.
The MRI data sets (T2 constructive interference in steady states) were acquired with a Skrya 3-T or Prisma 3-T magnetic resonance scanner (Siemens) and commercially available software (Syngo MR; Siemens) with the following parameters: repetition time, 7.35 ms; echo time, 3.17 ms; matrix, 384 × 384; field of view, 180 × 180; slice thickness, 600 µm.
Measurements of CDL, 2-Turn Length, and Angular Length
The data sets were converted to the DICOM standard and transferred to a medical image viewer (version 3.3.6; Horos Project). Measurements were performed with a certified radiologic screen (MultiSync Pa 322UHD; NEC) by an otologist with extensive experience in cochlear analysis (J.T.).
Multiplanar Reconstruction
First the cochlear view was generated by rotating 3-dimensionally around the axial, sagittal, and coronal axes.12,13 Then marker points were manually defined along the bony lateral wall in the cochlear base starting at the center of the round window (Figure 1, A and A′). Later, the reconstruction of the cochlear spiral shape was slowly scrolled toward upper turns, and more markers were set (Figure 1, B and B′) until the helicotrema was reached. In addition, different points of the path were marked: A, round window; B, point at 720° = 2-turn length (2TL); C, highest point at the helicotrema = CDL (Figure 1, C and C′). All landmarks were automatically connected by the software via a Bézier path. Then the anatomically correct course of the reconstructed spiral was guaranteed by (1) complementing more marker points to reach closer alignment of the reconstruction curve and lateral wall, (2) repositioning existing landmarks to smoothen the creation path, and (3) ensuring the anatomically correct path every time that an alternation was made. A landmark was finally set every 30° to 60°.14,15 The whole enrolled cochlea is presented by the software in an additional window. Herein, the CDL (A to C) and the 2TL (A to B; Figure 1, D and D′) were measured in millimeters. Furthermore, the angular length (AL) was determined by measuring the angle in degrees between a line from the center of the cochlea through point A and B and a line from the center of the cochlea through point C. This value was added to the angle of 720° and thus the AL was calculated (Figure 1, E and E′).8,16,17 An exemplary application of the process of the MPR measurement method is shown in Supplementary Video S1.
Figure 1.

Measuring methods. (A, A′; C, C′) Bézier curve along the lateral cochlear wall. (D, D′) Cochlea as longitudinal tube in 2 dimensions. (E, E′) Angular length. (F, F′) Diameter A and width B.
Elliptic Circular Approximation
In the cochlear view, the cochlear parameters diameter (A) and width (B) were measured (Figure 1, F and F′). The cochlea diameter (A) is defined as a straight line from the round window (Figure 2, A and B), passing the modiolus, to the farthest point on the opposite wall of the cochlea. The cochlear width (B) is the straight line connecting the 2 opposite lateral walls of the cochlea, perpendicular to the cochlear diameter passing through the modiolus. First the basal turn length (BTL) was calculated: BTL = 1.18 A + 2.69 B –\sqrt{0.72AB}. In the second step, the length at the desired cochlear angle (θ; CDL = maximum measured angle; 2TL = 720°) of the cochlea was calculated with the equation for the percentage BTL (pBTL), pBTL(θ) = 8.3 × 10⁻⁸×θ3− 2.4 × 10⁻⁴×θ2+ 3.4 × 10⁻¹×θ+ 3.7, and the final equation: CDL(θ) = pBTL(θ) × BTL.5
Figure 2.

Visualization of the round window (dotted circles): (A) computed tomography and (B) magnetic resonance imaging. Presentation of the apical part of the cochlea including the helicotrema: (C) computed tomography and (D) magnetic resonance imaging.
Statistics
After confirmation of the normality of all measured data through Shapiro-Wilk and Kolmogorov-Smirnov tests, 1-way repeated measures of analysis of variance and intraclass correlation (ICC) were used to quantify the reliability between the measurement methods. For reference comparison, the paired t test was used. Differences with a P value <.05 were considered statistically significant.
A 2-way mixed model was performed, and single-measure values of ICC were used.18 ICC was tested for absolute agreement. ICC values were interpreted by applying the following scale: inacceptable (<0.400), fair (0.400 ≤ ICC < 0.600), good (0.600 ≤ ICC < 0.750), and excellent (≥0.750). The associated Cronbach’s alpha was calculated according to the following scale: inacceptable (<0.700), fair (0.700 ≤α < 0.800), good (0.800 ≤α < 0.900), and excellent (≥0.900).19 Clinically acceptable margins of error were assumed: ±1.5 mm for CDL, ±1.31 mm for 2TL, and ±50° for AL.20
Statistical analyses and the creation of diagrams were performed with Prism software (version 8.4.0; GraphPad) as well as SPSS Statistics (version 26.0.0.0; IBM). Data are presented as Bland-Altman plots and box charts.
Results
For all parameters measured (CDL, 2TL, and AL), the mean, SD, range, and 95% CI were determined and are presented in Table 1. The ICC and Cronbach’s alpha values of the individual statistical tests are shown in Table 2.
Table 1.
Cochlear Duct Length, 2-Turn Length, and Angular Length in MRI and CT Scans With Different Calculation Methods (n = 42)
| MRI | CT | |||
|---|---|---|---|---|
| MPR | ECA | MPR | ECA | |
| Cochlear duct length, mm | ||||
| Mean | 35.50 | 36.59 | 36.88 | 37.24 |
| Range | 31.00-40.60 | 31.30-32.50 | 30.50-43.00 | 32.50-43.10 |
| SD | 2.41 | 2.64 | 2.37 | 2.29 |
| 95% CI | 34.75-36.26 | 35.77-37.41 | 36.15-37.62 | 36.53-37.95 |
| Two-turn length, mm | ||||
| Mean | 32.80 | 33.56 | 34.48 | 34.75 |
| Range | 29.70-36.40 | 28.70-37.30 | 29.30-38.80 | 31.10-29.00 |
| SD | 1.68 | 1.86 | 1.71 | 1.82 |
| 95% CI | 32.28-33.32 | 32.98-34.15 | 33.94-35.01 | 34.19-35.32 |
| Angular length, deg | ||||
| Mean | 841 | 814 | ||
| Range | 724-974 | 726-935 | ||
| SD | 66.52 | 41.70 | ||
| 95% CI | 820-861 | 801-827 | ||
Abbreviations: CT, computed tomography; ECA, elliptic circular approximation; MPR, multiplanar reconstruction; MRI, magnetic resonance imaging.
Table 2.
ICC and Cronbach’s Alpha for the Quantification of the Reliability Between Measurement Methods.
| Modalities | ICC | Cronbach’s α |
|---|---|---|
| Cochlear duct length, mm | ||
| MRI: MPR vs ECA | 0.825 | 0.947 |
| MPR: MRI vs CT | 0.651 | 0.863 |
| ECA: MRI vs CT | 0.722 | 0.852 |
| CT: MPR vs ECA | 0.898 | 0.951 |
| Two-turn length, mm | ||
| MRI: MPR vs ECA | 0.789 | 0.923 |
| MPR: MRI vs CT | 0.435 | 0.783 |
| ECA: MRI vs CT | 0.566 | 0.810 |
| CT: MPR vs ECA | 0.880 | 0.941 |
| Angular length, deg: MRI vs CT | 0.646 | 0.835 |
Abbreviations: CT, computed tomography; ECA, elliptic circular approximation; ICC, intraclass correlation; MPR, multiplanar reconstruction; MRI, magnetic resonance imaging.
Comparison of MRI and CT Imaging
The round window is the most important structure for the estimation of the CDL in both approaches. The center of the round window is the starting point to determine diameter A (Figure 1, F and F′) and is 1 of the 2 values that are used in the ECA formula. In the MPR approach, the round window defines the point at which the Bézier path starts, which is used to measure the CDL (Figure 1, A and A′). In both imaging techniques, the round window, indicated by the ellipse, could be detected and used for the measurements (Figure 2, A and B). In addition, a correct identification of the helicotrema is needed for determination of the ALs (Figure 1, E and E′). In CT and MRI, the helicotrema could be visualized (Figure 2, C and D). The apical parts of the cochlea were better visualized in MRI, which resulted in clearer determination of the AL.
Measurements of the CDL
There were no significant differences (d = 0.36 mm, P = .1562) in CDL determination by ECA and MPR with CT data sets. The CDL measurement by ECA in MRI and CT also resulted in no significant differences (d = 0.65 mm, P = .1373). The CDL measured in MRI was significantly shorter by MPR than by ECA (d = 1.09 mm, P < .001). The MPR approach revealed significantly shorter CDL values in MRI than CT (d = 1.38 mm, P < .001; Figure 3A, Table 1). Neither ICC nor Cronbach’s alpha was rated as inacceptable19 (Table 2). The Bland-Altman plots showed differences when comparing the measurement modalities with regard to the clinically inacceptable error of the CDL, which was set as ±1.5 mm.20 The measured CDL values in CT via MPR and ECA (Figure 3E) showed good accuracy with low numbers of clinically inacceptable errors (8 of 42). There were higher numbers of clinically inacceptable errors (16 of 42) in measurements in MRI with a systematic underestimation of the CDL by MPR as compared with ECA (Figure 3B). In addition, there was a systematic underestimation of the CDL in MRI versus the measurements in CT for MPR (23 of 42; Figure 2C) and ECA (19 of 42; Figure 3D).
Figure 3.

(A) Comparison of the cochlear duct length (CDL) measured in MRI and multislice CT data sets. Values are presented as median (line), interquartile range (box), 95% CI (error bars), and outliers (circles). ns, not significant. ***P < .001. (B-E) Corresponding Bland-Altman plots. Dotted horizontal lines indicate clinically acceptable errors: ±1.5 mm. CT, computed tomography; ECA, elliptic circular approximation; MPR, multiplanar reconstruction; MRI, magnetic resonance imaging.
Calculation of the 2TL
No significant differences (d = 0.27 mm, P = .1578) were identified in the 2TL determination via ECA and MPR with CT data sets. The CDL measurements based on MRI were significantly shorter with the MPR approach versus the ECA formula (d = 0.76 mm, P < .001). 2TL was significantly shorter in MRI versus CT per the MPR approach (d = 1.67 mm, P < .001). By application of the ECA formula, the 2TL was significantly shorter in MRI versus CT (d = 1.19 mm, P < .001; Figure 4A, Table 1). ICC and Cronbach’s alpha values were not rated as inacceptable19 (Table 2). When the measurement modalities were compared with regard to clinically inacceptable errors of the 2TL, which was set as ±1.31 mm,21 the measured values in CT via MPR and ECA showed few inacceptable errors (6 of 42; Figure 4E). The number of clinically inacceptable errors was higher in the measurements with MRI by MPR and ECA (10 of 42; Figure 4B). A systematic underestimation of the 2TL with high numbers of clinically inacceptable errors was found in the measurements based on MRI as compared with CT for MPR (24 of 42; Figure 3C) and ECA (19 of 42; Figure 4D).
Figure 4.

(A) Comparison of the 2-turn length (2TL) measured in MRI and multislice CT data sets. Values are presented as median (line), interquartile range (box), 95% CI (error bars), and outliers (circles). ns, not significant. ***P < .001. (B-E) Corresponding Bland-Altman plots. Dotted horizontal lines indicate clinically acceptable errors: ±1.31 mm. CT, computed tomography; ECA, elliptic circular approximation; MPR, multiplanar reconstruction; MRI, magnetic resonance imaging.
Measurements of the AL
A significantly lower AL was determined in CT data sets as compared with MRI (d = 26.79°, P < .001; Figure 5A, Table 1). ICC and Cronbach’s alpha were not rated as inacceptable (Table 2). The Bland-Altman plot showed that the AL was systematically overestimated in measurements with MRI than CT data sets. There were 14 of 42 inacceptable clinical errors in MRI measurements, exceeding the set value of ±50° (Figure 5B).21
Figure 5.
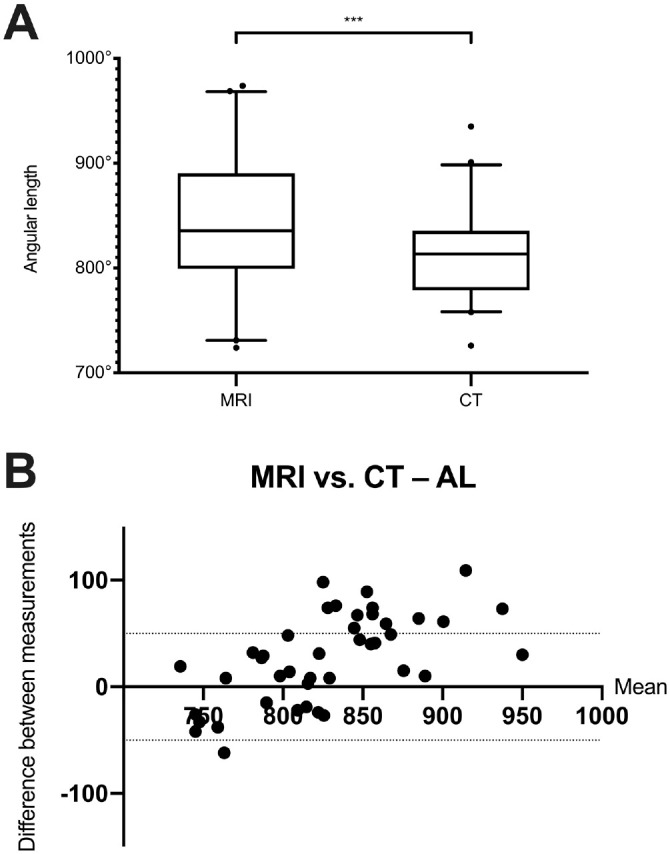
(A) Comparison of the AL measured in MRI and multislice CT data sets. Values are presented as median (line), interquartile range (box), 95% CI (error bars), and outliers (circles). ***P < .001. (B) Corresponding Bland-Altman plot. Dotted horizontal lines indicate clinically acceptable errors: ±50° for AL. AL, angular length; CT, computed tomography; MRI, magnetic resonance imaging.
Discussion
The results of the presented study show that there is a small but significant difference in the determination of the CDL and the 2TL between CT and MRI by the application of 2 approaches: ECA5 and MPR.11 The 2 modes of calculation were chosen since they are currently the most elaborated methods for measuring the CDL from radiologic data sets, and more important, they use different techniques for measuring cochlear parameters.
The ECA function is the latest development in calculations based on spiral functions,10 which originally used only diameter A for computation.16,22 In the ECA formula, the width of the cochlea (B value) has been integrated. To precisely measure the A and B values, the cochlea has to be rotated in the cochlear view,12,13 which was possible in the CT and MRI data sets. Several studies have investigated the ECA approach, demonstrating a high precision of CDL computation23 and low intra- and interobserver variability.24 Only 1 study has described a CDL value (32.91 mm) with CT,25 but in this investigation the CDL was corrected to the organ of Corti, which results in about 10% to 15% reduction.21 Thus, the mean CDL of 37.24 mm measured in CT data sets via ECA in the present study is similar and can be compared with MRI.
The second approach, MPR, is the newest development described in the field of 3-dimensional reconstructions of the cochlea.11 In this mode of calculation, a curved path (Bézier) along the lateral wall of the cochlear duct is set from the center of the round window to the helicotrema. In the presented study, a point was set every 30° to 60°.20,22,26 One study investigated the needed numbers of markers and showed no benefit in setting more markers but an importance of setting the Bézier path correctly to the outer wall.26 In previous studies, a CDL of 35.8 mm was determined in CT27 and 37.9 mm in cone beam CT.28 The values of the MPR measurements in the presented study are between CT and cone beam CT. Consequently, they can be reliably compared with MRI measurements.
The values measured with MRI by ECA and MPR were slightly but significantly shorter than the ones with CT. This can be explained by the clearer determination of the cochlear outer wall, which is needed to set the markers for diameters A and B and for the curved path along the lateral wall. In contrast, higher values were measured for the AL, which might be explained by the fact that the helicotrema can be better visualized in MRI than CT. The differences are probably due to the different imaging modalities. In CT, ionized radiation is highly adsorbed by the bone due to its high density, which results in a high contrast between bone and the aqueous lymph of the cochlea. In contrast, in MRI the protons of the lymph are responsible for the signal, which results in slightly different imaging of the cochlea.
However, it must be mentioned that the absolute differences are small between the imaging modalities: for example, 1.19 mm (ECA) and 1.68 mm (MPR) for the 2TL would result in a frequency shift of about 58 Hz at an intracochlear length of 28 mm within the organ of Corti.29 In preoperative planning, these differences will not lead to the selection of a different electrode, since the electrodes that can reach up to 2TL have a length difference of 4 mm.30 Consequently, the small difference will have no clinically relevant impact on the selection of the electrode.
The measurement of CDL via MRI and CT has been investigated in 2 studies. In one study, just diameter A was used, and a difference of 0.96 mm of the CDL was reported.31 The other study used further development of the ECA formula, in which a correction for the organ of Corti was implemented.21 Similar to the presented results, lower values in MRI were estimated.32
Note that measurements of the CDL depend on the resolution of the image data sets. The longest CDL values (up to 40 mm) were determined in images from experimental imaging systems, such as micro-CT5,33 and synchrotron imaging.8 But in clinical imaging, there is a dependence of the CDL on the resolution. The CDL measured in flat-panel volume CT (resolution, 100 µm) resulted in a significantly longer CDL when compared with standard flat-panel volume CT (460 µm) and CT (600 µm).34 Furthermore, there was a tendency toward a longer CDL in CT data sets with higher resolution.35 To exclude the variability of the resolution, the slice thickness was set to 600 µm for both MRI and CT in the present study.
Based on the present results, it is possible to waive ionized radiation–based imaging prior to cochlear implantation.36 However, not performing a preoperative CT scan can lead to different problems in surgical planning. The CT scan is mainly used to identify structures of the temporal bone, especially the course of the facial nerve and the size of the mastoid.9 Nonetheless there is ongoing research regarding the detection of these structures in MRI37,38; thus, preoperative planning is possible by using only MRI. Furthermore, postoperative control of the electrode can be determined in MRI.39
Limitations
The measurements were done only by 1 experienced observer. However, it has been shown that the ECA formula has low intra- and interobserver variability,24 so this was not further investigated. When different imaging modalities are compared and not the quality and reliability of a formula or an approach checked, measurements by 1 observer might be better to not have additional variables, such as different settings of contrast and brightness. Both approaches used in the study require clear visualization of the round window. Due to the limited resolution and the missing signal of the bone in the CISS sequence (constructive interference in steady state), there may arise difficulties identifying this structure in MRI. This problem was partially solved by using a radiologic high-resolution screen and identifying the semicircular impression of the perilymph. Nevertheless, other studies have shown that is possible to detect the round window in MRI, either for CDL measurements32 or for detection of perilymphatic fistulas.40 Ultimately, of course, there are still uncertainties in the area of the round window and the apical portion of the cochlea in CT and MRI, which require an experienced observer. In addition, the sample size might be too small, but previous studies investigating the CDL have shown that a number of 10 is adequate to obtain sufficient statistical power.7,41,42
Conclusion
In the presented study, the computation of cochlear length and angular measurements was simultaneously performed with CT and MRI by 2 new and relevant modes of calculation. The most relevant values regarding cochlear length (CDL and 2TL), as well as the measurement of the cochlear angle, were determined with MRI producing similar values to CT without clinically relevant differences.
Author Contributions
Johannes Taeger, study design, data analysis and manuscript composition; Franz Tassilo Müller-Graff, data analysis and manuscript composition; Lukas Ilgen, study design and manuscript revision; Phillip Schendzielorz, manuscript revision; Rudolf Hagen, manuscript revision; Tilman Neun, data acquisition and manuscript revision; Kristen Rak, study design, manuscript composition and manuscript revision.
Disclosures
Competing interests: None.
Sponsorships: None.
Funding source: None.
Acknowledgments
We thank the team of the Comprehensive Hearing Center at the University of Wuerzburg for the extensive help.
Footnotes
ORCID iD: Kristen Rak  https://orcid.org/0000-0003-2109-3536
Supplemental Material: Additional supporting information is available at http://journals.sagepub.com/doi/suppl/10.1177/2473974X211045312
References
- 1.Buchner A, Illg A, Majdani O, Lenarz T. Investigation of the effect of cochlear implant electrode length on speech comprehension in quiet and noise compared with the results with users of electro-acoustic-stimulation, a retrospective analysis. PloS One. 2017;12(5):e0174900. [DOI] [PMC free article] [PubMed] [Google Scholar]
- 2.O’Connell BP, Cakir A, Hunter JB, et al. Electrode location and angular insertion depth are predictors of audiologic outcomes in cochlear implantation. Otol Neurotol. 2016;37(8):1016-1023. [DOI] [PMC free article] [PubMed] [Google Scholar]
- 3.Escude B, James C, Deguine O, Cochard N, Eter E, Fraysse B. The size of the cochlea and predictions of insertion depth angles for cochlear implant electrodes. Audiol Neurootol. 2006;11(suppl 1):27-33. [DOI] [PubMed] [Google Scholar]
- 4.Kjer HM, Fagertun J, Wimmer W, et al. Patient-specific estimation of detailed cochlear shape from clinical CT images. Int J Comput Assist Radiol Surg. 2018;13(3):389-396. [DOI] [PubMed] [Google Scholar]
- 5.Schurzig D, Timm ME, Batsoulis C, et al. A novel method for clinical cochlear duct length estimation toward patient-specific cochlear implant selection. OTO Open. 2018;2(4):2473974X18800238. [DOI] [PMC free article] [PubMed] [Google Scholar]
- 6.Wurfel W, Lanfermann H, Lenarz T, Majdani O. Cochlear length determination using cone beam computed tomography in a clinical setting. Hear Res. 2014;316:65-72. [DOI] [PubMed] [Google Scholar]
- 7.Schendzielorz P, Ilgen L, Neun T, et al. Precise evaluation of the cochlear duct length by flat-panel volume computed tomography (fpVCT): implication of secondary reconstructions. Otol Neurotol. 2021;42(3):e294-e303. [DOI] [PubMed] [Google Scholar]
- 8.Koch RW, Elfarnawany M, Zhu N, Ladak HM, Agrawal SK. Evaluation of cochlear duct length computations using synchrotron radiation phase-contrast imaging. Otol Neurotol. 2017;38(6):e92-e99. [DOI] [PubMed] [Google Scholar]
- 9.Young JY, Ryan ME, Young NM. Preoperative imaging of sensorineural hearing loss in pediatric candidates for cochlear implantation. Radiographics. 2014;34(5):E133-E149. [DOI] [PubMed] [Google Scholar]
- 10.Ketten DR, Skinner MW, Wang G, Vannier MW, Gates GA, Neely JG. In vivo measures of cochlear length and insertion depth of nucleus cochlear implant electrode arrays. Ann Otol Rhinol Laryngol Suppl. 1998;175:1-16. [PubMed] [Google Scholar]
- 11.Würfel W, Lanfermann H, Lenarz T, Majdani O. Cochlear length determination using cone beam computed tomography in a clinical setting. Hear Res. 2014;316:65-72. [DOI] [PubMed] [Google Scholar]
- 12.Xu J, Xu SA, Cohen LT, Clark GM. Cochlear view: postoperative radiography for cochlear implantation. Am J Otol. 2000;21(1):49-56. [PubMed] [Google Scholar]
- 13.Verbist BM, Skinner MW, Cohen LT, et al. Consensus panel on a cochlear coordinate system applicable in histologic, physiologic, and radiologic studies of the human cochlea. Otol Neurotol. 2010;31(5):722-730. [DOI] [PMC free article] [PubMed] [Google Scholar]
- 14.Schurzig D, Timm ME, Batsoulis C, John S, Lenarz T. Analysis of different approaches for clinical cochlear coverage evaluation after cochlear implantation. Otol Neurotol. 2018;39(8):e642-e650. [DOI] [PubMed] [Google Scholar]
- 15.Lexow GJ, Kluge M, Gellrich NC, Lenarz T, Majdani O, Rau TS. On the accuracy of cochlear duct length measurement in computed tomographic images. Eur Arch Otorhinolaryngol. 2018;275(5):1077-1085. [DOI] [PubMed] [Google Scholar]
- 16.Alexiades G, Dhanasingh A, Jolly C. Method to estimate the complete and two-turn cochlear duct length. Otol Neurotol. 2015;36(5):904-907. [DOI] [PubMed] [Google Scholar]
- 17.Erixon E, Rask-Andersen H. How to predict cochlear length before cochlear implantation surgery. Acta Otolaryngol. 2013;133(12):1258-1265. [DOI] [PubMed] [Google Scholar]
- 18.Wirtz M. Determining the quality of rater judgements using intraclass correlation, and enhancing rater judgements. Article in German. Die Rehabilitation. 2004;43(6):384-389. [DOI] [PubMed] [Google Scholar]
- 19.Cicchetti D. Guidelines, criteria, and rules of thumb for evaluating normed and standardized assessment instrument in psychology. Psychol Assess. 1994;6:284-290. [Google Scholar]
- 20.Koch RW, Elfarnawany M, Zhu N, Ladak HM, Agrawal SK. Evaluation of cochlear duct length computations using synchrotron radiation phase-contrast imaging. Otol Neurotol. 2017;38(6):E92-E99. [DOI] [PubMed] [Google Scholar]
- 21.Rak K, Ilgen L, Taeger J, et al. Influence of cochlear parameters on the current practice in cochlear implantation: development of a concept for personalized medicine. Article in German. HNO. Published online December14, 2020. doi: 10.1007/s00106-020-00968-0 [DOI] [PubMed] [Google Scholar]
- 22.Escudé B, James C, Deguine O, Cochard N, Eter E, Fraysse B. The size of the cochlea and predictions of insertion depth angles for cochlear implant electrodes. Audiol Neurootol. 2006;11(suppl 1):27-33. [DOI] [PubMed] [Google Scholar]
- 23.Schurzig D, Lexow GJ, Majdani O, Lenarz T, Rau TS. Three-dimensional modeling of the cochlea by use of an arc fitting approach. Comput Methods Biomech Biomed Engin. 2016;19(16):1785-1799. [DOI] [PubMed] [Google Scholar]
- 24.Mertens G, Van Rompaey V, Van de Heyning P, Gorris E, Topsakal V. Prediction of the cochlear implant electrode insertion depth: clinical applicability of two analytical cochlear models. Sci Rep. 2020;10(1):3340. [DOI] [PMC free article] [PubMed] [Google Scholar]
- 25.Khurayzi T, Almuhawas F, Sanosi A. Direct measurement of cochlear parameters for automatic calculation of the cochlear duct length. Ann Saudi Med. 2020;40(3):212-218. [DOI] [PMC free article] [PubMed] [Google Scholar]
- 26.Wuerfel W, Burke W, Lenarz T, Kraemer R. Cochlear length determination in temporal bone specimens using histological serial-micro grinding imaging, micro computed tomography and flat-panel volumetric computed tomography. Otolaryngology Online Journal. 2015;5:39-59. [Google Scholar]
- 27.Meng J, Li S, Zhang F, Li Q, Qin Z. Cochlear size and shape variability and implications in cochlear implantation surgery. Otol Neurotol. 2016;37(9):1307-1313. [DOI] [PubMed] [Google Scholar]
- 28.Timm ME, Majdani O, Weller T, et al. Patient specific selection of lateral wall cochlear implant electrodes based on anatomical indication ranges. PLoS One. 2018;13(10):e0206435. [DOI] [PMC free article] [PubMed] [Google Scholar]
- 29.Greenwood DD. Critical bandwidth and the frequency coordinates of the basilar membrane. J Acoust Soc Am. 1961;33(10):1344-1356. [Google Scholar]
- 30.Dhanasingh A, Jolly C. An overview of cochlear implant electrode array designs. Hear Res. 2017;356:93-103. [DOI] [PubMed] [Google Scholar]
- 31.Nash R, Otero S, Lavy J. Use of MRI to determine cochlear duct length in patients undergoing cochlear implantation. Cochlear Implants Int. 2019;20(2):57-61. [DOI] [PubMed] [Google Scholar]
- 32.George-Jones NA, Tolisano AM, Kutz JW, Jr., Isaacson B, Hunter JB. Comparing cochlear duct lengths between CT and MR images using an otological surgical planning software. Otol Neurotol. 2020;41(9):e1118-e1121. [DOI] [PubMed] [Google Scholar]
- 33.Iyaniwura JE, Elfarnawany M, Ladak HM, Agrawal SK. An automated A-value measurement tool for accurate cochlear duct length estimation. J Otolaryngol Head Neck Surg. 2018;47(1):5. [DOI] [PMC free article] [PubMed] [Google Scholar]
- 34.Muller-Graff FT, Ilgen L, Schendzielorz P, et al. Implementation of secondary reconstructions of flat-panel volume computed tomography (fpVCT) and otological planning software for anatomically based cochlear implantation. Eur Arch Otorhinolaryngol. Published online June8, 2021. doi: 10.1007/s00405-021-06924-0 [DOI] [PMC free article] [PubMed] [Google Scholar]
- 35.Cooperman SP, Aaron KA, Fouad A, Tran E, Blevins NH, Fitzgerald MB. Assessment of inter- and intra-rater reliability of tablet-based software to measure cochlear duct length. Otol Neurotol. 2021;42(4):558-565. [DOI] [PubMed] [Google Scholar]
- 36.Ehrmann-Muller D, Shehata-Dieler W, Kaulitz S, et al. Cochlear implantation in children without preoperative computed tomography diagnostics: analysis of procedure and rate of complications. Int J Pediatr Otorhinolaryngol. 2020;138:110266. [DOI] [PubMed] [Google Scholar]
- 37.Haneda J, Ishikawa K, Okamoto K. Better continuity of the facial nerve demonstrated in the temporal bone on three-dimensional T1-weighted imaging with volume isotropic turbo spin echo acquisition than that with fast field echo at 3.0 tesla MRI. J Med Imaging Radiat Oncol. 2019;63(6):745-750. [DOI] [PubMed] [Google Scholar]
- 38.Fruauff K, Coffey K, Chazen JL, Phillips CD. Temporal bone imaging. Top Magn Reson Imaging. 2015;24(1):39-55. [DOI] [PubMed] [Google Scholar]
- 39.Stratmann A, Mittmann P, Rademacher G, et al. MRI-based estimation of scalar cochlear-implant electrode position. Biomed Res Int. 2017;2017:6372704. [DOI] [PMC free article] [PubMed] [Google Scholar]
- 40.Venkatasamy A, Al Ohraini Z, Karol A, et al. CT and MRI for the diagnosis of perilymphatic fistula: a study of 17 surgically confirmed patients. Eur Arch Otorhinolaryngol. 2020;277(4):1045-1051. [DOI] [PubMed] [Google Scholar]
- 41.Schurzig D, Timm ME, Batsoulis C, John S, Lenarz T. Analysis of different approaches for clinical cochlear coverage evaluation after cochlear implantation. Otol Neurotol. 2018;39(8):e642-e650. [DOI] [PubMed] [Google Scholar]
- 42.Schurzig D, Timm ME, Lexow GJ, Majdani O, Lenarz T, Rau TS. Cochlear helix and duct length identification: evaluation of different curve fitting techniques. Cochlear Implants Int. 2018;19(5):268-283. [DOI] [PubMed] [Google Scholar]