

Abstract
Background
Low‐level tragus stimulation (LLTS) has been shown to significantly reduce atrial fibrillation (AF) burden in patients with paroxysmal AF. P‐wave alternans (PWA) is believed to be generated by the same substrate responsible for AF. Hence, PWA may serve as a marker in guiding LLTS therapy. We investigated the utility of PWA in guiding LLTS therapy in patients with AF.
Methods and Results
Twenty‐eight patients with AF were randomized to either active LLTS or sham (earlobe stimulation). LLTS was delivered through a transcutaneous electrical nerve stimulation device (pulse width 200 μs, frequency 20 Hz, amplitude 10–50 mA), for 1 hour daily over a 6‐month period. AF burden over 2‐week periods was assessed by noninvasive continuous ECG monitoring at baseline, 3 months, and 6 months. A 5‐minute control ECG for PWA analysis was recorded during all 3 follow‐up visits. Following the control ECG, an additional 5‐minute ECG was recorded during active LLTS in all patients. At baseline, acute LLTS led to a significant rise in PWA burden. However, active patients receiving chronic LLTS demonstrated a significant reduction in both PWA and AF burden after 6 months (P<0.05). Active patients who demonstrated an increase in PWA burden with acute LLTS showed a significant drop in AF burden after 6 months of chronic LLTS.
Conclusions
Chronic, intermittent LLTS resulted in lower PWA and AF burden than did sham control stimulation. Our results support the use of PWA as a potential marker for guiding LLTS treatment of paroxysmal AF.
Keywords: atrial fibrillation, P‐wave alternans, spectral method, vagal stimulation
Subject Categories: Atrial Fibrillation, Electrophysiology, Autonomic Nervous System
Nonstandard Abbreviations and Acronyms
- AA
atrial alternans
- HRV
heart rate variability
- LLTS
low‐level transcutaneous VNS/low‐level tragus stimulation
- PWA
P‐wave alternans
- VNS
vagus nerve stimulation
Clinical Perspective
What Is New?
Chronic low‐level transcutaneous electrical stimulation of the tragus (LLTS) of the ear significantly lowers both P‐wave alternans (PWA) and atrial fibrillation (AF) burden in patients with paroxysmal AF.
While acute LLTS causes an increase in PWA, chronic LLTS leads to a decrease in PWA, and an acute increase in PWA at baseline predicts lower AF burden at follow‐up.
What Are the Clinical Implications?
Chronic LLTS may be used as an alternative treatment option in selected patients with AF, and PWA may serve as a potential biomarker for identifying patients who are most likely to benefit from LLTS, guiding treatment of paroxysmal AF.
Atrial fibrillation (AF) is the most common arrhythmia in clinical practice, accounting for approximately one third of hospitalizations for cardiac rhythm disturbances.1 AF has been associated with significant morbidity and decline of quality of life.2
Recent evidence suggests that the autonomic nervous system plays a central role in the pathogenesis of AF, especially in the early stages,3 and several studies4, 5 have shown that autonomic modulation with vagus nerve stimulation (VNS) can suppress AF in experimental models.4, 5 More recently, in a proof‐of‐concept study in humans, we showed that in patients with drug‐refractory AF undergoing AF ablation, noninvasive low‐level transcutaneous VNS (LLTS) for just 1 hour significantly shortened AF duration and decreased inflammatory cytokines.6 A recent clinical trial TREAT‐AF (Transcutaneous Electrical Vagus Nerve Stimulation to Suppress Atrial Fibrillation) demonstrated that LLTS for 1 hour daily can significantly reduce AF burden in ambulatory patients with paroxysmal AF over a 6‐month period.7 Yet, the response to LLTS has been variable among individual patients, highlighting the need to optimize patient selection, in order to maximize the efficacy of this novel therapeutic strategy.
Given the evidence supporting the role of atrial alternans (AA) promoting an arrhythmogenic atrial substrate8, 9, 10, 11, 12 or being a precursor to AF,10, 11, 13, 14, 15, 16, 17 we hypothesized that P‐wave alternans (PWA), a subtle beat‐to‐beat variation in the morphology of the atrial electrocardiographic waveform, can be used as a biomarker to assess the effect of LLTS on AF burden and thus guide patient selection.
Methods
The data used in the analysis will be available to any investigator, upon request.
Human Study
This is an ancillary study of the recently published TREAT AF randomized clinical trial7; the last 28 patients were included in this ancillary study, after modification of the original protocol. In brief, patients with paroxysmal AF, who had at least 2 documented episodes of AF within 3 months of randomization, were eligible for inclusion in the study. Exclusion criteria included left ventricular ejection fraction <40%, significant valvular disease, recent (<6 months) stroke or myocardial infarction, severe heart failure (New York Heart Association class III or IV), recurrent vasovagal syncopal episodes, unilateral or bilateral vagotomy, and pregnancy or nursing. In addition, we excluded patients with sick sinus syndrome, second‐ or third‐degree atrioventricular block, bifascicular block and prolonged first‐degree atrioventricular block (PR >300 ms), in the absence of a pacemaker. The study was approved by the Institutional Review Board of the University of Oklahoma Health Sciences Center and patients provided informed consent before enrollment in the study. Enrollment in this study started after amendment of the original protocol. Thus, a total of 28 patients were enrolled in this study. A schematic of the study protocol is presented in Figure 1.
Figure 1. Schematic depicting the experimental protocol.
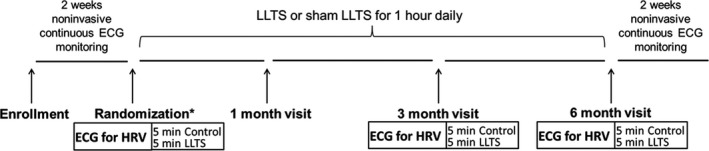
Patients with paroxysmal AF were randomized into sham (no chronic LLTS) and active (chronic LLTS) groups. Ten minutes of ECG was recorded at baseline, 3‐month, and 6‐month follow‐up visits, wherein 5 minutes were recorded during control (no acute LLTS), and 5 minutes during acute LLTS. Two weeks of noninvasive ECG monitoring both before and after the 6‐month study duration was performed to calculate AF burden before and after LLTS treatment. AF indicates atrial fibrillation; HRV, heart rate variability; and LLTS, low‐level tragus stimulation. * denotes sham or active group.
Low‐Level Tragus Stimulation
Patients were randomized to either active or sham LLTS groups. LLTS was delivered by the patients themselves at home after individual training, through a transcutaneous electrical nerve stimulation device (Parasym device, Parasym Health, Inc, London, UK) for 1 hour daily over a 6‐month period. Active LLTS was accomplished by attaching an ear clip to the tragus, which is innervated by the auricular branch of the vagus nerve.18 Sham stimulation was delivered to the earlobe, which is devoid of vagal innervation.18 The device was set at a pulse width of 200 μs and a pulse frequency of 20 Hz. The stimulation strength was gradually increased until the patient experienced mild discomfort, then decreased by 1 mA below that threshold.
Patient Follow‐up
All patients were followed for 6 months. AF burden, defined as the percent of time spent in AF over a 2‐week period, was assessed by noninvasive continuous ECG monitoring (Ziopatch; iRythm Technologies, Inc, San Francisco, CA) at baseline, at 3 months, and at 6 months. A 5‐minute ECG was recorded as control for heart rate variability (HRV) and PWA analysis at each visit (baseline, 3 months and 6 months), using a PC‐based ECG machine (SE 1515; Edan USA, Inc) with a sampling rate of 1000 Hz. Immediately after the control ECG, an additional 5‐minute ECG was performed during active LLTS in all patients (active and sham), irrespective of randomization group (Figure 1), to gauge the acute effects of LLTS at each time point. Hence, while active patients effectively received both chronic and acute LLTS, sham patients received only acute LLTS.
AA Estimation
Extensive prior work by our laboratory has established the ability of microvolt T‐wave alternans to predict short‐19, 20, 21, 22 and long‐term23, 24, 25 susceptibility to ventricular tachyarrhythmias and sudden cardiac death. We have customized an algorithm currently used for estimating ventricular T‐wave alternans so that it can be applied to estimating AA. Further details of the algorithm are presented in Data S1.
We estimated the level of PWA reflecting atrial depolarization (details presented in Data S1), during control (no stimulation) and LLTS (acute tragus stimulation), for sham and active groups at baseline, 3 months, and 6 months.
AA Burden
Estimates of alternans voltage and Kscore were generated based on the spectral method as previously described.19, 20, 21, 22, 23, 24, 26, 27 Briefly, for each estimate, a matrix of 128 beats was used in which a window that reflected the atrial depolarization for each beat was created. Then, the power spectrum was estimated for each time‐aligned sequence of sample points (Figure 2), within the selected atrial waveform (ie, P‐wave reflecting atrial depolarization).26 Subsequently, the power spectra for all sample points within the waveform were averaged and the statistical estimates of alternans (ie, alternans voltage, noise, and Kscore), were obtained.26 The alternans voltage is a direct measure of the presence of alternans, while the Kscore is a measure of the statistical significance of the alternans voltage (Figure 2). Once estimates of alternans voltage and Kscore were generated (for more details, please see Data S1), we calculated PWA burden for each patient as follows:
where a positive PWA sequence was defined as any 128‐beat sequence with Kscore >3, alternans voltage >0.5 μV, and goodbeat % >80. In addition, ECG recordings with at least 50 good sequences across all leads were used for analysis.
Figure 2. Spectral method for estimation of P‐wave alternans.
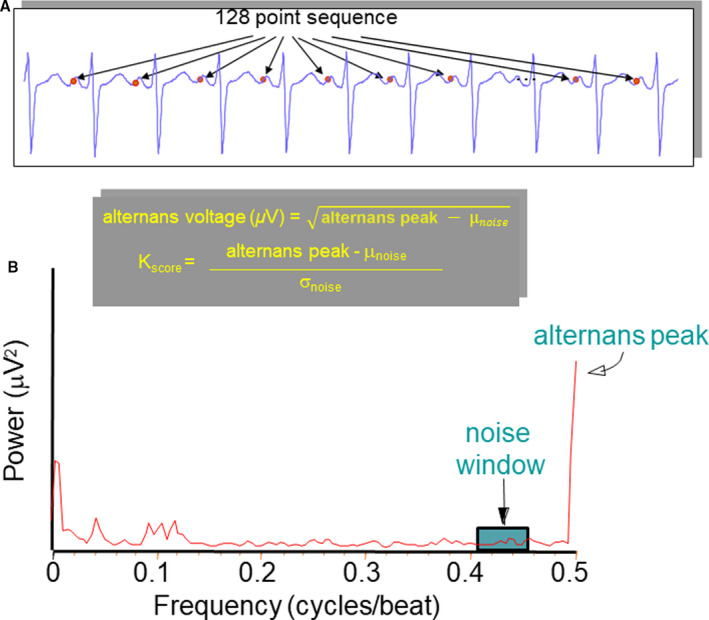
A, One hundred twenty‐eight time‐aligned (with respect to the R‐wave peak) P‐wave points that are used in the power spectrum estimation. B, Representative example of power spectrum of beat‐to‐beat fluctuations in P‐wave morphology. The alternans voltage is the square root of the amplitude of the power spectrum at the alternans frequency (alternans peak) minus the mean background noise level (μnoise). The alternans ratio, Kscore, is the amplitude of the spectrum at the alternans frequency (alternans peak) minus the mean background noise level (μnoise), divided by the SD of the noise (σnoise) in the reference noise band.
Effect of Vagal Stimulation on HRV
We further sought to evaluate the effect of VNS on HRV. Clinically, high HRV has been associated with healthy cardiac tissue28 while low HRV has been correlated with increased risk of lethal ventricular arrhythmias and sudden death.29 Hence, evaluation of HRV has become an important method for assessing cardiac autonomic regulation. Here we calculated both linear time domain and nonlinear measures of HRV to gauge the effect of LLTS on autonomic regulation. Detailed methods documenting the calculation of individual HRV parameters are presented in Data S1.
Statistical Analysis
For each subject, sequences across all 12 leads with the number of good beats exceeding 80% and no respiration interference were combined to calculate the mean value, presented here. ECG recordings that did not meet the good beat threshold and did not have at least 50 good sequences were excluded from the analysis.
Continuous data are presented as mean±SD or median and interquartile range, as applicable. Categorical data are presented as percentages. Comparisons of continuous data were performed using a mixed linear model, with adjustment for the respective baseline values. Significant group‐by‐time interactions were followed by time‐stratified analyses. For all pairwise testing, we adjusted for multiple comparisons using Tukey's method. The association of PWA burden with AF burden was examined using a polynomial, as well as logistic regression model, after adjustment for baseline values. Logarithmic transformation was performed as appropriate, to satisfy the model assumptions of normality and homoscedasticity. Categorical data were compared using Fisher's exact test. Values of P<0.05 were considered statistically significant. Statistical analysis was performed using SAS software version 9.4 (SAS Institute, Cary, NC) and MATLAB (MathWorks Inc, Natick, MA).
In figures, data are presented as median (horizontal solid line), 75% to 25% percentiles (box), and 90% to 10% percentiles (error bars).
Results
Patient Population
The baseline clinical characteristics of the patients enrolled in this study are summarized in Table 1. Of the 28 patients enrolled at baseline, n=12 were randomized to sham and n=16 were randomized to the active LLTS group. There were no differences in clinical characteristics between the sham and active LLTS groups. Four patients (2 in each group) withdrew consent after 3 months of being in the study, while 1 patient in the sham group died of myocardial infarction. The rest of the patients completed the entire study. The stimulation intensity was similar in the 2 groups (sham 18.9±9.3 mA versus LLTS: 16.2±8.5 mA; P=0.42). No device‐related adverse events were reported.
Table 1.
Baseline Characteristics of the Patient Population
| Sham (n=12) | Active (n=16) | P Value | |
|---|---|---|---|
| Age, y | 60.3±12.5 | 66.3±7.6 | 0.17 |
| Female sex, % | 6 (50) | 8 (50) | 1.0 |
| Body mass index, kg/m2 | 31.7±5.4 | 30.6±8.2 | 0.71 |
| Diabetes mellitus, % | 3 (25) | 3 (19) | 0.28 |
| Hypertension, % | 9 (75) | 12 (75) | 1.0 |
| Coronary artery disease, % | 4 (33) | 5 (31) | 1.0 |
| Heart failure, % | 3 (25) | 3 (19) | 0.59 |
| Obstructive sleep apnea, % | 5 (42) | 5 (31) | 0.58 |
| Antiarrhythmic drugs, % | 7 (58) | 5 (31) | 0.14 |
| Years in atrial fibrillation | 6.0±5.3 | 4.1±3.3 | 0.37 |
| CHADS2‐VA2Sc score | 2.6±1.7 | 3.0±1.7 | 0.61 |
| Left ventricular ejection fraction, % | 57.7±7.7 | 62.4±6.8 | 0.18 |
| Left atrial diameter, cm | 4.8±1.0 | 4.6±0.6 | 0.68 |
| Medical therapy | |||
| Beta blockers | 11 (92) | 14 (88) | 1.0 |
| Calcium channel blockers | 5 (42) | 4 (25) | 0.43 |
| Class I antiarrhythmics | 4 (33) | 4 (25) | 0.69 |
| Class III antiarrhythmics | 2 (17) | 1 (6) | 0.56 |
Numbers in parentheses reflect percentages.
Effect of Chronic LLTS on Heart Rate, HRV, P‐Wave Duration, QT, QTc, PR, and Tpeak‐Tend
We first evaluated the effect of LLTS on heart rate for both sham and active patients. No significant changes were observed with chronic LLTS on either group, indicating that the selected stimulation parameters did not cause a change in resting heart rate (Figures S1 and S2). Chronic LLTS did not significantly alter any ECG parameter, including P‐wave duration, QT‐interval, QTc (QT interval corrected for heart rate), PR‐interval, and Tpeak‐Tend interval (Figures S3 through S7). Summary results of chronic LLTS on different HRV measures, namely, SD of RR interval, root mean square of the successive differences of RR intervals, NN50 count, pNN50, and SD2/SD1 ratio presented in Data S1 have shown mostly no differences between groups (Figures S8 through S12).
Effect of Chronic LLTS on PWA and AF Burden
Figure 3 demonstrates summary results of chronic LLTS on AF burden across all active and sham patients. AF burden was significantly lower in the active group compared with sham, after 6 months of chronic LLTS. Figure 4 demonstrates summary results of chronic LLTS on PWA burden during control conditions (no acute LLTS), across all active and sham patients. Similar to AF burden, PWA burden was significantly lower in the active group compared with sham, after 6 months of chronic LLTS. A summary of AF burden and PWA burden at the respective time points is shown in Table 2. Summary results of chronic LLTS on PWA voltage and Kscore are presented in Figures S13 through S16.
Figure 3. Chronic effects of LLTS on AF burden in active and sham patients.
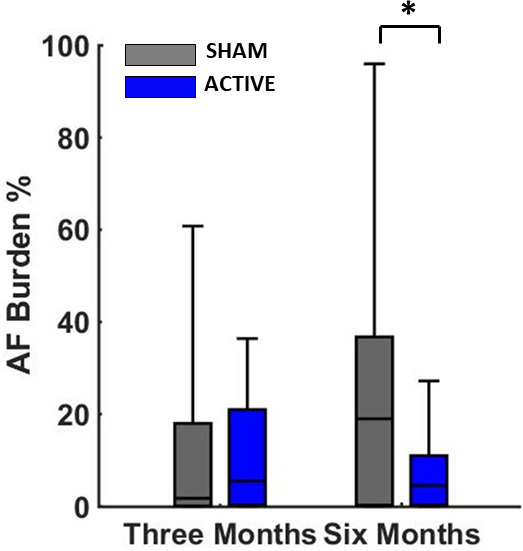
There has been a statistically significant decrease of AF burden at 6 months in the active group compared with sham. The P value is based on a comparison of median AF burden levels at the 6‐month time point after adjusting for baseline measures. “*” denotes statistical significance of P<0.05. AF indicates atrial fibrillation; and LLTS, low‐level tragus stimulation.
Figure 4. Chronic effects of LLTS on PWA burden in active and sham patients.
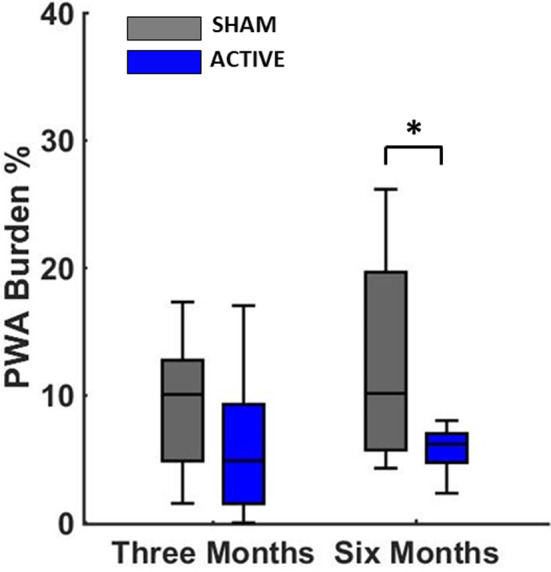
There has been a statistically significant decrease of PWA burden at 6 months in the active group compared with sham. The P value is based on a comparison of median PWA burden levels at the 6‐month time point after adjusting for baseline measures. “*” denotes statistical significance of P<0.05. LLTS indicates low‐level tragus stimulation; and PWA, P‐wave alternans.
Table 2.
Summary of AF Burden and PWA Burden at Baseline and Follow‐up
| AF Burden (%) | PWA Burden (%) | |||
|---|---|---|---|---|
| Sham | Active | Sham | Active | |
| Baseline | 13.0±13.1 | 14.3±12.2 | 9.6±8.1 | 8.2±7.7 |
| 3 mo | 15.2±13.9 | 12.7±9.2 | 11.2±8.9 | 8.1±6.0 |
| 6 mo | 25.7±16.6 | 10.3±8.7* | 13.9±9.7 | 7.7±3.5* |
AF indicates atrial fibrillation; and PWA, P‐wave alternans.
P<0.05 vs sham.
Effect of Acute LLTS on PWA
Figures 5A and 5B demonstrate summary results of acute LLTS on PWA burden during control conditions (no stimulation) and LLTS at baseline, before commencement of chronic active LLTS. Acute LLTS led to a significant increase in PWA burden. Figure 5B demonstrates summary results of the effect of acute LLTS on ΔPWA burden at 3 and 6 months. Change in PWA burden because of acute LLTS compared with control conditions (no stimulation) was evaluated at each time point. ΔPWA burden was significantly lower in the active group compared with sham with acute stimulation at 6 months, suggesting that chronic LLTS modified the effect of acute LLTS over time.
Figure 5. Effect of LLTS on PWA at baseline and follow‐up.
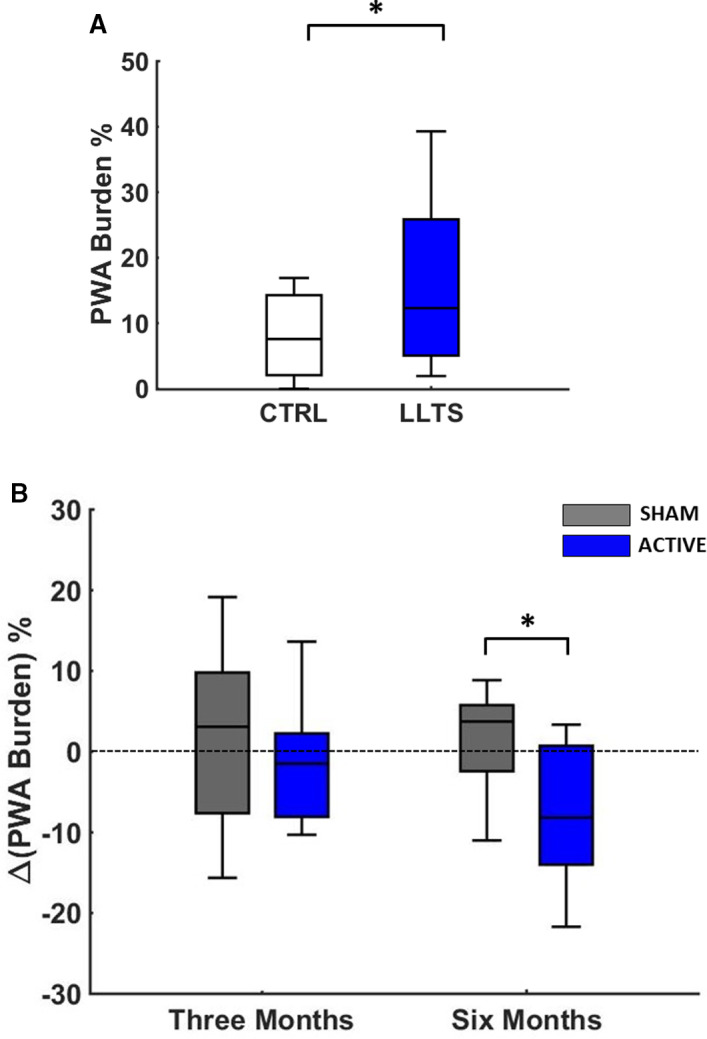
Summary results of acute LLTS on PWA burden at baseline, for all patients (A). In (B), the change in PWA burden before and after acute LLTS was compared between the 2 groups at 3 and 6 months of follow‐up. At 6 months, acute LLTS in the LLTS group resulted in a favorable decrease in PWA burden, which was significantly different than the respective change in the sham group. “*” denotes statistical significance of P<0.05. CRTL indicates control; LLTS, low‐level tragus stimulation; and PWA, P‐wave alternans.
Identifying Early Markers of Effective LLTS Treatment
Given that not all active patients had a similar response to chronic LLTS, we sought to identify whether patients who produced an early indicative response to acute LLTS also demonstrated a response to chronic therapy, hence aiding us in identifying potential biomarkers for effective LLTS treatment. Patients in the active group were categorized into 2 subgroups based on their initial response to LLTS: A1, patients with an initial increase in PWA burden during acute LLTS at baseline (n=8) and A2, patients with no increase in PWA burden during acute LLTS at baseline (n=8). Patients in group A1 had significantly lower AF burden at 6 months compared with group A2 (Figure 6A). Using logistic regression analysis, an acute increase of PWA at baseline predicted a significant decrease in AF burden at 6 months (odds ratio, 0.4; 95% CI, 0.17–0.94, P=0.03). In addition, at the individual patient level, there was a significant negative linear association between the change in AF burden and PWA burden from baseline to 6 months with acute stimulation, suggesting that an acute increase in PWA at baseline predicts lower AF burden at follow‐up and may be used as a biomarker of response to chronic LLTS (Figure 6B).
Figure 6. Response to chronic LLTS, according to the baseline acute response to LLTS.
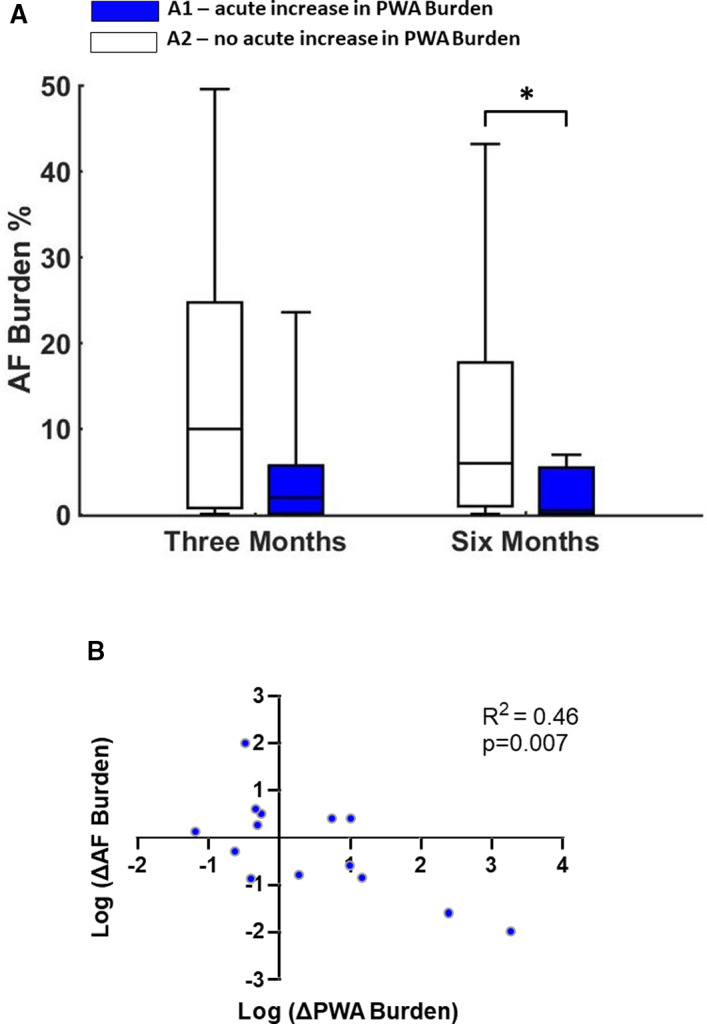
A, Patients in the active group were categorized into 2 subgroups based on their initial response to LLTS. A1, patients with an initial increase in PWA burden during acute LLTS at baseline and A2, patients with no increase in PWA burden during acute LLTS at baseline. Patients in group A1 had a significant decrease in AF burden at 6 months, whereas AF burden did not improve with chronic LLTS in group A2. B, Scatter plot of change in AF burden with respect to change in PWA burden for each patient (blue dot). At the individual patient level, there was a significant negative linear association between the change in AF burden and the change in PWA burden, from baseline to 6 months, with acute stimulation. Collectively, these data suggest that acute change in PWA at baseline may be used as a biomarker of response to chronic LLTS. N=14, because 2 active patients did not complete the 6‐month follow‐up. “*” denotes statistical significance of P<0.05. AF indicates atrial fibrillation; LLTS, low‐level tragus stimulation; and PWA, P‐wave alternans.
Discussion
With increasing life expectancy and greater burden of chronic medical conditions, AF has become increasingly prevalent in the population and remains a major source of morbidity and mortality because of limited, and often ineffective treatment options.1 Although LLTS has emerged as a promising new treatment modality, it remains hampered by the lack of a biomarker to guide patient selection and stimulation parameters. The major findings of this study are as follows: (1) chronic LLTS significantly lowers both PWA and AF burden in patients with paroxysmal AF; (2) LLTS modulates the level of PWA; acute LLTS causes an increase in PWA, while chronic LLTS leads to a decrease in PWA; and (3) PWA can serve as a marker of LLTS efficacy and guide its use in patients with AF; patients who show an early indicative increase in PWA burden because of acute LLTS demonstrate favorable effects of chronic LLTS treatment, highlighting the utility of PWA in identifying patients most likely to benefit from LLTS treatment.
The first trial that evaluated the effect of VNS in patients with heart failure, an open label, nonrandomized pilot trial, demonstrated that VNS resulted in significant improvement in functional class, quality of life, 6‐minute walk test, and left‐ventricular end‐systolic volume, in the absence of any major side effects.30 Despite these early promising results, 3 subsequent randomized trials of VNS in heart failure showed either neutral effects,31, 32 or only mild benefit.33 The rather disappointing results of these trials, despite the clear rationale for decreasing sympathovagal imbalance in heart failure, highlight the notion that optimizing patient selection and stimulation parameters are crucial to elucidate the possible patient‐specific favorable effects of VNS.34
In the current study, we observed that individual patient response to LLTS can vary greatly. While some active patients showed no observable response to chronic LLTS, in some patients a significant drop in PWA burden was observed. Additionally, response to acute and chronic LLTS was contradictory. Acute LLTS at baseline tended to increase the level of PWA in patients, yet, after 3 or 6 months of chronic LLTS, active patients showed a drop in alternans level with acute LLTS compared with control conditions (no stimulation). This is possibly indicative of chronic LLTS inducing positive changes in the atrial electrical substrate over time, making it more conducive to vagal stimulation and leading to a decrease in the overall level of alternans. Moreover, based on recent evidence that LLTS activates central vagal projections,35 we speculate that the effect of LLTS is because of, at least in part, favorable changes in the central nervous system.
In light of the limitations associated with currently available end points pertinent to the effectiveness of VNS in patients with AF, a major advancement in this field will be achieved by determining the impact of VNS on the underlying atrial substrate and autonomic tone, and defining better metrics of immediate and long‐term response.36 In this study, we hypothesized that AA is associated with the same myocardial substrate that gives rise to AF and that modification of the AA level could serve as a marker of successful LLTS. Development of tools that can be applied in real‐time to determine optimal LLTS parameters to sufficiently modify the atrial substrate is critical to improving the efficacy of this novel therapeutic modality. If validated, in future prospective studies a process to optimally select candidate patients for LLTS, based on a novel physiological biomarker, PWA, which reflects the arrhythmogenic potential of the underlying atrial substrate and its modulation by LLTS resulting in a reduction in AF burden,7, 37 could be a major improvement in the management of AF.
The effect of VNS is critically dependent on stimulation parameters.34, 36, 38 Since autonomic tone differs among individual patients, it is possible that there is no single, “optimal” set of stimulation parameters for all patients. In the present study, low‐level intermittent VNS was performed with stimulation strength restricted to 1 mA below an individual patient's discomfort threshold. This prevented any sudden adverse effects on heart rate in both active and sham patients because of parasympathetic overdrive, as was evident from the lack of any significant changes in both heart rate and RR interval in all patients (Figures S1 and S2). The absence of significant effects on heart rate variability measures with chronic parasympathetic stimulation can also be possibly attributed to the selection of low‐level intermittent VNS. However, since PWA is a substrate‐dependent phenomenon, its physiological mechanism differs from simple HR measures and hence, in the present study, both acute and chronic LLTS significantly modulated PWA. Therefore, upon further validation, PWA may serve as a biomarker to determine customized, optimal VNS parameters for each patient and thus optimally guide the management of AF.7, 37 Furthermore, the present study could also serve as evidence for selection criteria for a broader longitudinal study of VNS in patients with AF so as to improve study outcomes in appropriately selected participants. Selecting patients who are likely to benefit from LLTS based on an acute biomarker of response will improve the overall response to LLTS and will thus increase the cost‐effectiveness of this novel therapy for AF. This notion warrants further investigation in future randomized clinical trials.
Limitations
This study has several limitations. First, this was a proof‐of‐concept study with a limited number of patients. Therefore, further validation is required in larger studies. Second, future studies should include continuous monitoring of AF to allow a more accurate assessment of AF burden. Third, stimulation of the earlobe in the sham group may have resulted in some effect, which in turn would minimize the effect of active LLTS. However, previous studies have shown that stimulation of the earlobe, in contrast to stimulation of the tragus, does not result in activation of central vagal projections,35 and therefore is a reasonable sham control. Finally, although other methods of AA calculation are available, the method used in this study has been previously validated by our group.7, 37
Conclusions
Chronic, intermittent LLTS resulted in lower PWA and AF burden than did sham control stimulation. Our results support the notion that PWA can be used as a potential biomarker for guiding LLTS treatment of paroxysmal AF.
Sources of Funding
The work was supported by a NIH/NIGMS grant #8P20GM103447, American Heart Association (#15MCPRP2579000), Grand‐in‐Aid (#15GRNT23070001) from the American Heart Association (AHA), the Institute of Precision Medicine (17UNPG33840017) from the AHA, the RICBAC Foundation, NIH grant 1 R01 HL135335‐01, 1 R21 HL137870‐01 and 1 R21EB026164‐01. This work was conducted with support from Harvard Catalyst, The Harvard Clinical and Translational Science Center (National Center for Research Resources and the National Center for Advancing Translational Sciences, National Institutes of Health Award 8UL1TR000170‐05 and financial contributions from Harvard University and its affiliated academic healthcare centers). The content is solely the responsibility of the authors and does not necessarily represent the official views of Harvard Catalyst, Harvard University and its affiliated academic healthcare centers, or the National Institutes of Health.
Disclosures
None.
Supporting information
Data S1
Figures S1–S16
(J Am Heart Assoc. 2021;10:e020865. DOI: 10.1161/JAHA.120.020865.)
Supplementary Material for this article is available at https://www.ahajournals.org/doi/suppl/10.1161/JAHA.120.020865
For Sources of Funding and Disclosures, see page 8.
Contributor Information
Stavros Stavrakis, Email: Stavros-stavrakis@ouhsc.edu.
Antonis A. Armoundas, Email: armoundas.antonis@mgh.harvard.edu.
References
- 1.Le Heuzey JY, Paziaud O, Piot O, Said MA, Copie X, Lavergne T, Guize L. Cost of care distribution in atrial fibrillation patients: the COCAF study. Am Heart J. 2004;147:121–126. DOI: 10.1016/S0002-8703(03)00524-6. [DOI] [PubMed] [Google Scholar]
- 2.Miyasaka YBM, Bailey KR, Cha SS, Gersh BJ, Seward JB, Tsang TS. Mortality trends in patients diagnosed with first atrial fibrillation: a 21‐year community‐based study. J Am Coll Cardiol. 2007;49:986–992. DOI: 10.1016/j.jacc.2006.10.062 [DOI] [PubMed] [Google Scholar]
- 3.Stavrakis S, Nakagawa H, Po SS, Scherlag BJ, Lazzara R, Jackman WM. The role of the autonomic ganglia in atrial fibrillation. JACC Clin Electrophysiol. 2015;1:1–13. DOI: 10.1016/j.jacep.2015.01.005. [DOI] [PMC free article] [PubMed] [Google Scholar]
- 4.Sheng X, Scherlag BJ, Yu L, Li S, Ali R, Zhang Y, Fu G, Nakagawa H, Jackman WM, Lazzara R, et al. Prevention and reversal of atrial fibrillation inducibility and autonomic remodeling by low‐level vagosympathetic nerve stimulation. J Am Coll Cardiol. 2011;57:563–571. DOI: 10.1016/j.jacc.2010.09.034. [DOI] [PubMed] [Google Scholar]
- 5.Shen MJ, Shinohara T, Park H‐W, Frick K, Ice DS, Choi E‐K, Han S, Maruyama M, Sharma R, Shen C, et al. Continuous low‐level vagus nerve stimulation reduces stellate ganglion nerve activity and paroxysmal atrial tachyarrhythmias in ambulatory canines. Circulation. 2011;123:2204–2212. DOI: 10.1161/CIRCULATIONAHA.111.018028. [DOI] [PMC free article] [PubMed] [Google Scholar]
- 6.Stavrakis S, Humphrey MB, Scherlag BJ, Hu Y, Jackman WM, Nakagawa H, Lockwood D, Lazzara R, Po SS. Low‐level transcutaneous electrical vagus nerve stimulation suppresses atrial fibrillation. J Am Coll Cardiol. 2015;65:867–875. DOI: 10.1016/j.jacc.2014.12.026 [DOI] [PMC free article] [PubMed] [Google Scholar]
- 7.Stavrakis S, Stoner JA, Humphrey MB, Morris L, Filiberti A, Reynolds JC, Elkholey K, Javed I, Twidale N, Riha P, et al. TREAT AF (Transcutaneous Electrical Vagus Nerve Stimulation to Suppress Atrial Fibrillation): a randomized clinical trial. JACC Clin Electrophysiol. 2020;6:282–291. DOI: 10.1016/j.jacep.2019.11.008. [DOI] [PMC free article] [PubMed] [Google Scholar]
- 8.Chang KC, Bayer JD, Trayanova NA. Disrupted calcium release as a mechanism for atrial alternans associated with human atrial fibrillation. PLoS Comput Biol. 2014;10:e1004011. DOI: 10.1371/journal.pcbi.1004011. [DOI] [PMC free article] [PubMed] [Google Scholar]
- 9.Kanaporis G, Blatter LA. Alternans in atria: mechanisms and clinical relevance. Medicina. 2017;53:139–149. DOI: 10.1016/j.medici.2017.04.004. [DOI] [PMC free article] [PubMed] [Google Scholar]
- 10.Narayan SM, Franz MR, Clopton P, Pruvot EJ, Krummen DE. Repolarization alternans reveals vulnerability to human atrial fibrillation. Circulation. 2011;123:2922–2930. DOI: 10.1161/CIRCULATIONAHA.110.977827. [DOI] [PMC free article] [PubMed] [Google Scholar]
- 11.Kim B‐S, Kim Y‐H, Hwang G‐S, Pak H‐N, Lee SC, Shim WJ, Oh DJ, Ro YM. Action potential duration restitution kinetics in human atrial fibrillation. J Am Coll Cardiol. 2002;39:1329–1336. DOI: 10.1016/S0735-1097(02)01760-6. [DOI] [PubMed] [Google Scholar]
- 12.Lalani GG, Schricker AA, Clopton P, Krummen DE, Narayan SM. Frequency analysis of atrial action potential alternans: a sensitive clinical index of individual propensity to atrial fibrillation. Circ: Arrhythm Electrophysiol. 2013;6:859–867. DOI: 10.1161/CIRCEP.113.000204 [DOI] [PMC free article] [PubMed] [Google Scholar]
- 13.Holmqvist F, Platonov PG, McNitt S, Polonsky S, Carlson J, Zareba W, Moss AJ; Investigators MI . Abnormal P‐wave morphology is a predictor of atrial fibrillation development and cardiac death in MADIT II patients. Ann Noninvasive Electrocardiol. 2010;15:63–72. DOI: 10.1111/j.1542-474X.2009.00341.x. [DOI] [PMC free article] [PubMed] [Google Scholar]
- 14.Franz MR, Jamal SM, Narayan SM. The role of action potential alternans in the initiation of atrial fibrillation in humans: a review and future directions. Europace. 2012;14:v58–v64. DOI: 10.1093/europace/eus273. [DOI] [PMC free article] [PubMed] [Google Scholar]
- 15.Hiromoto K, Shimizu H, Furukawa Y, Kanemori T, Mine T, Masuyama T, Ohyanagi M. Discordant repolarization alternans‐induced atrial fibrillation is suppressed by verapamil. Circ J. 2005;69:1368–1373. DOI: 10.1253/circj.69.1368. [DOI] [PubMed] [Google Scholar]
- 16.Verrier RL, Fuller H, Justo F, Nearing BD, Rajamani S, Belardinelli L. Unmasking atrial repolarization to assess alternans, spatiotemporal heterogeneity, and susceptibility to atrial fibrillation. Heart Rhythm. 2016;13:953–961. DOI: 10.1016/j.hrthm.2015.11.019. [DOI] [PubMed] [Google Scholar]
- 17.Jousset F, Tenkorang J, Vesin JM, Pascale P, Ruchat P, Rollin AG, Fromer M, Narayan SM, Pruvot E. Kinetics of atrial repolarization alternans in a free‐behaving ovine model. J Cardiovasc Electrophysiol. 2012;23:1003–1012. DOI: 10.1111/j.1540-8167.2012.02336.x. [DOI] [PMC free article] [PubMed] [Google Scholar]
- 18.Peuker ET, Filler TJ. The nerve supply of the human auricle. Clin Anat. 2002;15:35–37. DOI: 10.1002/ca.1089. [DOI] [PubMed] [Google Scholar]
- 19.Merchant FM, Armoundas AA. Role of substrate and triggers in the genesis of cardiac alternans, from the myocyte to the whole heart: implications for therapy. Circulation. 2012;125:539–549. DOI: 10.1161/CIRCULATIONAHA.111.033563. [DOI] [PMC free article] [PubMed] [Google Scholar]
- 20.Merchant FM, Sayadi O, Puppala D, Moazzami K, Heller V, Armoundas AA. A translational approach to probe the proarrhythmic potential of cardiac alternans: a reversible overture to arrhythmogenesis? Am J Physiol Heart Circ Physiol. 2014;306:H465–H474. DOI: 10.1152/ajpheart.00639.2013. [DOI] [PMC free article] [PubMed] [Google Scholar]
- 21.Merchant FM, Zheng H, Bigger T, Steinman R, Ikeda T, Pedretti RF, Salerno‐Uriarte JA, Klersy C, Chan PS, Bartone C, et al. A combined anatomic and electrophysiologic substrate based approach for sudden cardiac death risk stratification. Am Heart J. 2013;166:744–752. DOI: 10.1016/j.ahj.2013.06.023. [DOI] [PMC free article] [PubMed] [Google Scholar]
- 22.Merchant FM, Sayadi O, Sohn K, Weiss EH, Puppala D, Doddamani R, Singh JP, Heist EK, Owen C, Kulkarni K, et al. Real‐time closed‐loop suppression of repolarization alternans reduces arrhythmia susceptibility in vivo. Circ Arrhythm Electrophysiol. 2020;13:e008186. DOI: 10.1161/CIRCEP.119.008186. [DOI] [PMC free article] [PubMed] [Google Scholar]
- 23.Merchant FM, Ikeda T, Pedretti RF, Salerno‐Uriarte JA, Chow T, Chan PS, Bartone C, Hohnloser SH, Cohen RJ, Armoundas AA. Clinical utility of microvolt T‐wave alternans testing in identifying patients at high or low risk of sudden cardiac death. Heart Rhythm. 2012;9:1256–1264.e2. DOI: 10.1016/j.hrthm.2012.03.014. [DOI] [PMC free article] [PubMed] [Google Scholar]
- 24.Merchant FM, Salerno‐Uriarte JA, Caravati F, Falcone S, Molon G, Marangoni D, Raczak G, Danilowicz‐Szymanowicz L, Pedretti RFE, Sarzi Braga S, et al. Prospective use of microvolt T‐wave alternans testing to guide primary prevention implantable cardioverter defibrillator therapy. Circ J. 2015;79:1912–1919. DOI: 10.1253/circj.CJ-15-0253. [DOI] [PubMed] [Google Scholar]
- 25.Sohn K, Dalvin SP, Merchant FM, Kulkarni K, Sana F, Abohashem S, Singh JP, Heist EK, Owen C, Isselbacher EM, et al. Utility of a smartphone based system (cvrPhone) to predict short‐term arrhythmia susceptibility. Sci Rep. 2019;9:1–11. DOI: 10.1038/s41598-019-50487-4. [DOI] [PMC free article] [PubMed] [Google Scholar]
- 26.Smith JM, Clancy EA, Valeri CR, Ruskin JN, Cohen RJ. Electrical alternans and cardiac electrical instability. Circulation. 1988;77:110–121. DOI: 10.1161/01.CIR.77.1.110. [DOI] [PubMed] [Google Scholar]
- 27.Sayadi O, Puppala D, Ishaque N, Doddamani R, Merchant FM, Barrett C, Singh JP, Heist EK, Mela T, Martínez JP, et al. A novel method to capture the onset of dynamic electrocardiographic ischemic changes and its implications to arrhythmia susceptibility. J Am Heart Assoc. 2014;3:e001055. DOI: 10.1161/JAHA.114.001055. [DOI] [PMC free article] [PubMed] [Google Scholar]
- 28.Goldberger AL. Is the normal heartbeat chaotic or homeostatic? News Physiol Sci. 1991;6:87–91. DOI: 10.1152/physiologyonline.1991.6.2.87. [DOI] [PubMed] [Google Scholar]
- 29.Tsuji H, Larson MG, Venditti FJ Jr, Manders ES, Evans JC, Feldman CL, Levy D. Impact of reduced heart rate variability on risk for cardiac events. The Framingham Heart Study. Circulation. 1996;94:2850–2855. DOI: 10.1161/01.CIR.94.11.2850. [DOI] [PubMed] [Google Scholar]
- 30.De Ferrari GM, Crijns HJ, Borggrefe M, Milasinovic G, Smid J, Zabel M, Gavazzi A, Sanzo A, Dennert R, Kuschyk J, et al.; CardioFit Multicenter Trial I . Chronic vagus nerve stimulation: a new and promising therapeutic approach for chronic heart failure. Eur Heart J. 2011;32:847–855. DOI: 10.1093/eurheartj/ehq391. [DOI] [PubMed] [Google Scholar]
- 31.Gold MR, Van Veldhuisen DJ, Hauptman PJ, Borggrefe M, Kubo SH, Lieberman RA, Milasinovic G, Berman BJ, Djordjevic S, Neelagaru S, et al. Vagus nerve stimulation for the treatment of heart failure: the INOVATE‐HF trial. J Am Coll Cardiol. 2016;68:149–158. DOI: 10.1016/j.jacc.2016.03.525. [DOI] [PubMed] [Google Scholar]
- 32.Zannad F, De Ferrari GM, Tuinenburg AE, Wright D, Brugada J, Butter C, Klein H, Stolen C, Meyer S, Stein KM, et al. Chronic vagal stimulation for the treatment of low ejection fraction heart failure: results of the NEural Cardiac TherApy foR Heart Failure (NECTAR‐HF) randomized controlled trial. Eur Heart J. 2015;36:425–433. DOI: 10.1093/eurheartj/ehu345. [DOI] [PMC free article] [PubMed] [Google Scholar]
- 33.Premchand RK, Sharma K, Mittal S, Monteiro R, Dixit S, Libbus I, DiCarlo LA, Ardell JL, Rector TS, Amurthur B, et al. Autonomic regulation therapy via left or right cervical vagus nerve stimulation in patients with chronic heart failure: results of the ANTHEM‐HF trial. J Card Fail. 2014;20:808–816. DOI: 10.1016/j.cardfail.2014.08.009. [DOI] [PubMed] [Google Scholar]
- 34.Byku M, Mann DL. Neuromodulation of the failing heart: lost in translation? JACC Basic Transl Sci. 2016;1:95–106. DOI: 10.1016/j.jacbts.2016.03.004. [DOI] [PMC free article] [PubMed] [Google Scholar]
- 35.Frangos E, Ellrich J, Komisaruk BR. Non‐invasive access to the vagus nerve central projections via electrical stimulation of the external ear: fMRI evidence in humans. Brain Stimul. 2015;8:624–636. DOI: 10.1016/j.brs.2014.11.018. [DOI] [PMC free article] [PubMed] [Google Scholar]
- 36.Qin D, Singh JP. Low‐level tragus stimulation for atrial fibrillation: a glimpse of hope for neuromodulation? JACC Clin Electrophysiol. 2020;6:292–294. DOI: 10.1016/j.jacep.2020.01.003. [DOI] [PubMed] [Google Scholar]
- 37.Stavrakis S, Kulkarni K, Singh JP, Katritsis DG, Armoundas AA. Autonomic modulation of cardiac arrhythmias: methods to assess treatment and outcomes. JACC Clin Electrophysiol. 2020;6:467–483. DOI: 10.1016/j.jacep.2020.02.014. [DOI] [PMC free article] [PubMed] [Google Scholar]
- 38.Ardell JL, Nier H, Hammer M, Southerland EM, Ardell CL, Beaumont E, KenKnight BH, Armour JA. Defining the neural fulcrum for chronic vagus nerve stimulation: implications for integrated cardiac control. J Physiol. 2017;595:6887–6903. DOI: 10.1113/JP274678. [DOI] [PMC free article] [PubMed] [Google Scholar]
Associated Data
This section collects any data citations, data availability statements, or supplementary materials included in this article.
Supplementary Materials
Data S1
Figures S1–S16