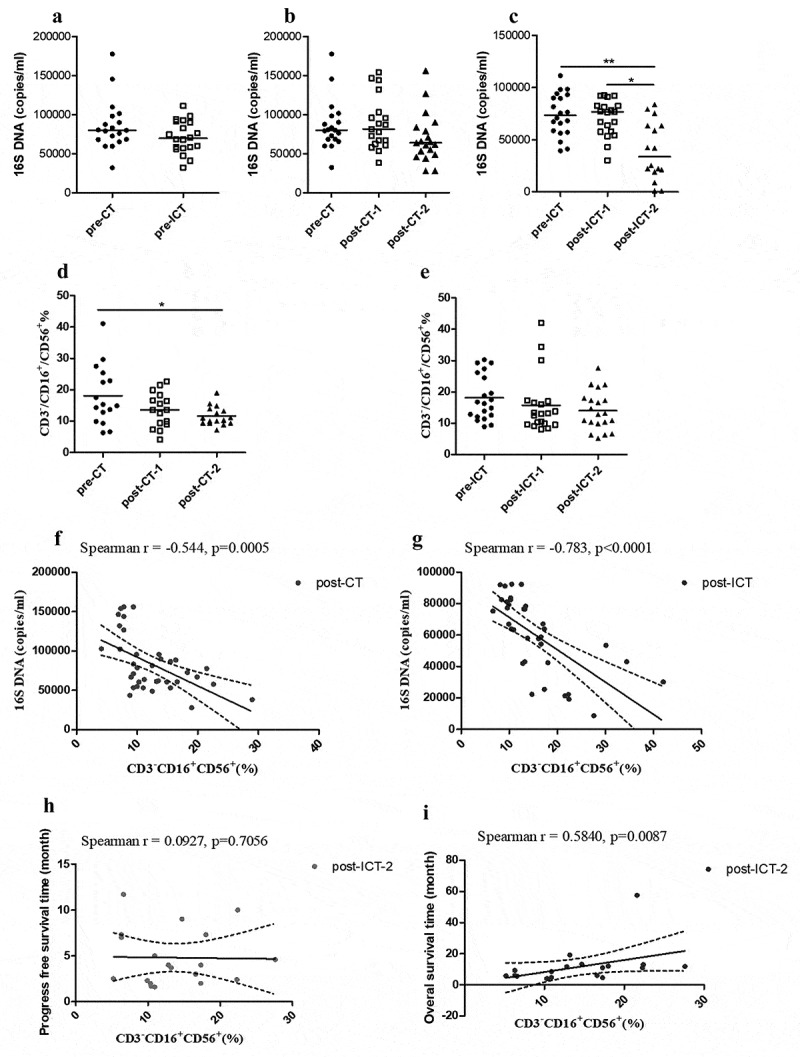
Figure 3.

The bacterial DNA quantity of plasma was reduced by therapy in the ICT group. Bacterial 16S DNA baseline in pre-CT (n = 19) and pre-ICT (n = 20) samples (a). Comparison of plasma quantities of bacterial 16S DNA in paired pre-therapy and post-therapy CT and ICT patients (b, c) (post-CT-2: n = 18; post-ICT-2: n = 16). Median for 16S DNA copies is indicated per each group. Comparison of CD3−/CD16+/CD56+ T-cell proportion in peripheral blood before and after 2 cycle of therapy (d, e). Median for proportion of CD3−/CD16+/CD56+ cells is indicated per each group. Spearman’s correlation analysis on proportion of CD3−/CD16+/CD56+ cells and bacterial 16S DNA copy numbers (f, g), Spearman’s correlation analysis on proportion of post-ICT-2 CD3−/CD16+/CD56+ cells and PFS (h) and OS (i), displaying linear fit curve (solid line) and 95% CI (dashed line). (*p < .05, **p < .01 and ***p < .001). CT, chemotherapy; ICT, Immunotherapy combined with chemotherapy; pre-, before therapy; post-, after therapy; post-therapy-1, after 1 cycle of treatment; post-therapy-2, after 2 cycle of treatment
