

Abstract
Background
Day‐to‐day variability impacts safety of insulin therapy and the choice of monitoring strategies. Side‐by‐side comparisons of insulin formulations in diabetic dogs are scarce.
Hypothesis/Objectives
Insulin glargine 300 U/mL (IGla300) and insulin degludec (IDeg) are associated with less day‐to‐day glucose variability compared to porcine lente (PL) in diabetic dogs.
Animals
Seven intact male purpose‐bred beagles with toxin‐induced diabetes.
Methods
In this repeated measured study, PL, IGla300 and IDeg were compared in 2 phases: once‐daily (q24h) and twice‐daily (q12h) administration. Interstitial glucose concentrations (IG) were measured continuously throughout the study. For each formulation, maximal q24h dose was determined using the same algorithm (while avoiding hypoglycemia) and then maintained for 72 hours. In phase 2, 70% of the maximal q24h dose was administered q12h and maintained for 5 days regardless of hypoglycemia. Coefficient of variation (CV) and glycemic variability percentage (GVP) were calculated to determine day‐to‐day and intraday variability, respectively.
Results
There was no difference in day‐to‐day variability between PL, IGla300, and IDeg in the q24h phase. In the q12h phase, day‐to‐day variability was higher (P = .01) for PL (CV = 42.6 ± 6.8%) compared to IGla300 and IDeg (CV = 30.1 ± 7.7%, 25.2 ± 7.0%, respectively). The GVP of PL was lower (P = .02) compared to IGla300. There was no difference between PL, IGla300 and IDeg in %time IG < 70 mg/dL.
Conclusions and Clinical Importance
Insulin degludec and IGla300 administered q12h were associated with lower day‐to‐day variability, which might be advantageous in minimizing monitoring requirements without increasing the risk of hypoglycemia.
Keywords: basal insulin, diabetes mellitus, glycemic variability, hypoglycemia
Abbreviations
- CI
confidence interval
- CV
coefficient of variation %
- DM
diabetes mellitus
- FGMS
flash glucose monitoring system
- GV
glycemic variability
- GVP
glycemic variability percentage
- IDeg
insulin degludec
- IG
interstitial glucose concentrations
- IGla300
insulin glargine 300 U/mL
- PL
porcine lente
- q12h
twice daily
- q24h
once daily
1. INTRODUCTION
Diabetes mellitus (DM) is a common endocrinopathy affecting approximately 0.3% to 0.6% of the canine population.1, 2 Diabetic dogs require life‐saving exogenous insulin; however, this therapy can be onerous to pets and their owners. In part, this is due to inconsistent and insufficient duration of action of commonly used insulin formulations, requiring more than 1 injection per day and careful monitoring. In the past 20 years, human diabetology has shifted to using recombinant insulin solutions that utilize structurally modified insulin to meet specific pharmacodynamic needs. Basal insulin formulation is designed to remain in solution ex vivo, achieve long duration with a peakless profile (ie, minimal intraday variability) and have minimal day‐to‐day variability.3 Low day‐to‐day variability is crucial in minimizing the frequency of hypoglycemic events.3
Few studies have looked at the day‐to‐day variability of insulin in dogs. In 1 study, substantial day‐to‐day variability was demonstrated for porcine lente (PL) in diabetic dogs, affecting clinicians' ability to safely make dose‐adjustment recommendations based on serial glucose measurements.4 Crystalline insulin suspensions such as PL are associated with inherent day‐to‐day variability because the process of resuspension is often inconsistent, leading to inaccurate dosing and because of inconsistent breakdown of crystals of variable‐size and shape in the SC depot.3, 5
Insulin glargine 300 U/mL (IGla300) is a recombinant‐human insulin analog in which 2 arginine residues are added to position B30.3 This allows glargine to remain in solution at a pH of 4.0 (as supplied) and form stable hexamers in neutral pH when injected into the subcutaneous space. Recent studies in people have shown longer duration, reduced day‐to‐day variability and lower frequency of hypoglycemia for IGla300 compared with insulin glargine 100 U/mL.6, 7, 8, 9, 10 In dogs, IGla300 had a relatively prolonged and peakless time‐action profile; however, interinjection variability was not assessed.11
Insulin degludec (IDeg) is a recombinant‐human insulin analog formed by replacing the amino‐acid at the B30 position with hexadecandioic acid. It forms stable di‐hexamers in solution with phenol and zinc but generates soluble multihexamers after subcutaneous injection.12 The dissociation of these multihexamers into monomers is slow and consistent, which helps reduce intra‐ and interday variability.13 In people, IDeg reaches steady‐state concentrations after a few days of once‐daily injections and can then be administered safely on a “flexible schedule,” without compromising glycemic control.3 In dogs, IDeg was demonstrated to have a peakless time action profile with a duration of action greater than 20 hours.12
Side‐by‐side comparisons of insulin formulations in dogs are scarce, despite considerable intersubject variability.11, 14, 15, 16, 17 The primary objective of this study was to compare side‐by‐side the day‐to‐day variability of 3 insulin formulations: PL, IGla300, and IDeg. We hypothesized that IGla300 and IDeg will be associated with less day‐to‐day glucose variability compared to PL in diabetic dogs. Our secondary objective was to compare other measures of glycemic controls such as mean glucose, frequency of low IG and intraday variability between these formulations.
2. MATERIALS AND METHODS
2.1. General husbandry
Seven purpose‐bred intact male beagles with streptozotocin‐alloxan‐induced diabetes were included in this study. Induction of DM was achieved as previously described18 at another institution as part of a different study which was approved by the institution's ethical committee. Three months after completion of the study at the other institution, dogs were transferred to the University of California, Davis. All procedures performed at the University of California, Davis on these dogs were approved by the Institutional Animal Care and Use Committee (IACUC protocol # 20539). Dogs were housed individually in a facility approved by AALAC (Assessment and Accreditation of Laboratory Animal Care) with free access to drinking water and supervised access to outdoor play pens. Prior to the study, dogs were treated with PL. During the study, dogs were treated with the 3 study insulin formulations with no other intervention other than routine healthcare preventatives including anthelmintic medications and standard antiviral vaccines; no antibiotics were administered. Dogs were monitored daily, and body weight and general health assessment were performed weekly. All dogs maintained their body weight and ideal body condition score with no clinical evidence of disease other than DM throughout the 5‐month study.
At time of enrolment into the study, all 7 dogs underwent a physical examination, CBC, serum biochemical profile and urinalysis and were deemed healthy except for having diabetes mellitus.
2.2. Feeding and insulin regimens
The study was divided into 2 phases: once‐daily (q24h) insulin study and the twice‐daily (q12h) insulin study. Throughout each phase, each dog received a single diet exclusively, with no change in timing and amount. However, the type of food changed between the q24h phase and q12h phase. In the q24h phase, each dog was fed either Adult Purina Chow (Complete Adult Dry Dog Food with Real Chicken, Nestlé Purina Petcare Company, St. Louis, Missouri) or Purina Puppy Chow (Complete Dry Puppy Food with Real Chicken and Rice, Nestlé Purina Petcare Company, St. Louis, Missouri) twice daily (75 g at 0700 and 225 g at 2000). In the q12h phase, all dogs were fed the same commercial laboratory adult dry dog food (diet item #15006 Lab Diet Caine MFG #5006), with quantities divided equally between 2 meals (150 g at 0700 and 150 g at 2000).
The q24h phase was performed first. Each dog received the 3 formulations in the following order: PL, IGla300 and IDeg. Each insulin was started at 0.4 U/kg (rounded up to the nearest unit), administered SC, q24h, at 2000 hours. The insulin dose was escalated every 72 hours until maximum dose was achieved (maintenance dose). Dose escalation was based on a predetermined protocol (Figure 1) that was followed for all dogs and for all 3 insulin formulations. In this protocol, as long as IG was >70 mg/dL, the dose was kept the same for 72 hours and then increased based on the nadir during the 72‐hour period as shown in Figure 1. If IG was <70 mg/dL at any point during the 72‐hour period, the dose was decreased, restarting a new 72‐hour period. Doses were rounded up to the nearest unit. The maintenance dose was determined as the maximal dose not associated with IG < 70 mg/dL over a 72‐hour period. Once the dose could not be increased further (because of IG < 70 mg/dL) and a 72‐hour period was completed, the dog was switched to the next insulin formulation.
FIGURE 1.

Insulin dose changing protocol during phase 1, once‐daily insulin therapy. Insulin dose was escalated until further increases could not be made due to IG < 70 mg/dL
After completion of the q24h phase, dogs were switched to the q12h phase. Each dog received 70% of the maintenance q24h insulin dose (rounded up to the nearest unit), q12h, for a total of 140% of the daily phase 1 maintenance dose. Treatment sequence was identical for all dogs (IGla300, IDeg, and PL). On the first day of each new insulin, the dogs received only the evening dose of the new insulin (to allow the previous insulin formulation to wash off). The dose was then maintained for an additional 6 days, regardless of hypoglycemic events. Data from the first day of each insulin formulation was not used for analysis.
2.3. Glucose monitoring
A flash glucose monitoring system (FGMS; FreeStyle Libre 14 day system, Abbott) previously validated for use in dogs was used throughout the study as previously described,19 recording interstitial glucose concentrations (IG) every 15 minutes. Data were retrieved from the sensor by scanning it with the FreeStyle Libre handheld reader 4 times daily (0700, 1500, 2000, 2300). Data were data uploaded to the LibreView website every 24 hours. The FGMS sensor has a range of 40‐500 mg/dL. The FGMS sensor was first applied 2 weeks prior to the initiation of the study, to allow the dogs to acclimate. After that, for the duration of the study, new sensors were applied immediately when older sensors expired, malfunctioned, or fell off.
2.4. Statistics
Statistical analysis was performed using commercially available computer software (GraphPad Prism; GraphPad Software Inc, La Jolla, California). Based on the Shapiro‐Wilk test and Kolmogorov‐Smirnov test, parametric and nonparametric analyses were applied as appropriate. Significance was set at P ≤ .05.
Descriptive statistics of normally distributed data are presented as mean ± SD (95% confidence interval [CI] of the mean; coefficient of variation % [CV]). Otherwise, data are presented as median (range). A 1‐way repeated measures ANOVA and Tukey's multiple comparison test was used to compare mean IG of maintenance dose between formulations. All data <40 mg/dL were assigned values of 40 mg/dL and all data >500 mg/dL were assigned values of 500 mg/dL.
To assess day‐to‐day variability, the CV (CV = SD/mean) was calculated across treatment days for each of the 96 time points of a 24‐hour period (CV15, every 15 minutes; 4 per hour ×24) for each dog and for each insulin. In the q24h phase, the CV15 was calculated for the 72 hours on the maintenance dose (with the mean and SD per time point across the 3 days). In the q12h phase, CV15 was calculated similarly but across 5 days of treatment. For each phase, the 96 CV15 values were averaged to calculate the mean CV for each dog (CV24) and then the mean of CV24 across dogs was compared between insulin formulations with a 1‐way repeated measures ANOVA and Tukey's multiple comparison test. For all CV calculations, data was censored to the FGMS range of 40‐500 mg/dL, to reduce variability bias.
To investigate overall glycemic variability, the glycemic variability (GV) percentage (GVP) was calculated for each insulin for each dog in both the q24h and q12h phases, using a macro in Excel as previously described.20 The GVP is a measurement of the total length of the continuous glucose monitoring data compared to the theoretical straight line that represent zero variability. The GVP can be determined using the Pythagorean theorem to summate all n line segments normalized over a time interval.20 It is calculated independently of CV and SD and it is a more comprehensive measure of variability that captures fluctuations in both the amplitude and frequency and therefore captures intraday variability. IG > 400 was censored for all GVP calculations.
Freidman test and Dunn's multiple comparison test were performed to compare frequencies of hypoglycemic events between insulin formulations during the q12h phase.
3. RESULTS
Seven intact 1.5‐year‐old Beagle dogs were included in this study. Dogs weighed 9.2 ± 1.6 kg at the beginning of the study with a median body condition score of 5 (range, 4‐6).
In the q24h phase, mean (±SD) number of days to achieve maintenance dose was longer for PL (P = .0005) but did not differ between IGla300 and IDeg (23.1 ± 6.3, 10.8 ± 4.8, 10.9 ± 4.1, respectively). Similarly, the number of dose changes prior to achieving maintenance dose was higher for PL (P = .001) but did not differ between IGla300 and IDeg (7.9 ± 1.8, 4.1 ± 1.1, 4.6 ± 1.6, respectively). The mean maintenance insulin dose was 1.3 ± 0.40 U/kg (0.9‐2.1 U/kg) for PL, 0.6 ± 0.31 U/kg (0.2‐0.9 U/kg) for IGla300, and 0.7 ± 0.16 U/kg (0.4‐0.9 U/kg) for IDeg. The mean 72‐hour IG of PL (335.4 ± 49.2 mg/dL) was lower than that of IGlar300 (395.8 ± 45.5 mg/dL; P = .04), but not different than that of IDeg (361.0 ± 23.8 mg/dL; P = .33, Figure 2). There was no difference in day‐to‐day variability between PL, IGla300 and IDeg (mean CV24 = 20 ± 7.5%, 20.7 ± 8.6% and 20.7 ± 10.6% respectively, P = .99, Figure 3). The GVP for IDeg (193.6 ± 34.4%) was lower compared to PL (273.7 ± 75.4%, P = .04) and IGla300 (252.3 ± 39%, P = .007), with no difference between PL and IGla300 (P = .5).
FIGURE 2.
Scatter plot of mean interstitial glucose (IG) over 3 days of once‐daily insulin therapy consisting of porcine lente (PL), insulin glargine 300 U/mL (IGla300) and insulin degludec (IDeg) in 7 purpose bred dogs. Horizontal line represents the mean of the 7 dogs. The means of the 3 treatment groups were compared with repeated measured ANOVA. P ≤ .05 was considered significant
FIGURE 3.

Scatter plot of mean coefficient of variation % (CV) over 3 days of once‐daily insulin therapy consisting of porcine lente (PL), insulin glargine 300 U/mL (IGla300) and insulin degludec (IDeg) in 7 purpose bred dogs. Horizontal line represents the mean CV of the 7 dogs. The means of the 3 treatment groups were compared with 1‐way repeated measured ANOVA. P ≤ .05 was considered significant
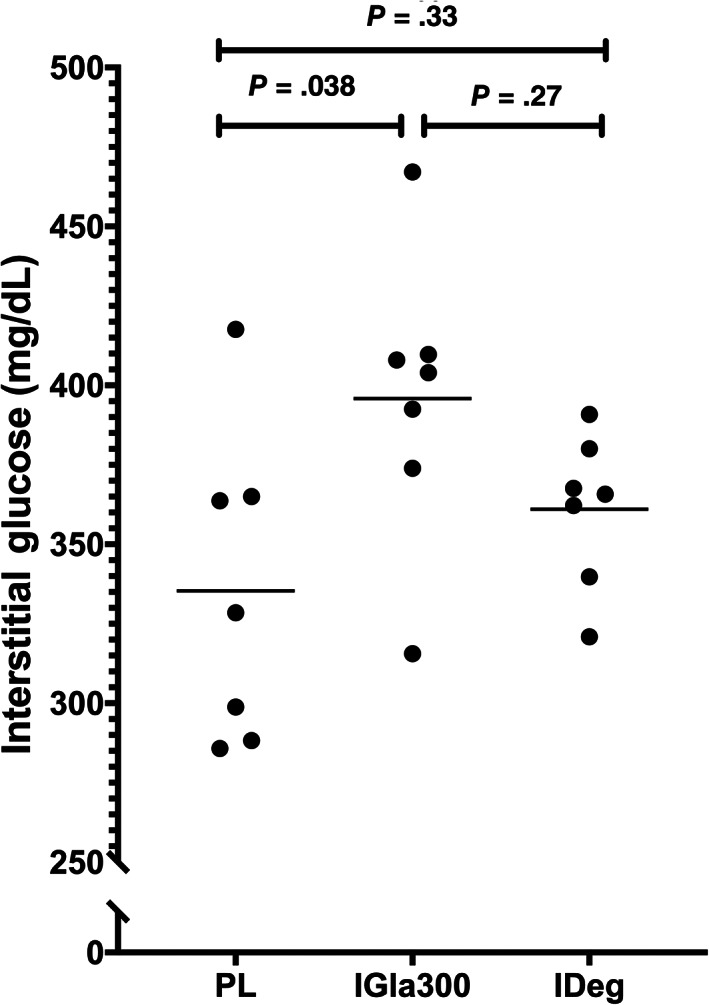
In the q12h phase, the mean insulin dose was 0.8 ± 0.26 U/kg (range, 0.5‐1.3 U/kg) for PL, 0.5 ± 0.2 U/kg (range, 0.2‐0.9 U/kg) for IGla300, and 0.5 ± 0.09 U/kg (range, 0.3‐0.6 U/kg) for IDeg. The mean 5‐day IG of PL (194.5 ± 55.1 mg/dL) was lower than the mean 5‐day IG of IGla300 (275.5 ± 40.4 mg/dL, P = .006) and IDeg (265 ± 69.3 mg/dL, P = .05) and there was no difference between IGla300 and IDeg (P = .9, Figure 4). There was no difference between PL, IGla300 and IDeg in the % time IG was <70 mg/dL (17 ± 13.2%, 11 ± 8.5%, 9 ± 8.7%, respectively; P = .2, Figure 5). The day‐to‐day variability of PL (42.6 ± 6.8%) was higher compared to IGla300 (30.1 ± 7.7%, P = .01) and IDeg (25.2 ± 7.0%, P = .01), with no difference between IGla300 and IDeg (P = .46, Figures 6 and 7). The GVP for PL (192.5% ± 45.1%) was lower compared to IGla300 (237.0 ± 20.6%, P = .02); however, it was not different to IDeg (215.5 ± 36.3%, P = .26). There was no difference between the GVP of IGla300 and IDeg (P = .13, Figure 8).
FIGURE 4.

Scatter plot of mean interstitial glucose (IG) over 5 days of twice‐daily insulin therapy consisting of porcine lente (PL), insulin glargine 300 U/mL (IGla300) and insulin degludec (IDeg) in 7 purpose bred dogs. Horizontal line represents the mean of the 7 dogs. The means of the 3 treatment groups were compared with repeated measured ANOVA. P ≤ .05 was considered significant
FIGURE 5.
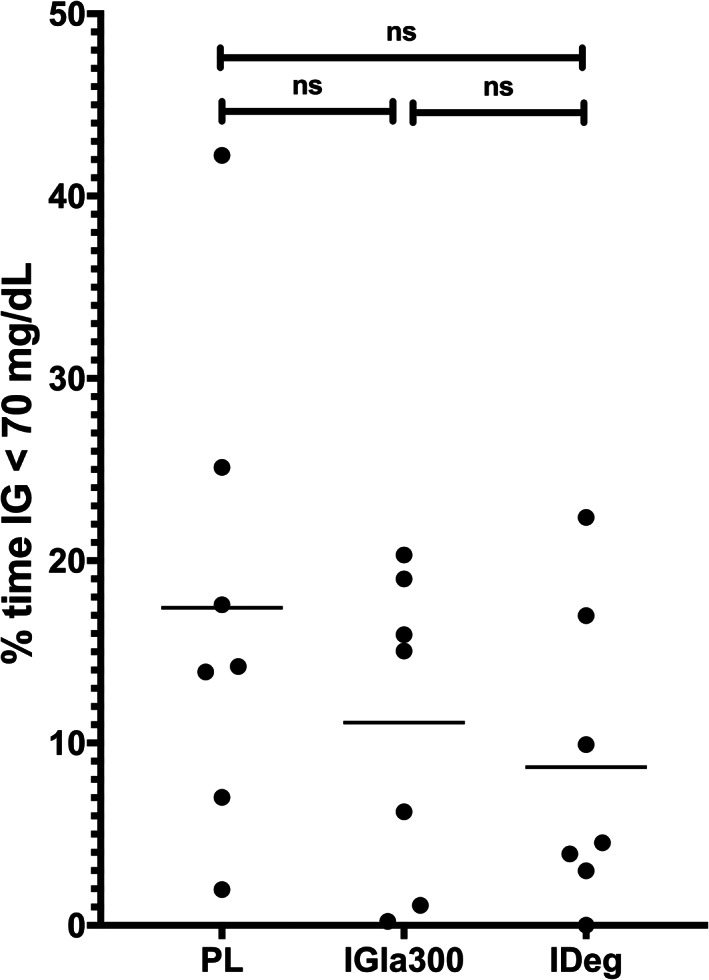
Scatter plot of percent of time the interstitial glucose (IG) was less than 70 mg/dL over 5 days of twice‐daily insulin therapy, porcine lente (PL), insulin glargine 300 U/mL (IGla300) and insulin degludec (IDeg) in 7 purpose bred dogs. Horizontal line represents the mean percent time for the 7 dogs. Freidman test and Dunn's multiple comparison test were used to compare frequencies of hypoglycemic events. P ≤ .05 was considered significant. ns = not significant
FIGURE 6.

Scatter plot of mean coefficient of variation % (CV) over 5 days of twice‐daily insulin therapy consisting of porcine lente (PL), insulin glargine 300 U/mL (IGla300) and insulin degludec (IDeg) in 7 purpose bred dogs. Horizontal line represents the mean CV of the 7 dogs. The means of the 3 treatment groups were compared with 1‐way repeated measured ANOVA. P ≤ .05 was considered significant
FIGURE 7.

A‐G, Continuous interstitial glucose (IG) curve over a 24‐hour period with twice daily insulin therapy. Food and insulin were given at time 0 and 660 minutes. Each panel of 3 graphs represents 1 dog. For each dog (A‐G), upper panel = porcine lente (PL), middle panel = insulin glargine 300 U/mL (IGla300), and lower panel = insulin degludec (IDeg)
FIGURE 8.
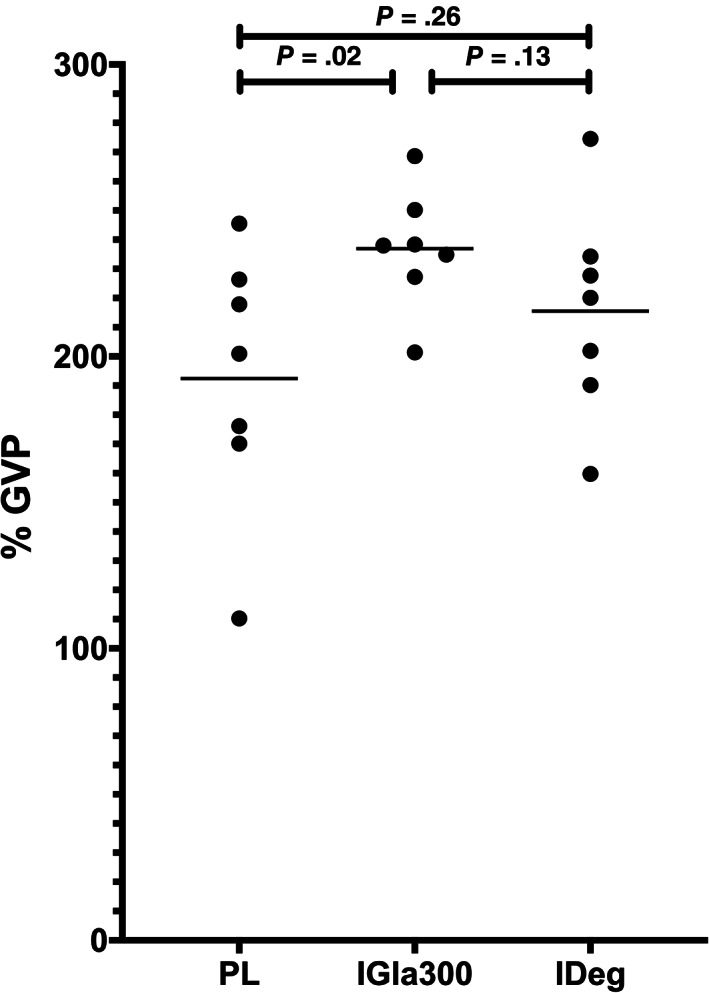
Scatter plot of the mean glycemic variability percentage (GVP) over the 5 days of twice‐daily insulin therapy consisting of porcine lente (PL), insulin glargine 300 U/mL (IGla300) and insulin degludec (IDeg) in 7 purpose bred dogs. Horizontal line represents the mean GVP of the 7 dogs. The means of the 3 treatment groups were compared with 1‐way repeated measured ANOVA. P ≤ .05 was considered significant
4. DISCUSSION
In this repeated measure study comparing the day‐to‐day variability of PL, IGla300 and IDeg in diabetic dogs we found that IGla300 and IDeg maintain lower day‐to‐day variability compared to PL when administered twice daily. Our data were generated in controlled laboratory settings where feeding, drug administration and exercise schedules are unchanged and completely comparable between insulin formulations. It is likely that for all 3 insulin formulations, the degree of variability in glucose data would be greater in the clinical setting in which these variables are controlled (or not) by owners.
Low day‐to‐day variability enables the clinician to make safer treatment decisions, especially when limited data are available. Previous studies demonstrated significant within‐ and between‐subject variability for PL but did not compare PL to other insulin formulations.4, 17 When evaluating the clinical consequences of large day‐to‐day variability of PL, 1 study showed that obtaining a glucose curve during a single day might not be representative of the range of possible responses to that insulin at that dose on other days, and might lead to erroneous treatment decisions.4 Therefore, for a formulation with high day‐to‐day variability, recording glucose data from at least a few days would be necessary to safely make treatment recommendations. In contrast, if using a hypothetical insulin formulation with zero day‐to‐day variability, and assuming all other variables are maintained constant, a glucose curve that is generated on a single day would be representative of all glucose curves generated on any other day, obviating the need for more data. From this perspective, IGla300 and IDeg are advantageous to the clinician in that they might allow safer decision making based on fewer data points compared to PL. It is also likely that IDeg and IGla300 would be associated in the long run with lower risk of hypoglycemia because of lower risk of large deviations in peak insulin activity from average peak activity. While there was no difference in frequency of hypoglycemia between formulations in our study, this does not necessarily reflect on long‐term risk of hypoglycemia in the clinical setting, especially when attempting to achieve lower mean glucose and when other factors like diet and exercise are modified.
Glycemic variability is a measure of intraday oscillations in glycemia. In human medicine, increased GV is used as a predictor of future hypoglycemic events, 21, 22, 23 but to the best of our knowledge, has not been studied in dogs. However, because the mechanisms leading to impaired counterregulatory responses in dogs are largely the same as in people,24 it would be reasonable to hypothesize that as in people, increased GV in dogs would also lead to increased frequency of hypoglycemia in the long run.
Here we show that the choice of insulin formulation might affect GV. In the q24h phase of the study, IDeg was associated with the lowest GVP while in the q12h phase, PL was associated with the lowest GVP. These results might reflect the fact that in terms of minimizing intraday oscillations, there is an advantage to increasing the frequency of feedings and insulin administration when using an insulin that peaks within a few hours after administration (like PL17), coinciding with post prandial absorption of carbohydrates. In contrast, there is no advantage to increasing the frequency when using a true basal insulin that roughly exerts the same action evenly throughout a 24 hours period after a single injection (eg, IDeg12). In fact, because a basal insulin does not curb post‐prandial hyperglycemia, splitting the daily food intake into 2 equal meals while using a basal insulin is expected to result in 2 major hyperglycemic excursions as seen in our data. Our study was not designed to address this problem specifically but in the clinical setting, this could be addressed by feeding a diet with lower glycemic index or feeding smaller amounts more frequently.25 Of note, this fine tuning of diet type and frequency would be more feasible in a patient that has predictable responses, that is, treated with an insulin formulation with lower day‐to‐day variability.
In the q24h phase of our study, insulin doses were adjusted to maximally lower the average IG while avoiding low IG as much as possible. In this setting, all 3 formulations failed to decrease mean IG to acceptable levels. During this phase, the 3 lowest mean 3‐day IG were observed with PL (286, 288, and 299 mg/dL) with all other 3‐day averages in the PL as well as all IDeg and IGla300 treatments remaining above 300 mg/dL. In a clinical setting, this would probably translate into unacceptable clinical control of polyuria, leading to treatment failure with all 3 insulin formulations when used q24h. Better control might have been achieved in our study if we had used a different algorithm for dose alterations, with lower cutoffs to trigger dose reduction. To the best of our knowledge, the blood glucose cutoffs used in clinical practice to guide insulin therapy rely on clinical experience and expert opinion, and not on evidence from well‐powered clinical trials. These cutoffs were established at a time when large safety margins were necessary because glucose monitoring was intermittent at best, and available formulations were relatively unpredictable.26 Moreover, the translation of these cutoffs from blood glucose concentrations to IG concentrations has not been studied yet in dogs. While the FGMS used in our study has been validated for use in dogs and its accuracy has been demonstrated, the system does report low IG with bias toward overestimating the magnitude of hypoglycemia.19 Thus, we chose IG <70 mg/dL as a trigger for reducing insulin dose, following the traditional cutoff of blood glucose <80 mg/dL.26 With the advent of more predictable formulations such as IDeg and IGla300 and affordable FGMS, target glucose concentrations should be reconsidered, studied and reestablished in future clinical research.
Three different diets were fed during the duration of this study, although the diets remained constant for each dog in each of the study phases. The macronutrients of each diet are as follows: Adult Purina Chowa (protein 21%, fat 10%, carbohydrates 49%), Purina Puppy Chowb (protein 27.5%, fat 12%, carbohydrates 40.5%), and the Lab Diet Caine MFG #5006c (protein 25%, fat 19.5%, carbohydrates 37.5%). The differences between the macronutrients of the 3 diets may explain some of the variability between the q24h phase and the q12h phase, as the dogs received a different diet between the 2 phases.
Low day‐to‐day variability is an inherent characteristic of an insulin formulation, that is direct result of its chemistry. For example, formulations that stay in solution and do not require resuspension and formulations that do not precipitate after injection have lower day‐to‐day variability.5 In contrast, changes in mean IG depend more on changes in insulin dose. In the q12h phase of this study, although IGla300 and IDeg were superior in terms of day‐to‐day variability, PL treatment led to a lower mean IG. However, in this phase the dose of insulin was fixed, previously determined by the q24h maximum dose. For all 3 formulations, the total daily insulin dose was increased from the q24h phase by 40% which resulted in lower mean IG across all treatments. Therefore, it is reasonable to assume that had we increased the dose of IDeg and IGla300 further, we would have achieved lower mean IG, without losing their advantage as more predictable formulations.
When administered to the SC, IGla300 shows reduced blood glucose lowering effects compared to insulin glargine 100 U/mL and other insulin formulations, both in clinical trials and in euglycemic‐clamp studies in people and in dogs.11, 27 It was recently demonstrated in dogs that this is caused by longer residence time of the insulin in the SC, allowing it more time to be exposed to local degrading enzymes and resulting in lower bioavailability.27 As such, clinical use of IGla300 in dogs would require higher doses compared to other formulations. This was not demonstrated in our study, in which maintenance dose of IGla300 and IDeg were similar and lower compared to PL. This discrepancy might be the result of the protocol we used for dose adjustments in this study; a protocol that is based on traditional monitoring recommendation for intermediate‐acting insulin formulations.28 Plausibly, appropriate clinical use of these basal insulin formulations in combination with “prandial” insulin formulations would result not only in better glycemic control but also in different maintenance doses.
We expected lower day‐to‐day variability for IDeg and IGla300 compared to PL and indeed confirmed it in the q12h phase but not in the q24h phase. One potential explanation for that is that the between‐day CV was calculated based only on 3 days of data (vs. 5 days in the q12h phase), decreasing our ability to detect differences. Also, insulin dose was changed more frequently in the q24h phase (up to 3 days but sometimes less if low IG was recorded). In this setting, the comparison of variability between days is biased against long‐acting insulin formulations that might not reach steady‐state as fast. GVP was lower for IDeg in the q24h phase, suggesting at least lower intraday variability, consistent with its reported time action profile.12
Purpose‐bred dogs were used over dogs with spontaneous DM to aliveate both ethical concerns and reduce bias in assessing day‐to‐day variability of different insulins. In the study, insulin doses and formulations had to be switched irrespective of glycemic control. It was unacceptable to make these frequent changes without a clinical benefit in an otherwise stable client‐owned diabetic dog. Using client‐owned dogs would subject the otherwise well controlled dogs and their owners to potential complications of uncontrolled diabetes. Furthermore, the use of purpose‐bred dogs allowed elimination of other factors that might impact day‐to‐day variability, such as timing of meals, meal composition and timing and characteristics of daily exercise. These factors could not be controlled in client owned dogs. Last, dogs with spontaneous DM have different residual beta cell composition than induced‐DM dogs.24 Dogs with spontaneous DM are not necessarily 100% beta cell deficient. With disease progression, their insulin requirements might change over time. In contrast, dogs with induced diabetes have a permanent and unchanging beta cell deficiency, which makes them better suited for a repeated‐measure design.
The q12h study was not designed to achieve best glycemic control (doses were not adjusted) but rather it was designed to enable comparison of variability. In this setting, while PL had the highest degree of day‐to‐day variability, PL was superior in terms of other measures of glycemic control (mean IG, GVP) while having no difference in the frequency of low IG. Mean IG is probably going to be most important determinant of short‐term owner satisfaction with treatment but GVP might become important in the long‐term as predictor of future hypoglycemic events. A clinical trial in client‐owned dogs would be required to compare the overall safety and efficacy of these insulin formulation in a real‐life setting when diets are individualized for patients and long‐term risk of hypoglycemia is assessed.
In conclusion, this study compares 3 commercially available insulin formulations and demonstrates no clear advantages of 1 formulation vs. another. As expected, PL was associated with greater day‐to‐day variability compared to IDeg and IGla300 but was also associated with the lowest intraday glucose variability, probably as a consequence of having a peak action at the postprandial time frame. In contrast, IDeg and IGla300 administered twice daily were associated with lower day‐to‐day variability, which might be advantageous in minimizing monitoring requirements and long‐term frequency of hypoglycemia.
CONFLICT OF INTEREST DECLARATION
Authors declare no conflict of interest.
OFF‐LABEL ANTIMICROBIAL DECLARATION
Authors declare no off‐label use of antimicrobials.
INSTITUTIONAL ANIMAL CARE AND USE COMMITTEE (IACUC) OR OTHER APPROVAL DECLARATION
Approved by the IACUC of the University of California, Davis, protocol # 20539.
HUMAN ETHICS APPROVAL DECLARATION
Authors declare human ethics approval was not needed for this study.
ACKNOWLEDGMENT
No funding was received for this study. The abstract was presented as a poster presentation at the 2020 ACVIM Forum On Demand.
Miller M, Pires J, Crakes K, Greathouse R, Quach N, Gilor C. Day‐to‐day variability of porcine lente, insulin glargine 300 U/mL and insulin degludec in diabetic dogs. J Vet Intern Med. 2021;35(5):2131–2139. 10.1111/jvim.16178
REFERENCES
- 1.Guptill L, Glickman L, Glickman N. Time trends and risk factors for diabetes mellitus in dogs: analysis of veterinary medical data base records (1970‐1999). Vet J. 2003;165:240‐247. [DOI] [PubMed] [Google Scholar]
- 2.Catchpole B, Ristic JM, Fleeman LM, et al. Canine diabetes mellitus: can old dogs teach us new tricks? Diabetologia. 2005;48:1948‐1956. [DOI] [PubMed] [Google Scholar]
- 3.Owens DR, Bailey TS, Fanelli CG, et al. Clinical relevance of pharmacokinetic and pharmacodynamic profiles of insulin degludec (100, 200 U/mL) and insulin glargine (100, 300 U/mL)—a review of evidence and clinical interpretation. Diabetes Metab. 2019;45:330‐340. [DOI] [PubMed] [Google Scholar]
- 4.Fleeman LM, Rand JS. Evaluation of day‐to‐day variability of serial blood glucose concentration curves in diabetic dogs. J Am Vet Med Assoc. 2003;222:317‐321. [DOI] [PubMed] [Google Scholar]
- 5.Heise T, Nosek L, Rønn BB, et al. Lower within‐subject variability of insulin detemir in comparison to NPH insulin and insulin glargine in people with type 1 diabetes. Diabetes. 2004;53:1614‐1620. [DOI] [PubMed] [Google Scholar]
- 6.Becker RH, Dahmen R, Bergmann K, et al. New insulin glargine 300 units·mL−1 provides a more even activity profile and prolonged glycemic control at steady state compared with insulin glargine 100 units·mL−1 . Diabetes Care. 2015;38:637‐643. [DOI] [PubMed] [Google Scholar]
- 7.Steinstraesser A, Schmidt R, Bergmann K, et al. Investigational new insulin glargine 300 U/ml has the same metabolism as insulin glargine 100 U/ml. Diabetes Obes Metab. 2014;16:873‐876. [DOI] [PMC free article] [PubMed] [Google Scholar]
- 8.Yki‐Järvinen H, Bergenstal RM, Bolli GB, et al. Glycaemic control and hypoglycaemia with new insulin glargine 300 U/ml versus insulin glargine 100 U/ml in people with type 2 diabetes using basal insulin and oral antihyperglycaemic drugs: the EDITION 2 randomized 12‐month trial including 6‐month extension. Diabetes Obes Metab. 2015;17:1142‐1149. [DOI] [PMC free article] [PubMed] [Google Scholar]
- 9.Ritzel R, Roussel R, Bolli GB, et al. Patient‐level meta‐analysis of the EDITION 1, 2 and 3 studies: glycaemic control and hypoglycaemia with new insulin glargine 300 U/ml versus glargine 100 U/ml in people with type 2 diabetes. Diabetes Obes Metab. 2015;17:859‐867. [DOI] [PMC free article] [PubMed] [Google Scholar]
- 10.Goldman J, White JR Jr. New insulin glargine 300 U/mL for the treatment of type 1 and type 2 diabetes mellitus. Ann Pharmacother. 2015;49:1153‐1161. [DOI] [PubMed] [Google Scholar]
- 11.Fink H, Herbert C, Gilor C. Pharmacodynamics and pharmacokinetics of insulin detemir and insulin glargine 300 U/mL in healthy dogs. Domest Anim Endocrinol. 2018;64:17‐30. [DOI] [PubMed] [Google Scholar]
- 12.Oda H, Mori A, Ishii S, et al. Time‐action profiles of insulin degludec in healthy dogs and its effects on glycemic control in diabetic dogs. J Vet Med Sci. 2018;80:1720‐1723. [DOI] [PMC free article] [PubMed] [Google Scholar]
- 13.Russell‐Jones D, Gall MA, Niemeyer M, et al. Insulin degludec results in lower rates of nocturnal hypoglycaemia and fasting plasma glucose vs. insulin glargine: a meta‐analysis of seven clinical trials. Nutr Metab Cardiovasc Dis. 2015;25:898‐905. [DOI] [PubMed] [Google Scholar]
- 14.Church DB. The blood glucose response to three prolonged duration insulins in canine diabetes mellitus. J Small Anim Pract. 1981;22:301‐310. [DOI] [PubMed] [Google Scholar]
- 15.Mori A, Kurishima M, Oda H, et al. Comparison of glucose fluctuations between day‐ and night‐time measured using a continuous glucose monitoring system in diabetic dogs. J Vet Med Sci. 2013;75:113‐117. [DOI] [PubMed] [Google Scholar]
- 16.Sako T, Mori A, Lee P, et al. Time‐action profiles of insulin detemir in normal and diabetic dogs. Res Vet Sci. 2011;90:396‐403. [DOI] [PubMed] [Google Scholar]
- 17.Fleeman LM, Rand JS, Morton JM. Pharmacokinetics and pharmacodynamics of porcine insulin zinc suspension in eight diabetic dogs. Vet Rec. 2009;164:232‐237. [DOI] [PubMed] [Google Scholar]
- 18.Anderson HR, Stitt AW, Gardiner TA, et al. Induction of alloxan/streptozotocin diabetes in dogs: a revised experimental technique. Lab Anim. 1993;27:281‐285. [DOI] [PubMed] [Google Scholar]
- 19.Corradini S, Pilosio B, Dondi F, et al. Accuracy of a flash glucose monitoring system in diabetic dogs. J Vet Intern Med. 2016;30:983‐988. [DOI] [PMC free article] [PubMed] [Google Scholar]
- 20.Peyser TA, Balo AK, Buckingham BA, et al. Glycemic variability percentage: a novel method for assessing glycemic variability from continuous glucose monitor data. Diabetes Technol Ther. 2018;20:6‐16. [DOI] [PMC free article] [PubMed] [Google Scholar]
- 21.Klimontov VV, Myakina NE. Glucose variability indices predict the episodes of nocturnal hypoglycemia in elderly type 2 diabetic patients treated with insulin. Diabetes Metab Syndr. 2017;11:119‐124. [DOI] [PubMed] [Google Scholar]
- 22.Rama Chandran S, Tay WL, Lye WK, et al. Beyond HbA1c: comparing glycemic variability and glycemic indices in predicting hypoglycemia in type 1 and type 2 diabetes. Diabetes Technol Ther. 2018;20:353‐362. [DOI] [PubMed] [Google Scholar]
- 23.Kilpatrick ES, Rigby AS, Goode K, et al. Relating mean blood glucose and glucose variability to the risk of multiple episodes of hypoglycaemia in type 1 diabetes. Diabetologia. 2007;50:2553‐2561. [DOI] [PubMed] [Google Scholar]
- 24.Gilor C, Pires J, Greathouse R, et al. Loss of sympathetic innervation to islets of Langerhans in canine diabetes and pancreatitis is not associated with insulitis. Sci Rep. 2020;10(1):19187. [DOI] [PMC free article] [PubMed] [Google Scholar]
- 25.Elliott KF, Rand JS, Fleeman LM, et al. A diet lower in digestible carbohydrate results in lower postprandial glucose concentrations compared with a traditional canine diabetes diet and an adult maintenance diet in healthy dogs. Res Vet Sci. 2012;93:288‐295. [DOI] [PubMed] [Google Scholar]
- 26.Maggiore AD, Nelson RW, Dennis J, et al. Efficacy of protamine zinc recombinant human insulin for controlling hyperglycemia in dogs with diabetes mellitus. J Vet Intern Med. 2012;26:109‐115. [DOI] [PubMed] [Google Scholar]
- 27.Werner U, Tennagels N, Fanelli CG, et al. Equipotency of insulin glargine 300 and 100 U/mL with intravenous dosing but differential bioavailability with subcutaneous dosing in dogs. Diabetes Obes Metab. 2021;23(1):166‐174. [DOI] [PMC free article] [PubMed] [Google Scholar]
- 28.Fracassi F. Canine diabetes mellitus. In: Ettinger SJ, Feldman E, Cote E, eds. Textbook of Veterinary Internal Medicine. St. Louis, MO: Elsevier; 2017:1767‐1781. [Google Scholar]