Abstract.
Purpose: In conventional diagnosis, the visual inspection of the malaria parasite Plasmodium falciparum in infected red blood cells under a microscope, is done manually by pathologists, which is both laborious and error-prone. Recent studies on automating this process have been conducted using artificial intelligence and feature selection of positional and morphological features from blood smear cell images using convolutional neural network (CNN). However, most deep CNN models do not perform well as per the expectation on small datasets.
Approach: In this context, we propose a comprehensive computer-aided diagnosis scheme for automating the detection of malaria parasites in thin blood smear images using deep CNN, where transfer learning is used for optimizing the feature selection process. As an extra layer of security, layer embeddings are extracted from the intermediate convolutional layers using the feature matrix to cross-check the selection of features in the intermediate layers. The proposal includes the utilization of the ResNet 152 model integrated with the Deep Greedy Network for training, which produces an enhanced quality of prediction.
Results: The performance of the proposed hybrid model has been evaluated concerning the evaluation metrics such as accuracy, precision, recall, specificity, and F1-score, which has been further compared with the pre-existing deep learning algorithms.
Conclusions: The comparative analysis of the results reported based on the accuracy metrics demonstrates promising outcomes concerning the other models. Lastly, the embedding extraction from the intermediate hidden layers and their visual analysis also provides an opportunity for manual verification of the performance of the trained model.
Keywords: malaria, Deep Greedy Network, supervised learning, ResNet 152, feature extraction, transfer learning, computer-aided diagnostics
1. Introduction
Malaria is one of the widespread global diseases in the world. It is highly infectious and life-threatening, caused by a genus of protozoa named Plasmodium, with a minimum of seven days for incubation.1 According to the World Health Organization in 2020, there were an estimated 409,000 malaria deaths in 2019.2 Despite these statistics, the malarial mortality rate can be controlled via fast and reliable diagnosis at early stages. But the increase in the number of reported cases of malaria is highly unstable and non-uniform due to various factors such as the climatic conditions,2 geographical locations, availability of stagnant water, and so on, which might further lead to the breeding of the Anopheles mosquitoes, which serve as the vector of the Plasmodium parasites. Malarial transmission is more intense especially after rain and when the temperature becomes feasible for a longer life span of the mosquitoes. That is why 90% of cases occur in Africa and the disease is common over tropical regions extending over Asia and Latin America.3
Early diagnosis of malarial parasites and treatment with proper medication such Malarone and Quinine compounds4 can still prevent the harmful consequences and further check its mortality rate. But due to factors such as lack of highly trained expertise in rural areas, mismanagement of data, and low availability of detection tools, malaria detection is very unstable and difficult in many corners of the world.
To identify the malarial parasite, several methods have been proposed earlier. Among these methods, the microscopic examination of Giemsa stained thin blood smear5 is found to be cheap and of lower complexity, as a result of which it is mainly preferred. However, its efficacy is largely dependent on the expertise of the pathologists. Additionally, the visual inspection for malarial parasites is time-consuming and may fail to consistently identify parasites when malarial forms are very rare. With the increase in the number of malaria cases, the pressure and workload on pathologists increase greatly. This leads to a growing need for computer-aided diagnosis (CAD), which is fast and efficient in precise diagnosis and personalized health tasks.
The tremendous improvement and success of machine learning in image tracking and recognition tasks has led to the increased applications of these automated algorithms in medical electronic records and imaging-based diagnostics. As time elapsed, this improvement was further pushed forward due to the availability of a large amount of annotated datasets to train deep learning models for the recognition of diseases in various spheres of medical science. In recent days, automated CAD is being guided by three major conceptual units, which are deep learning algorithms, dataset characteristics, and the phenomenon of transfer learning. Shin et al.6 exploited these factors and evaluated them extensively to check the performance of the convolutional neural network (CNN) model in the domain of CAD in two major areas of application, namely, thoracoabdominal lymph node detection and interstitial lung disease classification. The study reported the high-performance computational capabilities of the newly CNN-based CAD.
Nowadays, these CAD-based applications and deep learning are being widely used in medical analysis. Ker et al.7 explained and classified the key research areas of medical image classification, localization, and segmentation. The paper highlighted the necessary CAD-based applications used in these tasks. Also, the paper sheds light on the challenges faced by the current CAD-based applications, the future technology, and the medium through which they can be solved.
Digitally segmented images of cells from thin blood smear slides are used to detect diseases such as malaria. Digital cell segmentation is the process of capturing microscopic image space that represents a specific instance of that cell. Traditional machine learning algorithms such as support vector machine (SVM)8 were also utilized for classifying blood smear images automatically. Díaz et al.8 utilized SVM to classify blood smear images to detect infected erythrocytes with malaria parasites and their infection stage. The experiment provided 94% sensitivity on a dataset containing 450 images.
The prior designing of a neural network architecture based on the dataset and learning parameters introduces the design overhead. Furthermore, the fine-tuning of these architectures and the optimization of hyperparameters during training of the deep neural network are computationally costly. Qin et al.9 proposed an evolutionary convolutional deep network algorithm to solve this problem. To detect malaria parasites, the evolutionary algorithm first generated the most optimized neural network architecture and then the neural network model was trained on extensive thin blood smear images. The best result achieved an accuracy of 99.98% which shows the significant improvement for CAD systems.
Numerous research projects were undertaken recently for the detection and prediction of malaria from infected cell images. Nugroho et al.10 brought forward one such powerful method to detect the three stages of plasmodium parasites in the human body namely, trophozoite, schizont, and gametocyte of Plasmodium falciparum. Their method consisted of an enhanced image stage to convert images to HSV color space, an image segmentation stage using -means clustering and morphological operator, and a feature extraction stage based on histogram-based texture. HSV represents hue, saturation, and value, respectively. HSV is used to determine the luminance of an image along with the color configuration. Finally, a classification model based on multi-layer perceptron was utilized, which is nothing but a neural network that analyzes the statistical patterns of the given input. This achieved an accuracy of 87% for the test dataset mentioned in the paper. According to the paper,10 the execution time taken by the classification was found to be 0.55 s.
To reduce the time and effort of training a neural network model for image classification as well as work with a small amount of dataset, transfer learning was found to be a promising technique. One such work was shown by Reddy and Juliet,11 where Resnet 50 was used for malaria cell image classification along with the implementation of transfer learning. The experimental results obtained were significant where the loss was minimized with training accuracy of 95.91% and validation accuracy of 95.4%.
In this context, the proposed work brings forward a CAD technique to help in the better identification of digitally segmented cells from the thin blood smear slide images as parasitized or uninfected. In this proposed work, the CNN is used to extract important underlying information between pixels of thin blood smear slide images. However, the size of the dataset plays a very important role in the efficiency of the CNN classification model. For this model, a dataset of nearly 27,558 malarial cell images12 was used, which is comparatively small to train an image classification CNN model. To counter this problem, transfer learning13 has been proposed where the model uses a part of a pre-trained network with features already extracted. This solves a great deal of computational time and also works well in a small dataset. In this paper, Resnet-152 was used as a part of this work and the Deep Greedy Network14 is used to enhance the performance of the model.
Though there have been some significant works in the field of CAD of malaria from segmented cells,15 this work primarily focuses on two broad aspects. First, it uses the transfer learning from Resnet-152, which gives high efficacy on image classification tasks. Then the model is encapsulated with a Deep Greedy Network to overcome the overfitting problem, which further helped to train the model with important features. Lastly, it introduces a risk minimization mechanism while deciding to classify a segmented cell as a parasitized or uninfected cell. The proposed approach brings in a balanced CAD technique for the diagnosis of malaria in a patient.
2. Preliminaries
2.1. Computer-Aided Diagnosis
In the field of medical science, computer-aided detection and computer-aided diagnosis are computer-based systems that help doctors in taking decisions from medical images.12 Analysis of images is essential as it is a crucial step in the detection of certain diseases. Medical images often become too complicated and risky to be analyzed by doctors for abnormality in a short time. To solve this issue, CAD systems came up, which improves the quality of images and processes it to highlight the conspicuous parts.
CAD is a technology that brings in multiple concepts such as artificial Intelligence, computer vision, medical image processing whose main aim is to find an abnormality in the human body. From a macrocosmic view, CAD not only has its wide applications in detecting tumors in breast cancer16 and lung cancer17 but also the fields of pathological brain detection,18 such as magnetic resonance imaging (MRI) and diabetic retinopathy.19 This phenomenon has been utilized in the detection of parasitic growth in image segmented cells of thin blood smear slide images in this work.
2.2. Artificial Neural Network and Convolutional Neural Neural Network
An artificial neural network is a conceptual network of virtual neurons that mimics the behavior of biological neurons in terms of information processing and learning. A typical neural network has an input layer (which makes up the inputs), one or many hidden layers (which do the main learning), and an output layer (to get outputs).20 Each layer of neurons accepts inputs from the previous layer, processes them, and passes the signal to the next layer of neurons, forming a complex network. Learning happens based on a feedback mechanism. These networks are classified into two types are shallow and deep neural networks. A shallow neural network is the basic form of neural network, which is made up of one Input Layer, one or two hidden layers, and an output layer.21 On the other hand, a typical deep neural network21 has an input layer, more than two hidden layers, and an output layer, to effectively study both the high and low-level behavior features in the data. With the increase in depth in the neural network as learning increases, training error decreases to a minimum value. After that point, training error starts increasing with the addition of more layers.22 In the current state of the art, this optimal number of layers is decided through trial and error. However, the science behind finding the optimal number of layers and neurons in each layer is yet a very demanding area of research.
CNN or ConvNet such as a normal deep neural network is made up of neurons that have learnable weights and biases. Every neuron accepts some inputs, performs dot products on it, and optionally follows it with non-linearity. The whole network can be represented or viewed as a single differentiable function: from raw image pixels on one end to class scores on the other end.23 The layers in ConvNet have neurons arranged in three dimensions: width, height, and depth. The depth here means the third dimension representing the input channel and not the depth of the full neural network. Every ConvNet has three main layers: convolutional layer, pooling layer, and fully connected Layer.
2.3. Feature Extraction
Features play an important role in the field of image processing. Before generating features, many preprocessing steps like binarization, thresholding, and normalization are applied on sampled images.24 After that, the feature extraction is applied to get the most important features, which are further utilized for image processing and classification problems.25
In this context, when the input data are too voluminous, redundant, and computationally costly to be processed, the input data are transformed into a reduced set of features. This phenomenon is called feature extraction. If feature extraction is done carefully and precisely, then the feature set should be able to represent the input data with almost no loss of essential features and also with lower dimension.26 These reduced feature vectors are then fed to the classifier to link the input data with its corresponding class unit. In this paper, ConvNet has been used as a classifier to classify malarial images into parasitized or unaffected classes.
2.4. Transfer Learning
In simple words, transfer learning13 is the process of reusing a pre-trained model for different tasks but of a similar type. This process exploits the knowledge gained from previous tasks to improve the generalization about others.27 It is very popular with deep learning methodologies since it allows us to work with small datasets where the model does not need to be trained from scratch using the small dataset. Instead, the knowledge of the features of the old model can be reused to generalize the new task. This helps in reducing the training time while avoiding the overfitting problem caused by the lack of availability of a large number of datasets.
2.5. Residual Neural Network
In the Deep CNN, there is a saying that with adding more layers there is a decrease in training and test error. But it was soon found by He et al.28 that with the increase in the number of layers in deep neural networks the error increased too. The primary reason for the anomaly was found to be the phenomena of vanishing and exploding gradients.
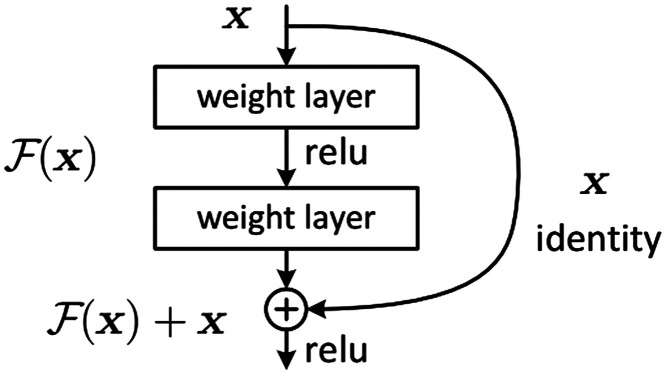
To solve this unwanted behavior in a very deep neural network with a huge number of layers, residual blocks were introduced. Residual block essentially solves this problem by introducing a technique called “skip connections,” identity mapping as shown in Fig. 1. Identity mapping adds the output of a previous layer to the layer ahead by skipping some layers in between. However, and should have the same dimension. A residual network can have more than one residual block.
Fig. 1.
Building block of residual learning.28
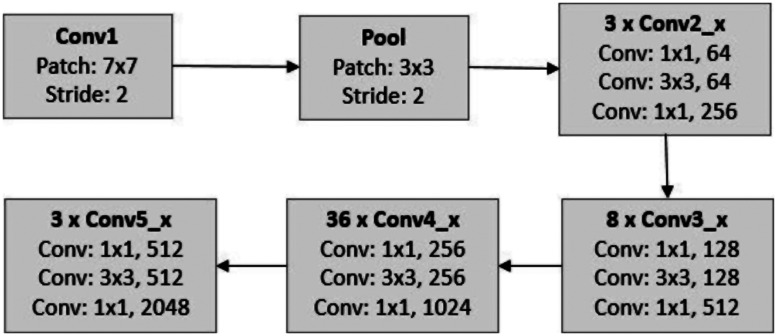
In this work, Resnet 152 has been used. Resnet 152 is a very deep network with depth up to 152 layers, nearly eight times deeper but with less complexity than visual geometry group (VGG) Nets proposed by Simonyan and Zisserman. VGG is a CNN model proposed in the year 2015.29
He et al.28 in his paper proposed the basic architecture of Resnet 152. Resnet 152 not only used batch normalization in each Conv layer but also 10 crop testing for prediction. Along with this, 6 models were used for ensemble boosting. In 10 crop technique,30 from the original image, four cropped sections are taken from four corners along with a center cropped section, producing a total of five cropped images. Additionally, the mirror image of the five cropped images along the horizontal axis is generated, which formulates a total of 10 cropped images. Together with these layers and parametric settings, Resnet 152 in the paper28 achieved nearly 3.57% error in the Imagenet test set and gave 28% better detection over other ResNets on the COCO object detection dataset. Figure 2 above gives a basic architecture of Resnet 152, which has been adapted from a paper by L. D. Nguyen et al..31
Fig. 2.
Architecture of Resnet 152.
3. Proposed Method
3.1. Overview of the Learning Model
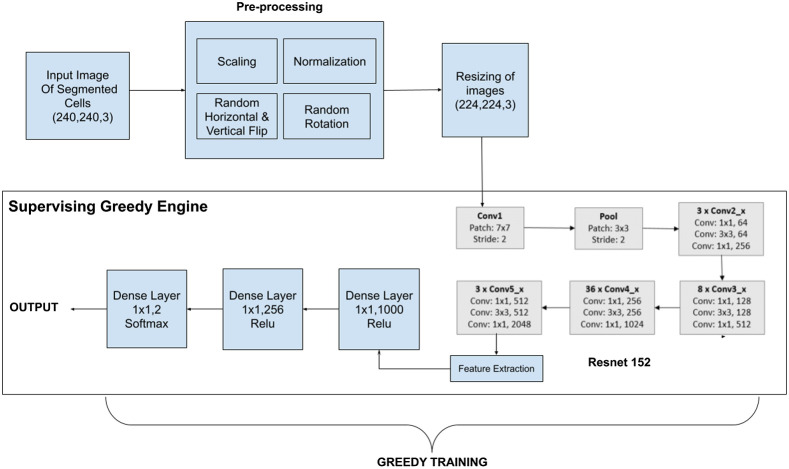
The pipeline of the proposed approach is made up of the following steps as shown in Fig. 3. First, images of dimension are passed through a preprocessing stage. Rescaling and normalization are then performed on each image. Moreover, among these images, some are vertically flipped and some are horizontally flipped randomly. Few images are operated with random rotations too. Then the images are resized to dimension and fed to Resnet 152 architecture. Using this stacked CNN, the feature extraction is done automatically rather than manual feature selection. The output of the CNN is then fed to a dense layer of 1000 neurons, which is further cast on a dense layer consisting of 256 neurons. Finally, it is condensed to 2 neurons in a dense layer and a softmax function is applied to generate the output.
Fig. 3.
Graphical view of the proposed Resnet 152 with Deep Greedy Network model.
In this work, a stacked CNN architecture with Residual learning is used. Resnet 15232 used has 152 deep layers and thus helps in overcoming the problems of manual feature extraction. Besides, the Deep Greedy Network learning model14 has been implemented on top of the ResNet 152, due to which while training the model, the validation loss is evaluated after each epoch. It is then compared against the previous best parametric settings and then the configuration with the best accuracy is stored.
For calculating the loss, binary cross-entropy (BCE)33 loss, also called sigmoid cross-entropy loss is applied. Unlike softmax loss, this is independent of each vector component (class). This states that the loss computed for each CNN output component is not affected by other classes or component values.
| (1) |
where BCE is the BCE loss, is sigmoid function i.e., , is representing Classification classes here, and , , and are the scores and the ground truth label for the class , , and are the scores and the ground truth label for the class respectively. Lastly, and .
The greedy approach encapsulates the whole training process starting from the feature selection process via Resnet to dense layers 2 neuron condensation. The training of the neural network follows the overall learning methods, specifically, forward propagation, backward propagation, and parameter updates. At that point, the model’s prediction loss is calculated on the validation set once the network has finished these consecutive strides for one epoch on each small group of training examples or the mini-batches. If the loss is found to be lower among all those of the past cycles, then the parametric setting is preserved as the best parametric configurations.14
The training and fitting of the model are further enhanced by the feature selection via Resnet 152 implemented in our model. This feature selection is very helpful as not only does the model perform with higher accuracy but it also clearly indicates the cause of its prediction. The selection of the most important features that are playing a significant role in identifying the infection can further help in a proper understanding of the infected parts in the segmented cells. This technique therefore substantially improves the performance of the proposed model by maintaining a higher prediction accuracy as compared to existing models.
3.2. Proposed Algorithm
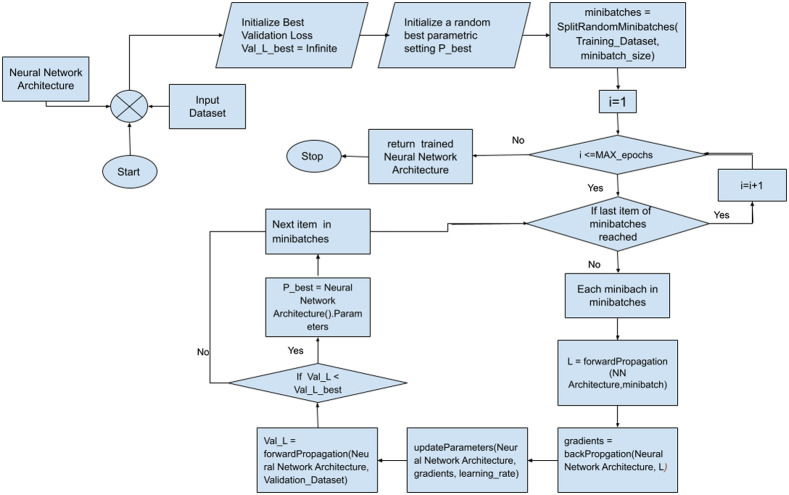
While training, the neural network model along with the input dataset of segmented cell images is provided as the input to the Deep Greedy model. The model is then allowed to train itself with a predefined set of epochs after which the trained neural network architecture is finally returned as output. The whole procedure of training the Neural Network model is demonstrated in fig. 4. First, the designed neural network model is imported along with the input images dataset. Then the validation loss is initialized to be infinite besides initializing a random best parameter setting to be P_best. The image dataset is then split into some mini-batches based on minibatch size. In the next step, a loop iterates from 1 till the MAX_epochs as specified. In each iteration, the model is fed with mini-batches one after another, and the loss is calculated as via forward propagation. Based on , the gradient is calculated via backPropagation, and parameters are temporarily updated. If newly updated parameters are found to produce the least validation loss among all the training iterations up to the current one, then the new parameters list is saved as P_best and the next minibatch is checked. After all the iterations are completed, the Neural Network model with its best parametric setting P_best is returned.
Fig. 4.
Proposed learning algorithm.
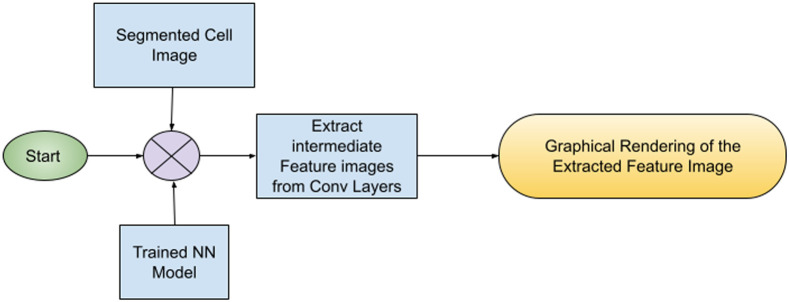
In the final phase of the work the trained neural network model is fed with a segmented cell image from a test image dataset. The model processes the image in its intermediate Conv layers and condenses in dense layers. In each Conv layer, the Feature Matrix is extracted and visualized graphically as shown in Fig. 5. In this way, the images are extracted from the intermediate convolution layers for the introduction of an added security measure. These images can be verified by the medical practitioners jointly with the technical and computer vision specialists to check if the model properly identifies the infected area in the segmented cell image and prediction is correct or not.
Fig. 5.
Flowchart of proposed experiment.
4. Dataset
The dataset12 used in this work contains a collection of thin blood smear slide images from the malaria screener research activity. For the purpose of creating the dataset, Giemsa stained thin blood smear images from 150 Plasmodium falciparum34 infected and 50 healthy patients were collected. Images of slides for each microscopic field of view were captured by a smartphone’s built-in camera. Then the images were manually annotated by an expert pathologist slide reader at the Mahidol-Oxford Tropical Medicine Research Unit in Bangkok, Thailand. The de-identified images and the annotations were archived at the National Library of Medicine (NLM) to make them publicly available for future research. A level-set based algorithm was applied to detect and segment the red blood cells. The dataset currently contains a total of 27558 cell images including 13,780 parasitized and 13,778 uninfected cell images. Lastly, the dataset consists of images of all the three major morphological stages of Plasmodium falciparum, namely, trophozoite, schizont, and gametocyte.
5. Experimentation Details
5.1. Experimental Environment and Essential Parameters
The dataset described in Sec. 4, consists of digitally segmented cells from the thin blood smear slide images from the Malaria Screener research activity. The whole dataset is split in the ratio of for training, validating, and testing the data. The dimension of every training example of the dataset after Image Augmentation is formulated to be . Each mini-batch consists of 32 examples and the total number of iterations on training data are 15. Furthermore, Adam optimizer35 is used for optimizing the learning behavior of the neural network. In this experiment, TensorFlow and Tensorboard are used for the training and visualization of this model.
5.2. Experimental Results and Comparative Analysis
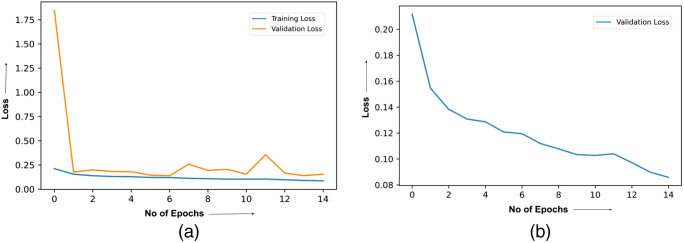
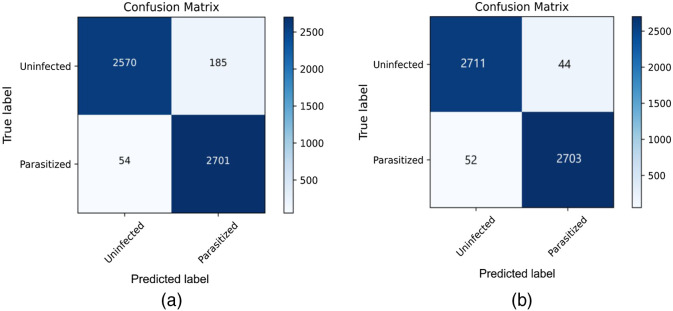
The loss curve related to the learning of the ResNet model has been provided in Fig. 6, which has been considered for two different isolated scenarios. Figure 6(a) shows the plot of the training as well as the validation loss without using the Deep Greedy Network. On the other hand, Fig. 6(b) shows the plot of the loss versus the number of training epochs on the validation set while using the Deep Greedy Network. Based on the experimental results, the confusion matrix is found for the two different cases i.e. without and with the integration of the Deep Greedy Network architecture, which has been provided in Figs. 7(a) and 7(b), respectively.
Fig. 6.
Plot of loss curve caption: (a) training and validation loss curve for ResNet 152 without integrating Deep Greedy Network (b) validation loss curve for ResNet 152 with the integration of Deep Greedy Network.
Fig. 7.
Confusion Matrix caption: (a) ResNet 152 without any integration with Deep Greedy Network (b) ResNet 152 integrated with Deep Greedy Network.
Table 1 provides a comparative analysis concerning various models for the prediction of malaria-infected cells, which has been adapted as reported in the literature of Nayak et. al.36 The analysis was performed on certain metrics namely, accuracy, precision, recall (or sensitivity), specificity, and F1 score. Considering the true positive, true negative, false positive, and false negative as TP, TN, FP, and FN respectively, the mathematical formulation on which these metrics depend are provided as follows:
| (2) |
| (3) |
| (4) |
| (5) |
| (6) |
Table 1.
Comparative analysis of the performance metrics.
| Name of the model | Accuracy | Precision | Recall/sensitivity | Specificity | F1-Score |
|---|---|---|---|---|---|
| DenseNet 121 | 97.22 | 97.58 | 96.83 | 97.60 | 97.20 |
| AlexNet | 95.62 | 95.24 | 95.97 | 95.28 | 95.60 |
| VGG - 16 | 95.37 | 94.99 | 95.59 | 95.16 | 95.29 |
| ResNet -50 | 97.55 | 97.23 | 97.90 | 97.19 | 97.90 |
| FastAi | 97.38 | 97.27 | 97.42 | 97.32 | 97.35 |
| ResNet 152 without Deep Greedy Network | 95.66 | 93.28 | 97.94 | 93.58 | 95.56 |
| ResNet 152 with Deep Greedy Network (proposed model) | 98.25 | 98.40 | 98.11 | 98.39 | 98.26 |
5.3. Reported Graphical Results for Proposed Perceptual Security Measures
One of the positive examples of a cell showing a stained malarial parasite is provided in Fig. 8. The RBC is stained with a Giemsa stain,37 and purple shades indicated within the image represents the parasitic growth of the plasmodium.
Fig. 8.
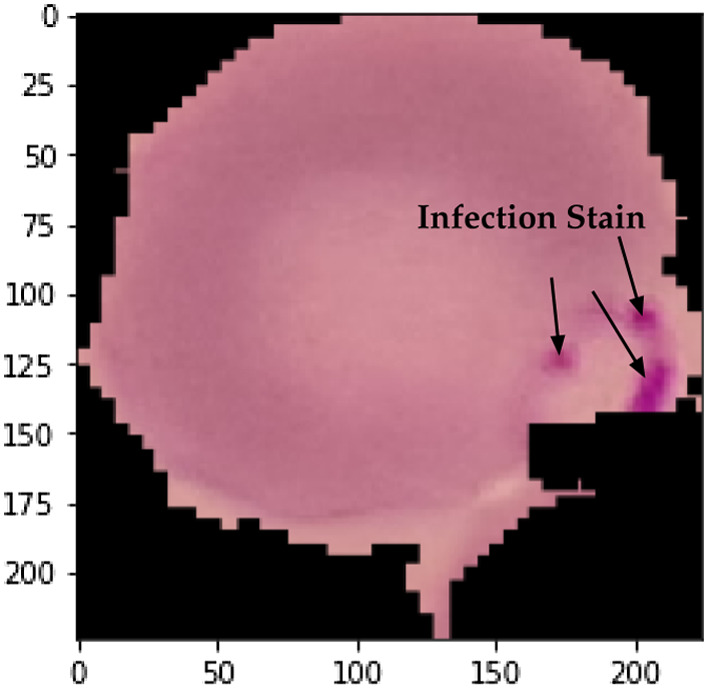
Original microscopic stained digital image of Plasmodium falciparum in the Trophozoite stage.
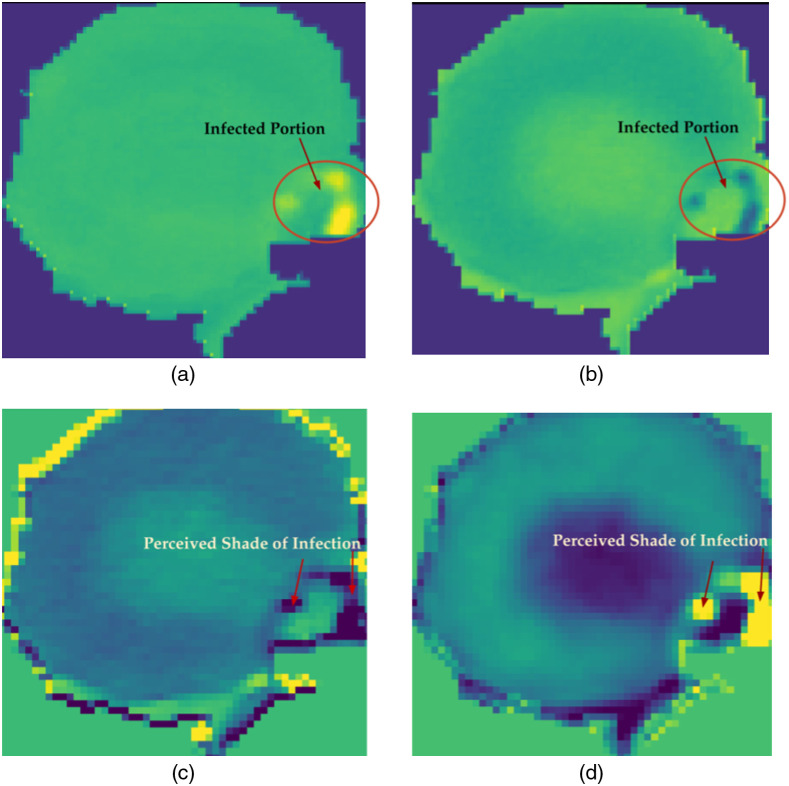
Figure 9 shows the processed and perceived stain that has been extracted as the feature extracted image from intermediate convoluted layers of the ResNet 152 model. Figures 9(a) and 9(b) have been extracted from the conv2_block1_out (activation) layer, and Figs. 9(c) and 9(d) have been extracted from the conv4_block36_1_conv (Conv2D) of the ResNet 152 model, respectively. The conv2_block1_out (activation) layer is the one located at the initial or shallow depth of the model whereas the conv4_block36_1_conv (Conv2D) layer is present at a much deeper depth of the neural network model of ResNet 152.
Fig. 9.
Intermediate extracted images captions: (a) Extraction of conv2_block1_out (activation) related to first randomly chosen filter among 256 filters. (b) Extraction of conv2_block1_out (Activation) related to second randomly chosen filter among 256 filters. (c) Extraction of conv4_block36_1_conv (Conv2D) related to first randomly chosen filter among 256 filters. (d) Extraction of conv4_block36_1_conv (Conv2D) related to the second randomly chosen filter among 256 filters.
5.4. Analysis and Discussion of the Reported Results
Comparative analysis has been performed concerning the previously proposed models while maintaining the standard of comparison by using the same dataset of a digital microscope image of infected and non-infected red blood cells. Starting from the phase of training, referring to Fig. 6(a), the training loss was found to substantially decrease along with the validation loss, however, with greater fluctuations or training noise. The noise is generally caused due to the local divergence away from the global optima related to the training process of the neural network. In simple words, the configuration of the parameters is tuned in such a manner that it gets deviated away from the path of convergence due to overfitting. On the contrary, Fig. 6(b) shows that the integration with the Deep Greedy Network model efficiently restricts the system from getting into any local divergence caused due to the overfitting phenomena and provides a smoother and more stabilized learning curve. This can be observed from the monotonically decreasing behavior of the loss versus the number of epochs curve as seen in Fig. 6(b).
Furthermore, based on Figs. 7(a) and 7(b), it can be also established that the prediction output on the test set shows a significant performance enhancement while using the Deep Greedy Network with ResNet 152 as the reference model in contrast to the one without using it. This is further verified from Table 1 that based on each of the comparison metrics the ResNet 152 model shows a significant improvement in comparison to the other proposed models. It is also seen that usage of the Deep Greedy Network also provides a notable enhancement in the quality of learning and prediction outcomes.
Lastly, from the extracted feature provided in Figs. 9(a) and 9(b), it can be observed that since the layer is chosen from a shallow depth, the detected feature is a low-level feature. On the other hand, the Figs. 9(c) and 9(d) have been extracted from the deeper layer of the ResNet 152 model, which focuses on the more detailed features as it prominently highlights the specific portion of the image representing the parasitic growth. This feature extraction by hooking some specific predefined layers of a neural network model provides an additional layer of security as it provides a way for humans to cross-validate the internal perceptions of the neural network. It also helps to set a clear analytical conclusion of the features based on which the designed model makes a prediction related to the malaria diagnosis, i.e., whether a blood smear image is parasitized or uninfected by malarial plasmodium parasites.
6. Conclusion
Malaria is one of the most widespread diseases in the world, affecting millions of people around the globe. Sometimes failure to detect the infection of Plasmodium falciparum in the early stages causes numerous fatalities. In this context, there remains a widespread requirement of setting up testing laboratories and highly skilled pathologists in a large number to correctly detect and report the infection at the fastest possible pace. Furthermore, every year the total number of cases is rising around the globe, which is imposing tension on the existing testing infrastructure and increasing the resource demand of these laboratory setups and availability of skilled pathologists. Additionally, to cope up with the increasing testing demands and number of infection cases, the pathologists are trying to hasten the testing and reporting procedure, which is leading to erroneous predictions. Based on this circumstance, this paper proposes an AI algorithm that is based on CAD especially in the domain of computer vision using deep learning. The primary aim of this proposal is to bring forward an algorithm that can predict if a cell is plasmodium infected or not with higher accuracy than the pre-existing algorithms.
With the rapid influx of labelled data, improved computational abilities and AI-based CAD is being introduced in the field of medical diagnosis for their fast and accurate identification where malaria is also not an exception. Many CAD-based works for the diagnosis of malarial parasites from cell images are being developed. In this work, ResNet 152 with the integration of Deep Greedy Network was used to predict the presence of malaria infection within the sample of RBCs taken from patients. It was found that the proposed method resulted in higher prediction accuracy, sensitivity, specificity, precision and F1-score, outperforming other pre-existing works. Also, as an extra layer of security, the graphic visualization of the extracted feature matrix in each Conv layer provides a way to view the working in the inner layers of the model, thus increasing its reliability.
The proposed method can be integrated with laboratory equipment like microscopes. The image under the microscope can be captured and sent to a computing system where this pre-trained model is being used to predict the result. Since the process is fully automated it can enhance the quality of results as well as reduce the time taken in the complete testing process and hence will increase the throughput, which will further reduce the overhead of increasing testing laboratory setups and human resources. Lastly, the higher accuracy of the proposed algorithm will result in a lower probability of false prediction, which in turn will enhance the quality of treatment at the right time.
Biographies
Sumagna Dey is a final year student in the Computer Science & Engineering Department, pursuing a BTech degree at Meghnad Saha Institute of Technology, Kolkata, India. He is an active member of IEEE & IEEE Computer Society. His research interests are mainly in the domains of AI, brain–computer interface, and computer vision.
Pradyut Nath is a final year student in the Computer Science & Engineering Department, pursuing a BTech degree at Meghnad Saha Institute of Technology, Kolkata, India. He is an active member of IEEE & IEEE Computer Society. His research interests are mainly in the domains of deep learning and computer vision.
Saptarshi Biswas obtained his B. Tech in computer science and engineering from the Department of Computer Science & Engineering at Meghnad Saha Institute of Technology, Kolkata, India. He is also an active member of IEEE, IEEE Computer Society, and ACM. His current research interests include AI, computational biology, memory technology, molecular computing, and the like. He is currently a PhD student at the Department of Computer Science at Iowa State University, Ames.
Subhrapratim Nath is currently head and assistant professor of the Computer Science and Engineering Department, Meghnad Saha Institute of Technology, India. He received his B. Tech. degree in electronics and telecommunication engineering and M. Tech degree in software engineering. He is currently pursuing a PhD in the Department of Computer Science and Engineering at Jadavpur University, Kolkata. He is also a member of IEEE, IEEE Computer Society, IE (India), and CSI.
Ankur Ganguly, PhD, is presently the principal of Meghnad Saha Institute of Technology. His main research interests are in the areas of power quality, renewable energy, biomedical signal processing, and heart rate variability. He has published widely in international journals and conferences and has multiple patents to his credit. He is a fellow of IETE, IE & NBSP (India), lifetime member of ISTE & ISB, senior member of IEEE (USA), and member of CSI.
Disclosures
All the authors of this article declare no competing interests related to this research work.
Contributor Information
Sumagna Dey, Email: sumagna.dey@gmail.com.
Pradyut Nath, Email: pradyutnathradhae@gmail.com.
Saptarshi Biswas, Email: saptarshi.biswas9@gmail.com.
Subhrapratim Nath, Email: suvro.n@gmail.com.
Ankur Ganguly, Email: anksjc2002@yahoo.com.
References
- 1.Suh K. N., Kain K. C., Keystone J. S., “Malaria,” Can. Med. Assoc. J. 170(11), 1693–1702 (2004). 10.1503/cmaj.1030418 [DOI] [PMC free article] [PubMed] [Google Scholar]
- 2.World Health Organization, “Malaria,” https://www.who.int/news-room/fact-sheets/detail/malaria (accessed 10 November 2020).
- 3.Mohammadkhani M., Khanjani N., Sheikhzadeh B. B. K., “The relation between climatic factors and malaria incidence in Kerman, South East of Iran,” Parasite Epidemiol. Control 1(3), 205–210 (2016). 10.1016/j.parepi.2016.06.001 [DOI] [PMC free article] [PubMed] [Google Scholar]
- 4.Tse E. G., Korsik M., Todd M.H., “The past, present and future of anti-malarial medicines,” Malaria J. 18(93), 1–21 (2019). 10.1186/s12936-019-2724-z [DOI] [PMC free article] [PubMed] [Google Scholar]
- 5.Rajaraman S., Jaeger S., Antani S. K., “Performance evaluation of deep neural ensembles toward malaria parasite detection in thin-blood smear images,” PeerJ 7, e6977 (2019). 10.7717/peerj.6977 [DOI] [PMC free article] [PubMed] [Google Scholar]
- 6.Shin H., et al. , “Deep convolutional neural networks for computer-aided detection: CNN architectures, dataset characteristics and transfer learning,” IEEE Trans. Med. Imaging 35(5), 1285–1298, (2016). 10.1109/TMI.2016.2528162 [DOI] [PMC free article] [PubMed] [Google Scholar]
- 7.Ker J., et al. , “Deep learning applications in medical image analysis,” IEEE Access 6, 9375–9389 (2018). 10.1109/ACCESS.2017.2788044 [DOI] [Google Scholar]
- 8.Díaz G., González F. A., Romero E., “A semi-automatic method for quantification and classification of erythrocytes infected with malaria parasites in microscopic images,” J. Biomed. Inf. 42(2), 298–307 (2009). 10.1016/j.jbi.2008.11.005 [DOI] [PubMed] [Google Scholar]
- 9.Qin B., et al. , “Malaria cell detection using evolutionary convolutional deep networks,” in Comput., Commun. and IoT Appl., pp. 333–336 (2019). 10.1109/ComComAp46287.2019.9018770 [DOI] [Google Scholar]
- 10.Nugroho H. A., Akbar S. A., Murhandarwati E. E. H., “Feature extraction and classification for detection malaria parasites in thin blood smear,” in 2nd Int. Conf. Inf. Technol., Comput., and Electr. Eng., Semarang, pp. 197–201 (2015). 10.1109/ICITACEE.2015.7437798 [DOI] [Google Scholar]
- 11.Reddy A. S. B., Juliet D. S., “Transfer learning with ResNet-50 for Malaria cell-image classification,” in Int. Conf. Commun. and Signal Process., pp. 945–949 (2019). 10.1109/ICCSP.2019.8697909 [DOI] [Google Scholar]
- 12.Jaeger S., “Malaria datasets,” https://lhncbc.nlm.nih.gov/publication/pub9932 (accessed 18 Aug 2020).
- 13.Tan C., et al. , “A survey on deep transfer learning,” Lect. Notes Comput. Sci. 11141, 270–279 (2018). 10.1007/978-3-030-01424-7_27 [DOI] [Google Scholar]
- 14.Dey S, et al. , “Deep Greedy Network: a tool for medical diagnosis on exiguous dataset of COVID-19,” in Int. Conf. Converg. Eng., pp. 340–344 (2020). 10.1109/ICCE50343.2020.9290715 [DOI] [Google Scholar]
- 15.Vijayalakshmi A., Rajesh K. B., “Deep learning approach to detect malaria from microscopic images,” Multimedia Tools Appl. 79, 15297–15317 (2020). 10.1007/s11042-019-7162-y [DOI] [Google Scholar]
- 16.Grimm L. J., Zhang J., Mazurowski M. A., “Computational approach to radiogenomics of breast cancer: luminal A and luminal B molecular subtypes are associated with imaging features on routine breast MRI extracted using computer vision algorithms,” J. Magn. Reson. Imaging 42(4), 902–907(2015). 10.1002/jmri.24879 [DOI] [PubMed] [Google Scholar]
- 17.Vas M., Dessai A., “Lung cancer detection system using lung CT image processing,” in Int. Conf. Comput., Commun., Control and Autom., Pune, pp. 1–5 (2017). 10.1109/ICCUBEA.2017.8463851 [DOI] [Google Scholar]
- 18.Hamad Y. A., Simonov K., Naeem M. B., “Brain’s tumor edge detection on low contrast medical images,” in 1st Annu. Int. Conf. Inf. and Sci., Fallujah, pp. 45–50 (2018). 10.1109/AiCIS.2018.00021 [DOI] [Google Scholar]
- 19.Deperlıoğlu Ö., Köse U., “Diagnosis of diabetic retinopathy by using image processing and convolutional neural network,” in 2nd Int. Symp. Multidiscipl. Stud. and Innov. Technol., Ankara, pp. 1–5 (2018). 10.1109/ISMSIT.2018.8567055 [DOI] [Google Scholar]
- 20.Mishra M., Srivastava M., “A view of artificial neural network,” in Int. Conf. Adv. Eng. Technol. Res., Unnao, pp. 1–3 (2014). 10.1109/ICAETR.2014.7012785 [DOI] [Google Scholar]
- 21.Chang C., “Deep and shallow architecture of multilayer neural networks,” IEEE Trans. Neural Networks Learn. Syst. 26(10), 2477–2486 (2015). 10.1109/TNNLS.2014.2387439 [DOI] [PubMed] [Google Scholar]
- 22.Sharma P., Singh A., “Era of deep neural networks: a review,” in 8th Int. Conf. Comput., Commun. and Networking Technol., Delhi, pp. 1–5 (2017). 10.1109/ICCCNT.2017.8203938 [DOI] [Google Scholar]
- 23.Albawi S., Mohammed T. A., Al-Zawi S., “Understanding of a convolutional neural network,” in Int. Conf. Eng. and Technol., Antalya, pp. 1–6 (2017). 10.1109/ICEngTechnol.2017.8308186 [DOI] [Google Scholar]
- 24.Mikołajczyk A., Grochowski M., “Data augmentation for improving deep learning in image classification problem,” in Int. Interdiscipl. PhD Workshop, Swinoujście, pp. 117–122 (2018). 10.1109/IIPHDW.2018.8388338 [DOI] [Google Scholar]
- 25.Ciregan D., Meier U., Schmidhuber J., “Multi-column deep neural networks for image classification,” in IEEE Conf. Comput. Vision and Pattern Recognit., Providence, RI, pp. 3642–3649 (2012). 10.1109/CVPR.2012.6248110 [DOI] [Google Scholar]
- 26.Bluche T., Ney H., Kermorvant C., “Feature extraction with convolutional neural networks for handwritten word recognition,” in 12th Int. Conf. Doc. Anal. and Recognit., Washington, DC, pp. 285–289 (2013). 10.1109/ICDAR.2013.64 [DOI] [Google Scholar]
- 27.Lin Y., Jung T., “Improving EEG-based emotion classification using conditional transfer learning,” Front. Hum. Neurosci. 11, 1–11 (2017). 10.3389/fnhum.2017.00334 [DOI] [PMC free article] [PubMed] [Google Scholar]
- 28.He K., et al. , “Deep residual learning for image recognition,” in IEEE Conf. Comput. Vision and Pattern Recognit., Las Vegas, pp. 770–778 (2016). 10.1109/CVPR.2016.90 [DOI] [Google Scholar]
- 29.Simonyan K., Zisserman A., “Very deep convolutional networks for large-scale visual recognition,” arXiv:1409.1556v6 [cs.CV] (2015).
- 30.Liu Y., et al. , “Image classification based on convolutional neural networks with cross-level strategy,” Multimedia Tools Appl. 76, 11065–11079 (2017). 10.1007/s11042-016-3540-x [DOI] [Google Scholar]
- 31.Nguyen L. D., et al. , “Deep CNNs for microscopic image classification by exploiting transfer learning and feature concatenation,” in IEEE Int. Symp. Circuits and Syst., Florence, pp. 1–5 (2018). 10.1109/ISCAS.2018.8351550 [DOI] [Google Scholar]
- 32.Hara K., Kataoka H., Satoh Y., “Can spatiotemporal 3D CNNs retrace the history of 2D CNNs and ImageNet?” in IEEE/CVF Conf. Comput. Vision and Pattern Recognit., Salt Lake City, Utah, pp. 6546–6555 (2018). 10.1109/CVPR.2018.00685 [DOI] [Google Scholar]
- 33.Li P., et al. , “Bi-modal learning with channel-wise attention for multi-label image classification,” IEEE Access 8, 9965–9977 (2020). 10.1109/ACCESS.2020.2964599 [DOI] [Google Scholar]
- 34.Buffet P. A., et al. , “The pathogenesis of Plasmodium falciparum malaria in humans: insights from splenic physiology,” Blood 117(2), 381–392 (2011). 10.1182/blood-2010-04-202911 [DOI] [PMC free article] [PubMed] [Google Scholar]
- 35.Simonyan K., Zisserman A., “Adam: a method for stochastic optimization,” arXiv:1412.6980v9 [cs.LG] (2017).
- 36.Nayak S., Kumar S., Jangid M., “Malaria detection using multiple deep learning approaches,” in 2nd Int. Conf. Intell. Commun. and Comput. Tech., Jaipur, India, pp. 292–297 (2019). 10.1109/ICCT46177.2019.8969046 [DOI] [Google Scholar]
- 37.Mushabe M. C., Dendere R., Douglas T. S., “Automated detection of malaria in Giemsa-stained thin blood smears,” in 35th Annu. Int. Conf. IEEE Eng. in Med. and Biol. Soc., pp. 3698–3701 (2013). 10.1109/EMBC.2013.6610346 [DOI] [PubMed] [Google Scholar]


