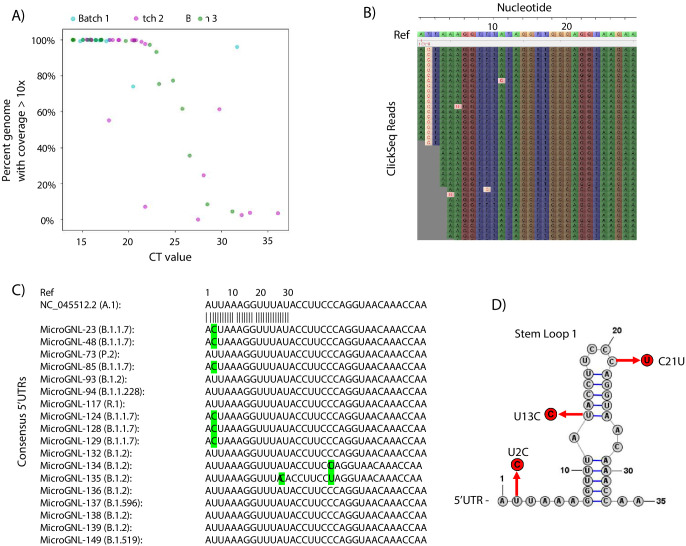
Figure 6. Tiled-ClickSeq for surveillance of SARS-CoV-2 from nasopharyngeal (NP) swabs collected during routine diagnostics of COVID19 at UTMB.
(A) The percent genome coverage with greater than 10 reads is plotted as a function of the measured CT value (x-axis) for each clinical sample sequenced. Each point is colour-coded according to the batch of NGS libraries synthesized. (B) Sequence reads for one of the SARS-CoV-2 samples from the B.1.1.7 lineage are illustrated using Tablet sequence viewer to indicate the U to C transition at nt 2 (U2C) of the SARS-CoV-2 genome. (C) Sequence alignments of the 5’UTR of the consensus genomes of 18 clinical samples assayed illustrates the U2C SNVs found in each B.1.1.7 variant as well as a U13C and C21U in two other B.1.2 variants. (D) The structure of the first 35 nts of the SARS-CoV-2 5’UTR is illustrated which contains Stem Loop 1. The three SNVs identified in the consensus genomes of clinical samples are indicated.


