Abstract
In Africa, most rapid diagnostic tests (RDTs) for falciparum malaria recognize histidine-rich protein 2 antigen. Plasmodium falciparum parasites lacking histidine-rich protein 2 (pfhrp2) and 3 (pfhrp3) genes escape detection by these RDTs, but it is not known whether these deletions confer sufficient selective advantage to drive rapid population expansion. By studying blood samples from a cohort of 12,572 participants enroled in a prospective, cross-sectional survey along Ethiopia’s borders with Eritrea, Sudan and South Sudan using RDTs, PCR, an ultrasensitive bead-based immunoassay for antigen detection and next-generation sequencing, we estimate that histidine-rich protein 2-based RDTs would miss 9.7% (95% confidence interval 8.5–11.1) of P. falciparum malaria cases owing to pfhrp2 deletion. We applied a molecular inversion probe-targeted deep sequencing approach to identify distinct subtelomeric deletion patterns and well-established pfhrp3 deletions and to uncover recent expansion of a singular pfhrp2 deletion in all regions sampled. We propose a model in which pfhrp3 deletions have arisen independently multiple times, followed by strong positive selection for pfhrp2 deletion owing to RDT-based test-and-treatment. Existing diagnostic strategies need to be urgently reconsidered in Ethiopia, and improved surveillance for pfhrp2 deletion is needed throughout the Horn of Africa.
Subject terms: Malaria, Structural variation, Diagnostic markers
A prospective, cross-sectional survey of 12,572 participants in Ethiopia reveals that malaria diagnostics miss almost 10% of cases owing to a gene deletion in Plasmodium falciparum that is under positive selection.
Main
Plasmodium falciparum strains that evade diagnosis by RDTs represent a major threat to malaria control and elimination efforts1,2. Malaria RDTs detect antigens produced by Plasmodium parasites, including P. falciparum histidine-rich protein 2 (HRP2), parasite lactate dehydrogenase (LDH) and aldolase. HRP2 has advantages over other biomarkers because of its abundance in the bloodstream, repetitive binding epitopes and falciparum-specificity3–5. Most HRP2-based RDTs also exhibit some cross-reactivity to a closely related protein (HRP3)6. Of the 345 million RDTs sold annually, HRP2-based RDTs are the predominant malaria diagnostic test, the majority of which are deployed throughout sub-Saharan Africa7.
Deletion mutations involving the histidine-rich protein 2 and/or 3 (pfhrp2/3) genes allow parasite strains to escape HRP2-based RDT detection8,9. First described in clinical samples from Peru in 2010, these subtelomeric deletions on chromosomes 8 (pfhrp2) and 13 (pfhrp3) are frequently large (≥20 kb), encompass multiple genes and are difficult to study using existing methods8,10. Improved PCR and serological approaches can be used to increase confidence in deletion prevalence estimates11–13, but our understanding of the evolutionary history of pfhrp2/3-deleted P. falciparum is limited and largely informed by analysis of a small number of microsatellite markers14–16. Recent genomic analyses have begun to expand our understanding of pfhrp2/3-deleted P. falciparum17–19 but continue to be hindered by the challenges of assembling the highly repetitive and paralogous sequences of P. falciparum subtelomeres20. New tools are needed to support surveillance of pfhrp2/3 deletions, determine their true prevalence and understand the forces impacting their evolution and spread.
‘Diagnostic-resistant’ pfhrp2/3-deleted parasites have now been observed in multiple sites across Africa. Reports from 2017–2018 prompted calls for urgent surveillance in affected regions, including countries in the Horn of Africa like Ethiopia14,21–26. Ethiopia is Africa’s second most-populous country, and around 60% of its population is at risk of malaria exposure27. Plasmodium falciparum infection accounts for the majority of malaria deaths and approximately 70% of all cases27,28. RDTs were first introduced in Ethiopia in 2004, and the country’s current test–treat–track strategy requires parasitological confirmation either by quality microscopy or RDT before antimalarial treatment29. Plasmodium falciparum–Plasmodium vivax (HRP2/Pv-specific-LDH) combination RDTs are the sole diagnostic test used in most settings. Over the past decade, Ethiopia has achieved remarkable progress in the fight against malaria through strong preventative and case management interventions, including engagement of health extension workers to provide diagnostic services at a local level29. Reports of highly prevalent pfhrp2/3-deleted parasites in neighbouring Eritrea suggest that these gains could be threatened14,22. Rapid assessment of the epidemiology of pfhrp2/3 deletions in Ethiopia and surrounding regions is required to determine whether a change in malaria diagnostic testing policy is warranted.
Using the largest prospective study of pfhrp2/3-deleted P. falciparum performed so far, we apply genomic tools to determine the genetic epidemiology of pfhrp2/3-deleted P. falciparum in sites spanning Ethiopia’s borders with Eritrea, Sudan and South Sudan. In this study, based on the World Health Organization’s (WHO) pfhrp2/3 deletion surveillance protocol released in 2018 to encourage a harmonized and representative approach to pfhrp2/3 deletion surveillance and accurate reporting30, we confirm deletions using multiple PCR assays13, an ultrasensitive bead-based immunoassay for antigen detection12, whole-genome sequencing (WGS)31,32 and/or molecular inversion probe (MIP) deep sequencing33. Using a new MIP panel designed for high-throughput pfhrp2/3 genotyping, we map and categorize deletion breakpoints and evaluate their flanking regions for evidence of recent evolutionary pressure favouring pfhrp2/3-deleted parasites.
Results
Study population and RDT results
A total of 12,572 study participants (56% male, 44% female) between the ages of 0 and 99 years who presented with one or more of symptoms consistent with malaria at 108 health facilities in the Amhara, Tigray and Gambella regions between November 2017 and June 2018 were enroled (Table 1). Median participant age was 19 years (interquartile range (IQR) 8–30). From the same fingerprick, participants were tested with two RDTs, including the routine HRP2/Pv-specific-LDH RDT combination test (CareStart Pf/Pv RDT, Access Bio, catalogue no. RM VM-02571) and the survey HRP2/Pf-specific-LDH RDT (SD Bioline Malaria Ag P.f. RDT, Alere, catalogue no. 05FK90, lot no. 05FDC024A).
Table 1.
Characteristics of study participants and RDT results
| Amhara | Gambella | Tigray | Overall | |
|---|---|---|---|---|
| Participants, n | 3,879 | 2,335 | 6,357 | 12,572 |
| Age, median years (IQR) | 20 (10–28) | 12 (5–19) | 21 (9–37) | 19 (8–30) |
| Female, n (%) | 1,492 (38.5) | 1,055 (45.2) | 3,008 (47.3) | 5,555 (44.2) |
| Location, n (%) | ||||
| Rural | 2,350 (60.6) | 923 (39.5) | 4,445 (69.9) | 7,718 (61.4) |
| Urban | 1,282 (33.0) | 82 (3.5) | 1,609 (25.3) | 2,973 (23.6) |
| Missing | 247 (6.4) | 1,330 (57.0) | 303 (4.8) | 1,881 (15.0) |
| Fever, n (%) | 3,607 (93.0) | 2,255 (96.6) | 5,593 (88.0) | 11,455 (91.1) |
| CareStart RDT, n (%) | ||||
| HRP2+, Pv-LDH+ | 59 (1.5) | 509 (21.8) | 25 (0.4) | 593 (4.7) |
| HRP2+ only | 1,053 (27.1) | 165 (7.1) | 507 (8.0) | 1,725 (13.7) |
| Pv-LDH+ only | 241 (6.2) | 11 (0.5) | 338 (5.3) | 590 (4.7) |
| Negative | 2,518 (64.9) | 1,650 (70.7) | 5,486 (86.3) | 9,654 (76.8) |
| Invalid | 8 (0.2) | 0 (0.0) | 1 (0.0) | 9 (0.1) |
| SD Bioline RDT, n (%) | ||||
| HRP2+, Pf-LDH+ | 719 (18.5) | 552 (23.6) | 276 (4.3) | 1,547 (12.3) |
| HRP2+ only | 297 (7.7) | 106 (4.5) | 201 (3.2) | 604 (4.8) |
| Pf-LDH+ only | 239 (6.2) | 11 (0.5) | 168 (2.6) | 418 (3.3) |
| Negative | 2,609 (67.3) | 1,665 (71.3) | 5,705 (89.7) | 9,979 (79.4) |
| Invalid | 15 (0.4) | 0 (0.0) | 2 (0.0) | 17 (0.1) |
Pv-LDH, P. vivax parasite LDH; Pf-LDH, P. falciparum parasite LDH.
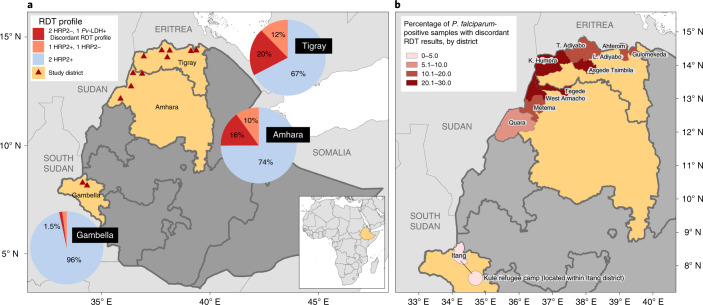
Overall, 2,714 (22%) study participants were P. falciparum-positive by at least one RDT (any HRP2- or Pf-LDH-positive band); among these, 361 (13.3%, 95% confidence interval (CI) 12.1–14.7) had a discordant RDT profile suggestive of pfhrp2/3-deleted P. falciparum infection, which was defined as HRP2-negative by both RDTs but Pf-LDH-positive. Participants with positive or discordant RDT profiles were treated according to national guidelines. Of the study participants, 1,183 (9.4%) were P. vivax-positive by the CareStart RDT. Among the 2,714 samples P. falciparum-positive by RDT, the northern region of Tigray had the highest proportion of infections with discordant RDT profiles at 140/689 (20.4%, 95% CI 17.5–23.7), followed by Amhara with 211/1342 (15.8%, 95% CI 13.9–17.8) and Gambella with 10/683 (1.5%, 95% CI 0.7–2.8), as shown in Fig. 1.
Fig. 1. Distribution of P. falciparum-positive RDT results and discordant profiles suggestive of pfhrp2/3 gene deletions.
a, Aggregated results from both RDTs, CareStart Pf/Pv (HRP2/Pv-LDH) RDT and SD Bioline Malaria Ag P.f. (HRP2/Pf-LDH) RDT, displayed by region for all P. falciparum infections (n = 2,714). The ‘2 HRP2−, 1 Pf-LDH+’ discordant RDT profile indicates potential infection by pfhrp2/3-deleted P. falciparum. Triangles represent the enrolment sites, including 11 districts and the Kule refugee camp within the Itang district in Gambella. b, Percentage of study participants identified with P. falciparum infection by RDT who had the discordant RDT profile, by district.
Pfhrp2/3 deletion PCR genotyping
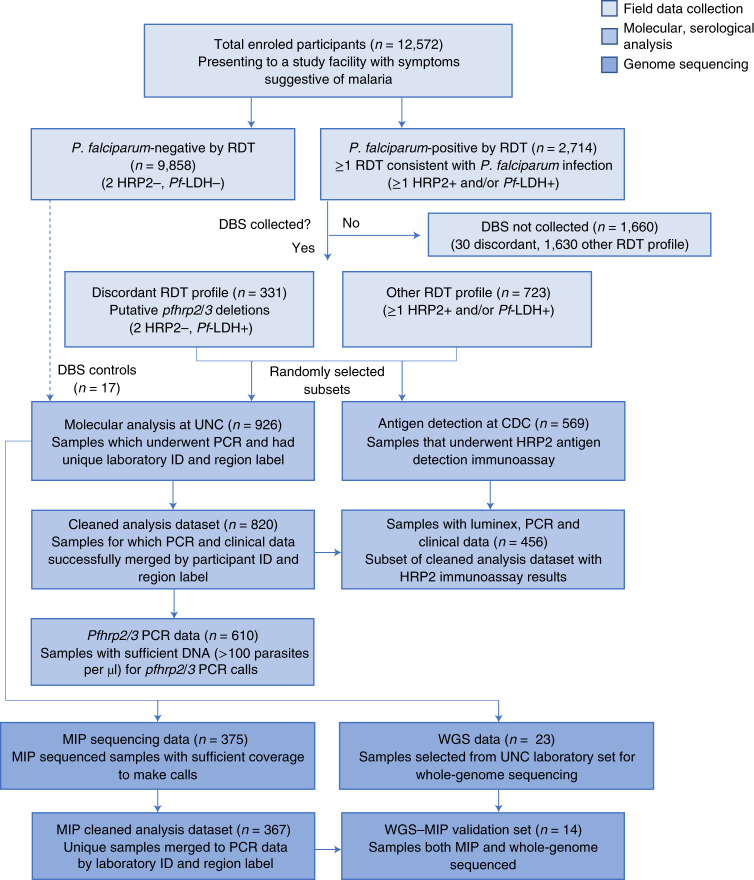
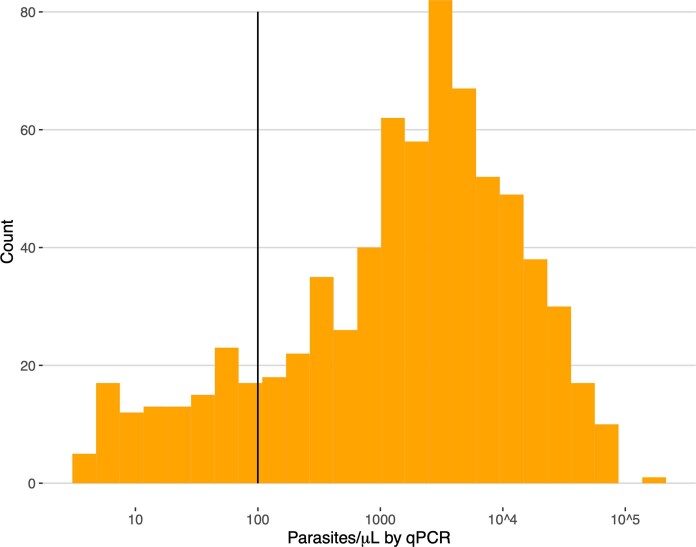
Eight hundred and twenty samples with complete demographic and clinical data from Amhara (n = 524), Tigray (n = 225) and Gambella (n = 71) underwent molecular analysis. These samples were collected from participants with the discordant RDT profile and a subset of participants with other RDT results (Fig. 2 and Supplementary Note). Further analysis was restricted to the 610 samples with >100 parasites per µl to avoid misclassification of pfhrp2/3 deletions due to low parasitaemia (Extended Data Fig. 1); 176 samples (28.9%) had the discordant RDT profile.
Fig. 2. Study samples and assays performed.
Samples were randomly selected by EPHI for molecular and antigen assays and for sequencing to expedite analyses.
Extended Data Fig. 1. Parasite density distribution.
Pfldh quantitative PCR (qPCR) results used to assess parasite density and determine which samples were eligible for pfhrp2/3 deletion genotyping using a series of PCR assays. Pfhrp2/3 deletions were only called in 610 samples with >100 parasites/µL (solid line).
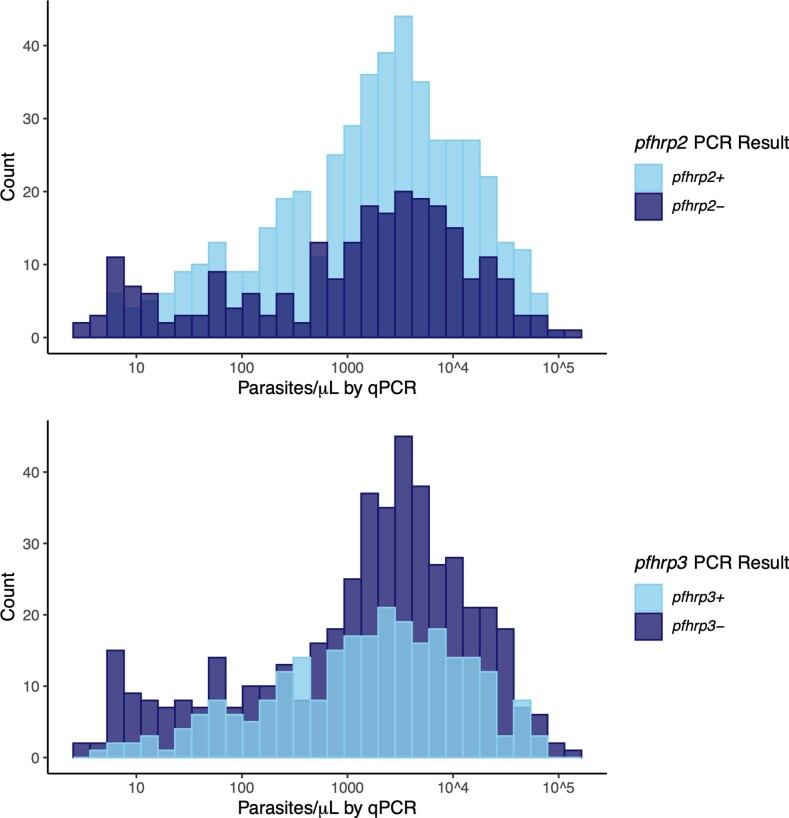
Infection by pfhrp2/3-negative parasites was common among these 610 participants when assessed by PCR, with 355 (58%, 95% CI 54–62) lacking detectable pfhrp2 and/or pfhrp3, and 136 (22%, 95% CI 19–26) lacking both pfhrp2 and pfhrp3. For those lacking only one gene, pfhrp3-negative infections (192 (31%, 95% CI 28–35) pfhrp2+/pfhrp3−) were more prevalent than pfhrp2-negative infections (27 (4.4%; 95% CI 3–6) pfhrp2−/pfhrp3+). We observed expected agreement between the results of pfhrp2/3 PCR assays, RDTs and a bead-based HRP2 immunoassay applied to a randomly selected subset of samples (Table 2, Extended Data Fig. 2 and Supplementary Note). No associations between pfhrp2/3 PCR result and age, sex or parasitaemia were identified (Supplementary Table 1 and Extended Data Fig. 3).
Table 2.
Assay results
| RDT results | |||
|---|---|---|---|
| 2 HRP2+, 1 Pf-LDH+ | 2 HRP2−, 1 Pf-LDH+ | 1 HRP2+, 1 HRP2− | |
| PCR, n (%) | 379 | 176 | 47 |
| pfhrp2+/3+ | 210 (55) | 20 (11) | 19 (41) |
| pfhrp2−/3− | 9 (2) | 114 (65) | 10 (22) |
| pfhrp2−/3+ | 7 (2) | 14 (8) | 5 (11) |
| pfhrp2+/3− | 152 (40) | 28 (16) | 12 (26) |
| HRP2 immunoassay, n (%) | 243 | 167 | 42 |
| HRP2+ | 224 (92) | 40 (24) | 30 (71) |
| HRP2− | 19 (8) | 127 (76) | 12 (29) |
| MIP, n (%) | 198 | 104 | 30 |
| pfhrp2+/3+ | 77 (39) | 5 (5) | 5 (17) |
| pfhrp2−/3− | 10 (5) | 84 (81) | 10 (33) |
| pfhrp2−/3+ | 3 (2) | 1 (1) | 4 (13) |
| pfhrp2+/3− | 108 (55) | 14 (13) | 11 (37) |
| WGS, n (%)a | 0 | 22 | 0 |
| pfhrp2+/3+ | NA | 0 (0) | NA |
| pfhrp2−/3− | NA | 22 (100) | NA |
| pfhrp2−/3+ | NA | 0 (0) | NA |
| pfhrp2+/3− | NA | 0 (0) | NA |
PCR, bead-based antigen immunoassay, MIP deep sequencing and WGS for samples P. falciparum-positive by RDT are shown.
aZero median WGS coverage across 1,000 bp windows encompassing pfhrp2 or pfhrp3, in samples with clinical data. NA, not applicable.
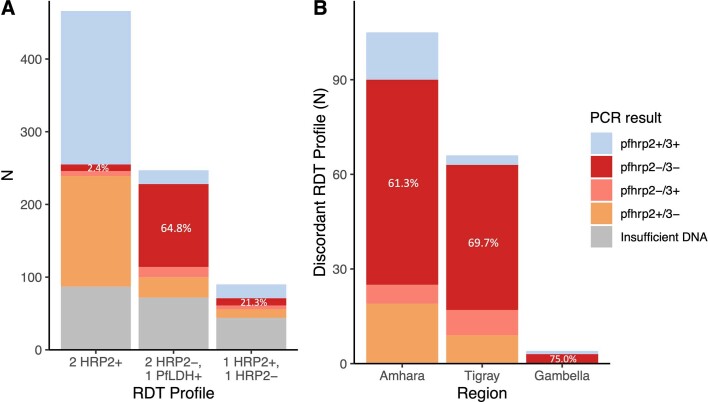
Extended Data Fig. 2. Pfhrp2 and pfhrp3 PCR results by RDT profile.
A) Concordance between RDT profile and PCR pfhrp2/3 result for 602 P. falciparum samples with >100 parasites/µL. b) Pfhrp2/3 PCR results for participants with the discordant RDT profile and sufficient DNA for molecular analysis (n = 176), by study region.
Extended Data Fig. 3. Pfhrp2/3 PCR results versus qPCR parasite density.
Comparison of pfhrp2 (top) and pfhrp3 (bottom) PCR results versus pfldh qPCR parasite densities. Note that final pfhrp2/3 PCR genotyping calls were only made in samples with qPCR parasite densities >100 parasites/µL and a positive P. falciparum beta-tubulin real-time PCR result to avoid misclassification of deletions in the setting of low DNA target concentrations.
Pfhrp2/3 deletion prevalence estimates
Incorporating RDT and PCR results, we estimated that 9.7% (95% CI 8.5–11.1) of all P. falciparum infections across all study sites would have false-negative HRP2-based RDT results owing to pfhrp2 deletion. Regional prevalence of false-negative RDTs due to pfhrp2-deleted parasites varied, with the highest estimates in Tigray (14.9%, 95% CI 12.5–17.7), followed by Amhara (11.5%, 95% CI 9.8–13.4) and Gambella (1.1%, 95% CI 0.6–2.0). Our prevalence estimates include only samples with both the discordant RDT profile and a pfhrp2-negative call by PCR. Parasites with a deletion of pfhrp2 but intact pfhrp3 and sufficient cross-reactive HRP3 to trigger a positive HRP2 band on either RDT are not included in these estimates. Thus, the estimated prevalence of false-negative RDT results caused by pfhrp2 deletions likely underestimates the true prevalence of pfhrp2-deleted parasites in this study.
Pfhrp2/3 deletion characterization using MIP sequencing
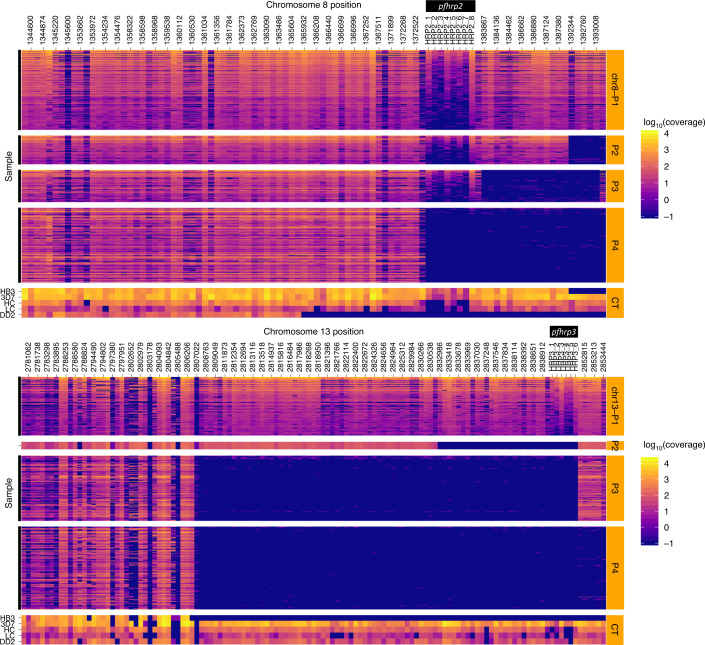
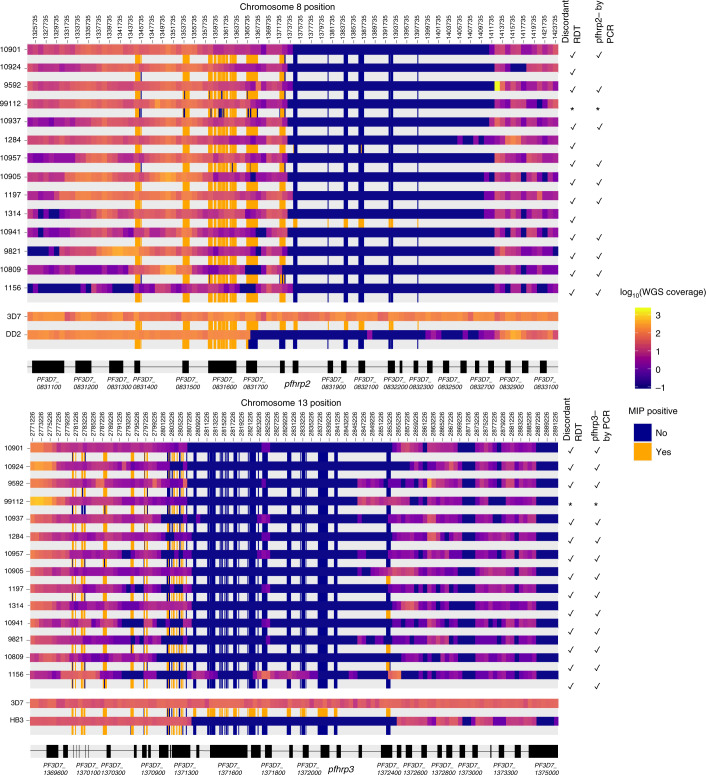
To enable mapping of pfhrp2/3 deletion regions and population genetic analyses in large-scale epidemiological studies, we developed a targeted panel of 241 MIPs for highly multiplexed deep sequencing of pfhrp2, pfhrp3 and flanking genes on chromosomes 8 and 13. Among P. falciparum PCR-positive samples collected from 926 participants and subjected to MIP capture and sequencing, 375 (40.5%) had sufficient depth-of-coverage to make high-confidence calls (Fig. 3). Analysis of variant-called MIP sequences confirmed mixed infections with complexity of infection ≥2 in only 45 (12%) participants; the majority (n = 330, 88%) were infected by a single P. falciparum strain. We compared RDT, PCR, HRP2 immunoassay, WGS and MIP sequencing results. Although differences between these approaches were apparent and expected due to differences in targets and methodologies, there was strong concordance overall between assays (Table 2, Fig. 4, Extended Data Fig. 4 and Supplementary Note).
Fig. 3. Deletion profiling using MIP sequencing of pfhrp2 (chromosome 8), pfhrp3 (chromosome 13) and flanking regions applied to 375 field samples.
Samples are grouped by subtelomeric structural profile, with control strains denoted CT, as labelled along the right y axis. LC (low concentration) and HC (high concentration) controls include mixtures of 1% HB3, 10% DD2, 89% 3D7 strains at densities of 250 and 1,000 parasites per µl, respectively. Columns represent each MIP target segment, rows represent individual samples and the colour scale represents log10(UMI) depth-of-coverage at each location. Columns are labelled by the midpoint of each probe’s target region.
Fig. 4. Comparison of MIP and WGS pfhrp2/3 deletion calls and breakpoint regions.
Among the 14 clinical samples subjected to both methods, each sample is represented by two adjacent rows representing WGS (top) and MIP (bottom) coverage results. WGS coverage is displayed as the log10 median number of aligned reads per 1 kb window. MIP results are coloured by whether each probe captured its target, with intervening regions not targeted in the MIP panel uncoloured. Sample numbers (lab_ID) are provided at left. The locations of pfhrp2, pfhrp3 and flanking genes are shown in black with non-genic regions in grey. The asterisk indicates that it could not be matched with PCR and RDT data.
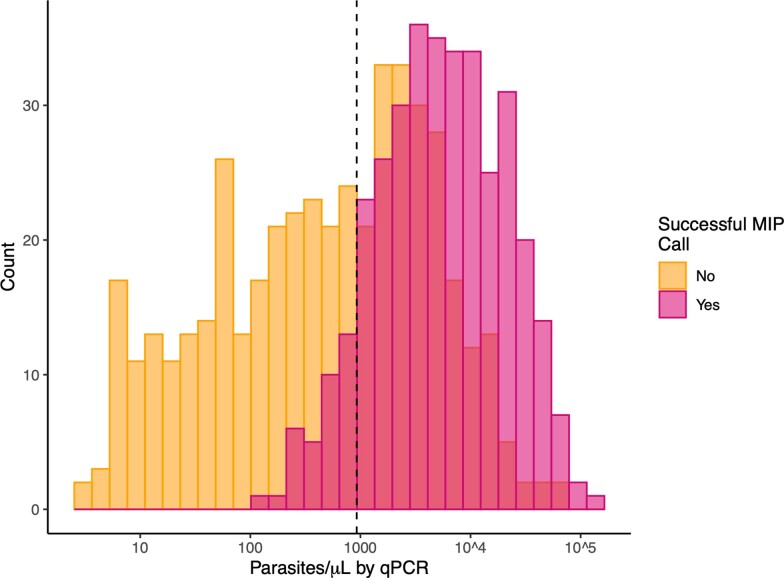
Extended Data Fig. 4. Successful MIP deletion calls versus qPCR parasite density.
Comparison of MIP call results and qPCR parasite densities suggests a project-specific threshold for MIP calling of approximately 925 p/µL of whole blood (dashed line).
Pfhrp2/3 deletion breakpoint profiling
Compared with PCR, bead-based immunoassay or RDT diagnosis, MIP sequencing was unique in its ability to reveal distinct subtelomeric structural profiles along chromosomes 8 and 13 into which samples could be categorized: three for pfhrp2+ samples (chr8-P1, chr8-P2 and chr8-P3), one for pfhrp2− (chr8-P4), one for pfhrp3+ (chr13-P1) and three for pfhrp3− (chr13-P2, chr13-P3 and chr13-P4) (Fig. 3). All pfhrp2− samples had the same subtelomeric structural profile (chr8-P4), although two other subtelomeric deletions were identified on chromosome 8 that did not involve pfhrp2 (chr8-P2, chr8-P3). These deletions involve members of the rifin and stevor gene families, as well as genes of unknown function.
The structural profile of most samples identified as pfhrp3− (chr13-P3 and chr13-P4) differed in the presence or absence of a segment of chromosome 13 directly telomeric to pfhrp3 (position 2,852,540 to 2,853,533) encoding a member of the acyl-coA synthetase family (PF3D7_1372400). All chr13-P3 and chr13-P4 deletions resulted in loss of genes with roles in red blood cell invasion (PF3D7_1371700, serine/threonine kinase and member of the FIKK family; PF3D7_1371600, erythrocyte binding-like protein 1 (EBL-1))34,35, whereas they were present in all chr13-P1 (pfhrp3-intact) parasites. The chr13-P2 deletion profile was observed in only one sample from Amhara’s Metema district. We did not observe an association between subtelomeric structural profile and the number of symptoms experienced by participants, geographic region or P. vivax co-infection (Extended Data Fig. 5, Supplementary Table 4 and Supplementary Note).
Extended Data Fig. 5. Disease severity by subtelomeric structural profile.
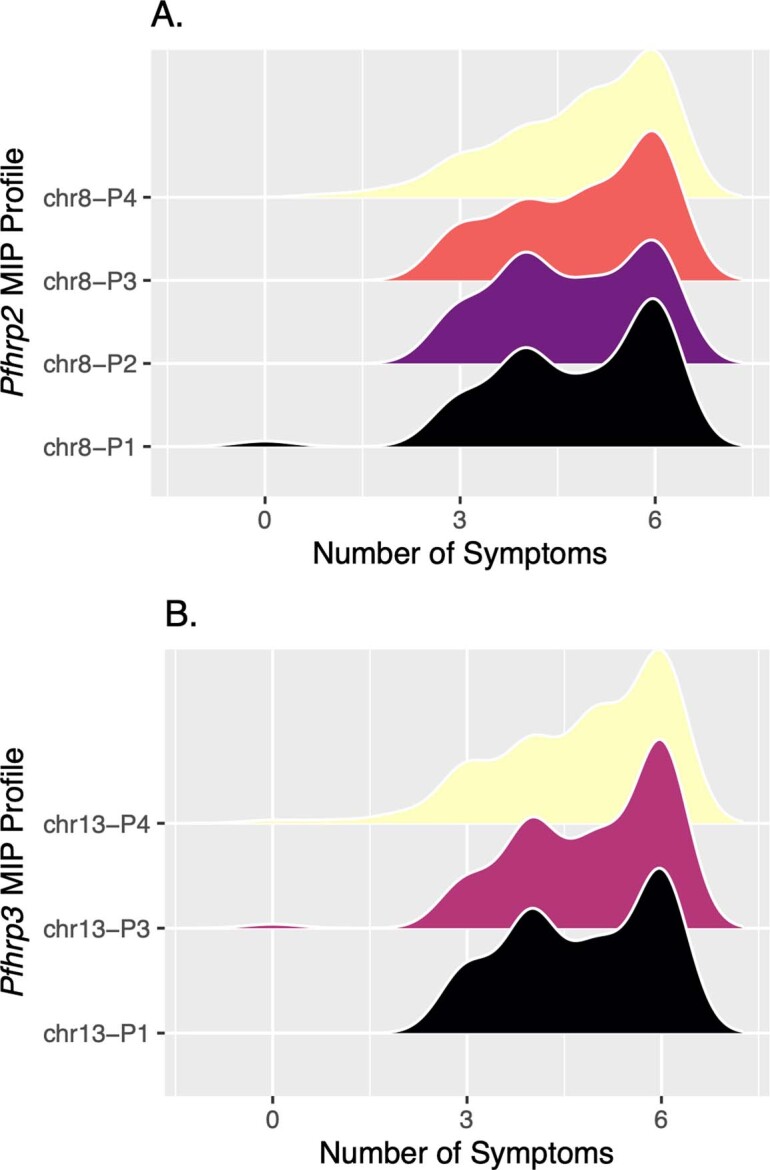
Smoothed distribution of disease severity for each of the broader deletion breakpoint haplotypes along chromosomes 8 (A) and 13 (B) identified by MIP genomic enrichment among MIP samples with matching clinical data (n = 338). The total number of symptoms with which participants presented was used to estimate disease severity, with all participants evaluated for: fever, headache, joint pain, feeling cold, nausea, and loss of appetite. Profile chr13-P2 was excluded due to its small sample size (n=1).
Analysis of 25 genomes from P. falciparum samples collected in Ethiopia in 2013 and 2015 and available in the MalariaGEN database (Extended Data Figs. 6 and 7) uncovered chromosome 13 subtelomeric structural profiles similar to those identified by MIP sequencing: 9 samples with coverage consistent with chr13-P3 (pfhrp3-deleted), 2 samples with chr13-P4 (pfhrp3-deleted) and 14 samples with chr13-P1 (pfhrp3-intact)19.
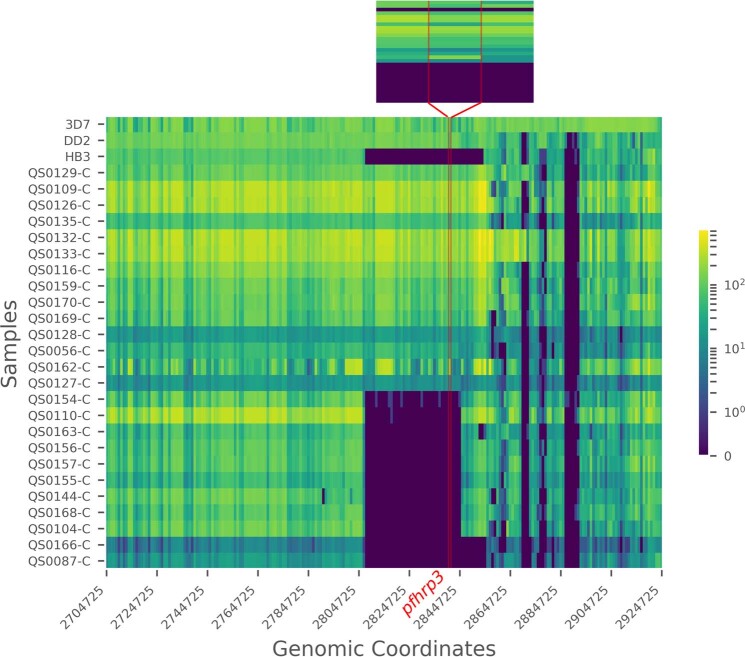
Extended Data Fig. 6. Chromosome 13 telomeric-end coverage (aligned reads/locus) plot of WGS control strains and 25 published Ethiopian genomes from 2013–2015 (MalariaGEN).
The location of pfhrp3 is indicated by vertical red lines. Inset showing pfhrp3 and 1 kilobase flanking genomic region. Large subtelomeric deletions containing pfhrp3 are apparent in the laboratory strain HB3, as well as 11 samples from Ethiopia.
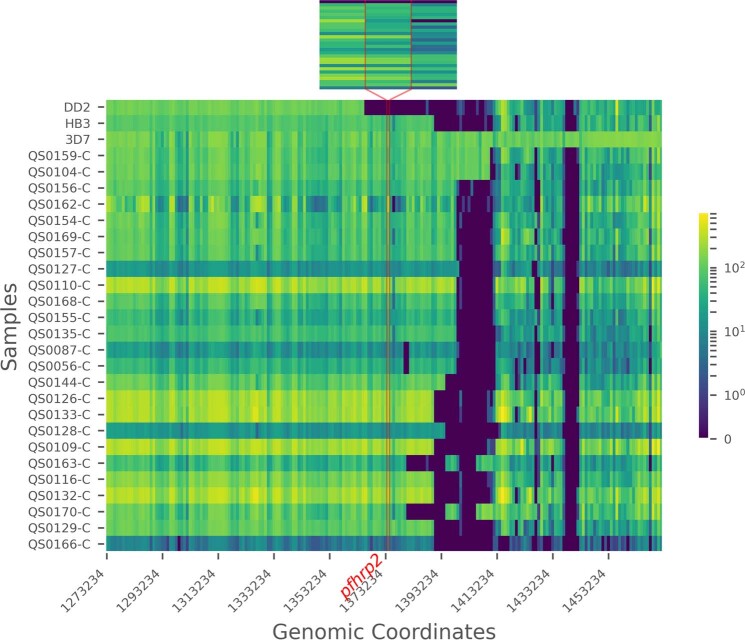
Extended Data Fig. 7. Chromosome 8 telomeric-end coverage (aligned reads/locus) plot of WGS control strains and 25 published Ethiopian genomes from 2013–2015 (MalariaGEN).
The location of pfhrp2 is indicated by vertical red lines. Inset showing pfhrp2 and 1 kilobase flanking genomic region. Large subtelomeric deletions compared to the reference strain 3D7 are apparent in most samples. None of the deletions involve pfhrp2 except the DD2 strain.
Genetic signatures of evolutionary selection
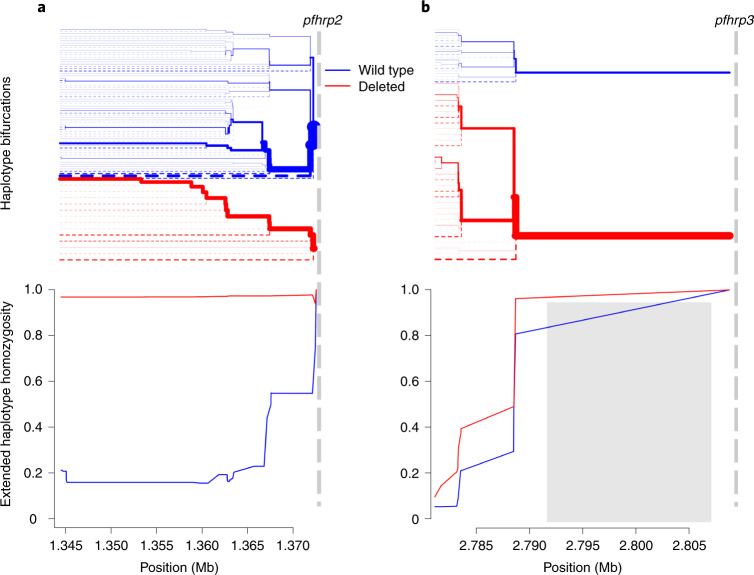
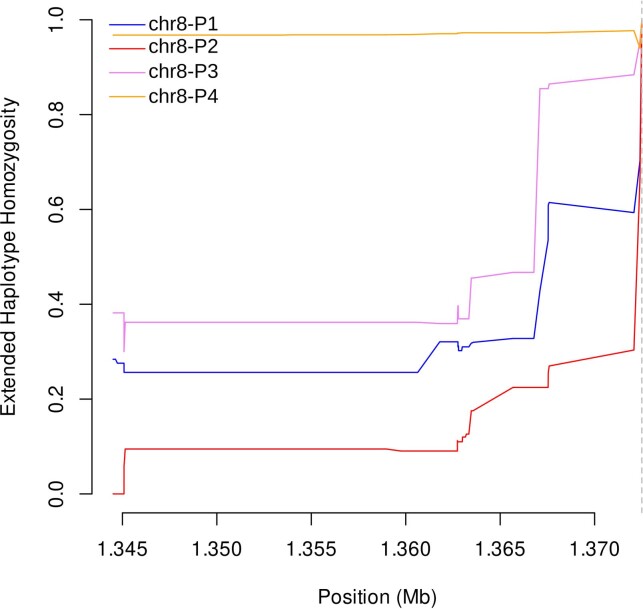
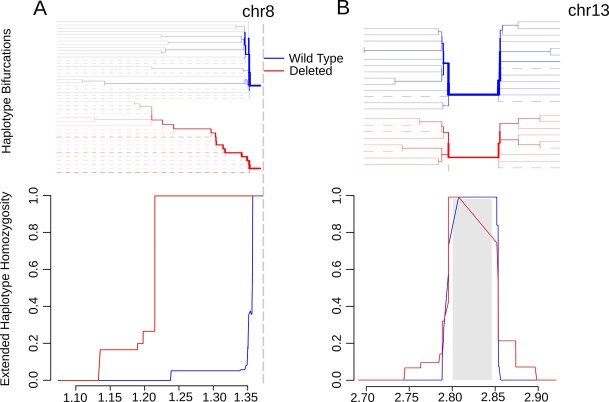
Extended haplotype homozygosity (EHH) statistics revealed signatures of recent positive selection in the flanking region centromeric to pfhrp2 deletions on chromosome 8 but not in flanking regions around pfhrp3 deletions on chromosome 13 (ref. 36). EHH remained very high for parasites with the pfhrp2 deletion (0.968) along the entire 28 kb analysed, whereas homozygosity around the pfhrp2-intact (wild-type) allele quickly broke down (Fig. 5a). A similar pattern was observed when deletion profiles were analysed separately; chr8-P4 EHH remained high and chr8-P1-P3 EHH broke down quickly (Extended Data Fig. 8). We further confirmed high EHH around the pfhrp2 deletion allele using WGS data. Comparing 23 whole-genome sequenced samples from this study and the 25 published MalariaGEN samples described above, we were able to extend our analysis and confirm an EHH length of >143 kb centromeric to the deletion (Extended Data Fig. 9a). These findings suggest a recent selective sweep, indicative of strong evolutionary pressure favouring pfhrp2-deleted P. falciparum parasites.
Fig. 5. Extended haplotype homozygosity and bifurcation diagrams.
a,b Extended haplotype homozygosity (bottom) and the bifurcation diagrams showing haplotype branching (top) centromeric to the pfhrp2 (a) and pfhrp3 (b) deletions based on MIP data. Vertical dashed lines indicate the centromeric end of deletions. No variant calls were made within the 15.5 kb region on chromosome 13 which is duplicated on chromosome 11, demarcated by the grey box (b). Mb, megabase.
Extended Data Fig. 8. Extended haplotype homozygosity centromeric to chromosome 8 subtelomeric structural profiles P1-P4 using MIP data.
The only pfhrp2-deleted profile (chr8-P4) showed sustained EHH, whereas EHH quickly broke down for the pfhrp2-intact profiles (P1-P3). A vertical dashed line on the right marks the centromeric end of the profile 4 (pfhrp2) deletion.
Extended Data Fig. 9. Extended haplotype homozygosity (bottom) and the bifurcation diagrams showing haplotype branching (top) centromeric to the pfhrp2 (A) and surrounding pfhrp3 (B) deletions based on WGS data.
Vertical dashed line indicating the centromeric end of the chromosome 8 deletion (a). Gray box demarcating the chromosome 13 deletion (b). Abbreviations: Mb, mega-base.
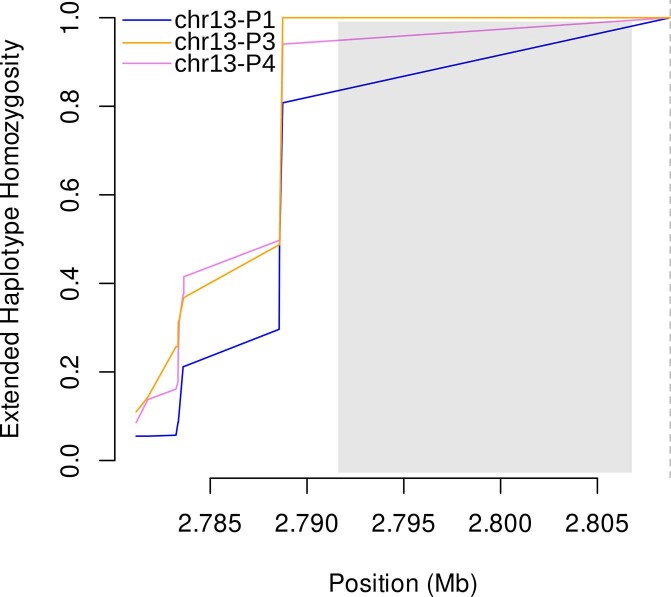
A different pattern was observed in the regions flanking pfhrp3 (Fig. 5b). EHH quickly decreased below 0.5 for pfhrp3 deletion alleles as well as the pfhrp3-intact allele within 1 kb of available single-nucleotide polymorphisms. When deletion profiles were analysed as separate alleles, the EHH pattern was similarly low for chr13-P1, -P3 and -P4 (Extended Data Fig. 10). Comparison of EHH around the pfhrp3-intact and P3-like pfhrp3 deletions using WGS data from the 25 MalariaGEN samples confirmed our finding that the EHH decreased quickly for both pfhrp3-intact and pfhrp3 deletion alleles (Extended Data Fig. 9b). Taken together, these findings suggest that each pfhrp3 deletion profile arose multiple times independently, and/or they have been present in the parasite population for sufficient time for homozygosity due to genetic hitchhiking to be degraded by recombination with different haplotypes.
Extended Data Fig. 10. Extended haplotype homozygosity centromeric to chromosome 13 subtelomeric structural profiles P1, P3 and P4 using MIP data.
Chr13-P2 profile was observed in only one sample and not included in the haplotype analysis. EHH quickly brown down for all profiles (P1: pfhrp3-intact, P3-P4: pfhrp3-deleted). A vertical dashed line on the right marks the centromeric end of the P3 and P4 deletions. No variants in the duplicated segment (gray box) were used in the EHH analysis.
Discussion
Using the largest prospective study of pfhrp2/3-deleted P. falciparum performed so far and complementary molecular, immunological and sequencing assays, we provide clear evidence that pfhrp2/3-deleted parasites are circulating in multiple sites along Ethiopia’s borders with Sudan and Eritrea. Analysis of flanking haplotypes suggests that the pfhrp2 deletion mutation emerged and recently expanded from a single origin, whereas pfhrp3 deletion mutations have existed for a longer time span and likely have multiple origins. As expected, we did not observe perfect concordance between RDT results, PCR, a bead-based immunoassay, WGS and MIP sequencing results. However, the preponderance of evidence from these diverse platforms provides robust confirmation of deletions and supports use of the WHO protocol for rapid pfhrp2/3 deletion surveillance30. This protocol provides standardized data collection, fieldwork and sampling methods that can be adapted to the local context and is intended to help programmes rapidly determine whether deployment of alternative diagnostics is needed. The prevalence of false-negative HRP2-based RDT results due to pfhrp2 deletions is estimated at 9.7% overall and up to 11.5% and 14.9% in the Amhara and Tigray regions, respectively.
These estimates exceed WHO minimum criteria (>5%) for a change in national diagnostic testing strategy. Pfhrp2/3-deleted parasites threaten recent progress made by Ethiopia’s malaria control and elimination programme, and raise concerns about the ongoing use of and exclusive reliance on HRP2-based RDTs in the region for falciparum malaria diagnosis. However, transition to alternative combination diagnostics is not straightforward given the poor performance of Pf-LDH-based RDTs during multiple rounds of WHO product testing and versus PCR in this study (Supplementary Note and Supplementary Table 11) and the challenges of conducting high-quality microscopy in the field37. Currently, only one combination Pf-LDH/Pv-LDH product suitable for Ethiopia is approved for purchase using Global Fund financing (https://www.theglobalfund.org/media/5891/psm_qadiagnosticsmalaria_list_en.pdf?u=636438486100000000).
Eritrea’s alarming reports of false-negative RDTs due to pfhrp2/3-deleted parasites prompted an immediate change in national diagnostic testing policy in 201614,38. Recent evidence from Sudan, Djibouti and Somalia suggests that the Horn of Africa may already be heavily affected by pfhrp2/3-deleted parasites39,40, although results from ongoing surveillance efforts are not yet publicly available. Within affected regions in Ethiopia, we observed spatial heterogeneity in P. falciparum RDT profiles by district, with prevalence of the discordant HRP2−, Pf-LDH+ RDT profile ranging from 1 to 30% (Supplementary Table 2). Although finer scale spatial analyses were not possible because of our health facility sampling approach, this finding is consistent with prior studies showing variation within countries and by region23. Differences in transmission intensity, treatment-seeking behaviour, diagnostic testing capacity and seasonality may account for some of the spatial variation in pfhrp2/3 deletion prevalence estimates16,41–43. Although the factors driving emergence of these parasites in some regions but not others remain poorly understood, our study suggests that pfhrp2-deleted parasites may have spread widely within Ethiopia from a single origin. This finding is consistent with early microsatellite analysis of pfhrp2/3-deleted strains in Eritrea, in which 30 of 31 (96.8%) pfhrp2-deleted strains fell into a single genetically related cluster14, and raises concern about clonal expansion of pfhrp2-deleted strains in the Horn of Africa.
Using a multifaceted approach, we validate the use of MIP sequencing for high-throughput pfhrp2/3 deletion genotyping, deletion profiling and population genetic analysis. Comparison of MIP sequencing with other approaches demonstrated that it can be used for cost-effective (approximately US$10–15 per sample) and scalable deletion genotyping in samples with parasite densities of approximately 1,000 parasites per µl. Although this threshold can probably be improved by additional sequencing of samples with inadequate sequencing depth-of-coverage, in this case, the equivalent of half a NextSeq 550 flow cell enabled visualization of deletion breakpoint regions and variant calling in P. falciparum’s subtelomeres in a large portion of samples, without the need for costly enrichment and WGS.
Based on analysis of MIP sequencing and available WGS data, we posit one potential model by which pfhrp2/3-deleted parasite populations may have evolved in the Horn of Africa. Findings from this study suggest that parasite populations with pfhrp3 deletions expanded in the more distant past and potentially arose multiple times independently, based on low EHH surrounding pfhrp3, multiple deletion profile patterns, the high overall frequency of pfhrp3-deleted parasites and their presence in older samples from 2013 in the MalariaGEN study. In this milieu, recent strong selection favouring parasites with deletions of pfhrp2 probably occurred due to ‘test–track–treat’ policies that rely on HRP2-based RDTs and allow parasites with deletions of both genes, or in some cases one of the two genes, to escape treatment. Implicit in this model is the assumption that forces apart from RDT-derived pressure are also driving the evolution of pfhrp2/3 deletions. Malaria due to pfhrp2+/3− parasites should be detectable by HRP2-based RDTs44. Further, pfhrp2/3-deleted parasites are highly prevalent in South America23, where RDT-based treatment decisions have never been common.
What other advantages might pfhrp2/3-deleted parasites have over those with intact genes? Our limited understanding of the biology of these deletions makes this question hard to answer. Several lines of enquiry may be relevant. (1) They may be better adapted to low transmission intensity settings than other strains. Pfhrp2/3-deleted parasites appear to be more common in regions with lower transmission and, presumably, lower complexities of infection, as in the current study42. However, this trend could also be an artefact of the assays used to detect them, that is, neither PCR, antigen immunoassays nor common sequencing methodologies are well suited to detect a pfhrp2/3-deleted strain when pfhrp2/3-intact strains have co-infected a human host. (2) Loss of pfhrp2/3 or flanking genes may alter parasite virulence. Evidence is accumulating that HRP2 plays a role in cerebral malaria and endothelial inflammation during severe malaria45,46. People infected by pfhrp2/3-deleted parasites may have less severe disease and therefore be less likely to seek treatment, increasing the likelihood of onward transmission. However, we cannot exclude the possibility that pfhrp2/3 are lost as a consequence of selection on other genes. For example, the flanking gene EBL-1 is almost uniformly lost in pfhrp3-deleted parasites in this cohort and appears to play a role during invasion of red blood cells35,47. Similarly, members of the rifin and stevor gene families with potential roles in parasite virulence were lost in the subtelomeric deletions observed in this study48,49. We did not observe evidence of an association between virulence and subtelomeric deletions in our cohort, but limited clinical data prevents us from assessing the hypothesis rigorously. (3) Loss of pfhrp2/3 or flanking genes may improve transmissibility to or from mosquitoes. To our knowledge, this phenomenon has not been studied. These and other hypotheses require experimental and improved epidemiological analyses. Regardless of the evolutionary forces at play, our findings strongly suggest that the evolution of pfhrp2/3-deleted parasites in Ethiopia was a multistep process that involved earlier expansion of pfhrp3- than pfhrp2-deleted parasite populations.
This study has several limitations. First, the study design prioritized evaluation of samples with discordant RDT results (HRP2− but Pf-LDH+) for rapid assessment of false-negative RDTs due to pfhrp2/3 deletions in the context of clinical treatment. This feature of the WHO protocol is intentional because it captures clinically important pfhrp2/3 deletions and enables real-time, efficient signalling to malaria control programmes of a potential problem. However, it also introduces selection bias that requires careful consideration when estimating the true prevalence of pfhrp2/3-deleted parasites. We overcame this limitation by using a conservative approach that incorporated both RDT and PCR data to estimate false-negative RDT results due to pfhrp2 deletions. This metric is relevant to control programmes, but does not capture asymptomatic or low parasite-density infections by pfhrp2/3-deleted parasites. Second, only a subset of samples underwent advanced analysis to expedite reporting, and clinical data were not available for all participants. This was not unexpected for a pragmatic field study of this size. We do not believe that it introduced sufficient bias into our prevalence estimates or population genetic analysis to change our conclusions. Third, we cannot comment on changes in selection pressure over time because the study was cross-sectional. Fourth, we only sampled three regions of Ethiopia, which is a diverse and populous country. The Federal Ministry of Health is now conducting a country-wide survey that will enable comparison of pfhrp2/3 deletions over time in select sites.
Our large prospective study, using established molecular and antigen detection methods, and a targeted sequencing approach show that phrp2/3-deleted P. falciparum is a common cause of false-negative RDT results in two regions of Ethiopia. Concerningly, these genomic tools reveal evidence of recent, strong selection for pfhrp2 deletion in the regions sampled. The selective pressures favouring pfhrp2-deleted parasites appear to have occurred on a background of pre-existing pfhrp3 deletions. Existing malaria control programmes in the region are threatened by expansion of these parasite strains, and prevalence estimates in Tigray and Amhara exceed WHO-recommended thresholds for RDT change. Surveillance has already informed decisions to deploy alternative malaria diagnostics in Eritrea and Djibouti and is underway in Somalia and Sudan. Urgent attention to these deletion mutations is needed to inform malaria diagnostic testing policies throughout the Horn of Africa.
Methods
Study design and data collection
We performed a cross-sectional, multisite study in 11 districts along Ethiopia’s borders with Eritrea, Sudan and South Sudan, located within three of its nine administrative regions. On average, ten health facilities were selected from each district, including four districts of Amhara Region (northwest Ethiopia), six districts of Tigray Region (north Ethiopia) and one district of Gambella region (southwest Ethiopia) during the 2017–2018 peak malaria transmission season (September–December, although enrolment in Gambella was completed in April 2018) (Fig. 1). Per WHO protocol30, each facility passively enroled participants presenting with symptoms of malaria (fever, headache, joint pain, feeling cold, nausea and/or poor appetite), with sample size proportionally allocated to each facility based on the previous year’s malaria case load. All participants provided informed consent, participated in interview questionnaires, underwent blood collection for RDT testing using two types of RDT and were treated according to national guidelines. Data were double-entered into Epi Info (v.3.2), and discrepancies resolved using original paper forms by consensus. Ethical approval was obtained from the Ethiopia Public Health Institute (EPHI) Institutional Review Board (IRB; protocol EPHI-IRB-033-2017) and WHO Research Ethics Review Committee (protocol ERC.0003174 001). Processing of de-identified samples and data at the University of North Carolina at Chapel Hill (UNC) was determined to constitute non-human subjects research by the UNC IRB (study 17-0155). The study was determined to be non-research by the Centers for Disease Control (CDC) and Prevention Human Subjects office (0900f3eb81bb60b9). Experiments were performed in accordance with relevant guidelines and regulations.
Field sample evaluation
Study participants were evaluated using both a CareStart Pf/Pv (HRP2/Pv-pDH) RDT (Access Bio, catalogue no. RM VM-02571) and an SD Bioline Malaria Ag P.f. (HRP2/Pf-LDH) RDT (Alere, catalogue no. 05FK90). For the CareStart RDT, 5 µl of capillary whole blood was collected by fingerprick and transferred to the RDT sample well, along with 60 µl of buffer solution. Results were read at 20 min. The SD Bioline RDT followed the same protocol, but with four drops of buffer added and the results read in a 15–30 min window. Participants testing positive by either RDT were first prescribed treatment, according to Ethiopian national guidelines50.
Cases with any positive HRP2 or Pf-LDH RDT band were considered positive for P. falciparum malaria. Cases that were Pf-LDH-positive but HRP2-negative on both RDTs were considered potential candidates for pfhrp2/3 gene deletion and defined as ‘discordant’. These participants, along with a subset of HRP2-positive and HRP2-negative controls, provided further informed consent for additional blood collection for dried blood spot (DBS) preparation. At least two DBS samples (50 µl per spot) were collected on Whatman 903 protein saver cards (GE Healthcare; catalogue no. 10534612) from consenting participants. DBS samples were stored in plastic bags with desiccant. A randomly selected subset of DBS samples was sent for molecular analysis to UNC and for serological analysis to the CDC.
DNA extraction and PCR assays
DNA was extracted from three 6 mm punches per DBS sample using Chelex-100 (Bio-Rad, catalogue no. 1422822) and saponin (MilliporeSigma, catalogue no. 47036-250G-F) as described previously51. Quantitative PCR (qPCR) assays were first performed in duplicate for the P. falciparum lactate dehydrogenase gene (pfldh)52. To avoid the risk of misclassification due to DNA concentrations below the limit of detection for pfhrp2/3 PCR assays, further analysis was restricted to samples with >100 parasites per µl by qPCR (Extended Data Fig. 1)13. PCR assays targeting exon 2 of pfhrp2 and pfhrp3 were then performed in duplicate as described previously6, except that PCR reactions were performed as single-step, 45-cycle assays, using 10 µl of template and AmpliTaq Gold 360 Master Mix (Thermo Fisher Scientific, catalogue no. 4398813) in a 25 µl reaction volume. In addition to no-template and P. falciparum 3D7 strain (pfhrp2+/3+) positive controls, pfhrp2 assays included an additional DD2 strain (pfhrp2−/3+) control and pfhrp3 assays included an additional HB3 strain (pfhrp2+/3−) control. Finally, an additional single-copy gene, real-time PCR assay targeting P. falciparum β-tubulin was performed to confirm that sufficient parasite DNA remained in samples with a negative pfhrp2/3 PCR result13. Pfhrp2/3 genotyping calls were made in samples with pfldh qPCR parasitaemia >100 parasites per µl to avoid misclassification in the setting of amplification failure due to low target DNA concentration. A pfhrp2 or pfhrp3 positive call required one or more replicate with distinct band(s) with the expected fragment length. A negative call required both pfhrp2 or pfhrp3 replicates to be negative. Detailed reaction conditions for all PCR assays are described in the Supplementary File.
Serological assays
The presence of HRP2, pan-LDH and aldolase antigenaemia was assessed in a subset of DBS samples (single 6 mm punch) using a multiplex bead-based immunoassay exactly as described previously12. Within this multiplex assay, capture and detection antibodies against the HRP2 antigen would also recognize similar epitopes on the HRP3 antigen, so unique signals for these two antigens cannot be obtained.
Prevalence estimates
We estimated the prevalence of P. falciparum infections expected to have false-negative HRP2-based RDT results due to pfhrp2 deletions as follows. First, we calculated the proportion of all RDT-positive P. falciparum cases (HRP2+ or Pf-LDH+ on any RDT) with the discordant RDT profile (HRP2− on both RDTs, but Pf-LDH+), overall and by region. Second, we calculated the observed concordance between the discordant RDT profile and a pfhrp2-negative PCR call, overall. Prevalence estimates and 95% CIs were then back-transformed overall and by region using the ci.impt function within the asbio R package (v.1.5-5), which generates CI values for the product of two proportions using delta derivation. This allowed us to estimate with confidence the proportion of P. falciparum infections with both pfhrp2 deletions and false-negative HRP2-based RDT results, overall and by region. As a sensitivity analysis, we also estimated the proportion of those with a discordant RDT and a pfhrp2-negative PCR call (directly multiplying the true proportion of P. falciparum-positive individuals with a discordant RDT profile, overall and by region, by 0.727, or the overall proportion of discordant RDT samples that had a pfhrp2− PCR result). The 95% CI values were then generated using bootstrapping (1,000 iterations). The prevalence estimates and CI values generated by the two approaches were similar (Supplementary Table 3).
Pfhrp2/3 molecular inversion probe (MIP) development
Pfhrp2, pfhrp3 and the flanking regions within a 100 kb window surrounding each gene were targeted for MIP designs using MIPTools53. A tiled design strategy was employed that involved multiple, overlapping probes spanning each gene target. Twenty-two genes flanking pfhrp2 and 31 genes flanking pfhrp3 were used in the design, of which 11 and 19 were successful on the first design try, respectively. A second attempt was not made for designs for the flanking genes. A total of 241 probes were designed: 9 for pfhrp2, 9 for pfhrp3 and 223 for the flanking genes. MIPs were designed using the 3D7 (v.3) reference genome avoiding hybridization arms in variant regions when possible. Eighty alternative probes accommodating potential variants in the highly variable pfhrp2 and pfhrp3 genes were also created. A 15.5 kb segment centromeric to pfhrp3 on chromosome 13 between positions 2,792,000 and 2,807,500 is duplicated on chromosome 11 between positions 1,918,007 and 1,933,488, with 99.4% sequence identity. Therefore, the target genes falling into this region were multicopy genes and their probes were designed to bind to both loci on the genome (see Supplementary Table 5 for the design overview including all genes targeted, MIPs designed and genomic coordinates). Probes were ordered from Integrated DNA Technologies as 200 pmol ultramer oligos. Probe sequences are provided in the Supplementary Table 6.
MIP capture and deep sequencing of clinical samples
All DNA samples extracted by UNC underwent MIP capture using the capture and amplification methods exactly as described by Verity et al.54, with the exception of oligonucleotides (the pfhrp2/3 MIP oligonucleotide panel described above was used) and controls (we selected a different set of controls that are informative for pfhrp2/3 deletion characterization). All MIP captures included multiple controls: 3D7 (pfhrp2+/3+), DD2 (pfhrp2−/3+), HB3 (pfhrp2+/3−) laboratory strains; as well as low- and high concentration mixes (1% HB3, 10% DD2, 89% 3D7) at densities of 250 and 1,000 parasites per µl, respectively. Samples were sequenced on the Illumina NextSeq 550 instrument using 150 bp paired-end sequencing and dual indexing.
Subtelomeric profiling and variant calling with MIP data
Read mapping and variant calling were carried out using MIPTools (v.0.19.12.13)53. MIPTools uses the MIPWrangler algorithm (v.1.2.0)55 to create high-quality consensus sequences from sequence read data utilizing unique molecular indexes (UMIs) of MIPs, maps those sequences to the reference genome using bwa (v.0.7.17) and removes off-target sequences as described previously33,54. Deletion calls were limited to samples that had high coverage to avoid false positives. Considering the high frequency of large deletions present in the sample set, the coverage threshold was based on a subset of probes that were present on >60% of the samples, none of which overlapped with the chromosome 8 or 13 deletions. Samples with a median coverage of fewer than five UMIs for this subset of probes were excluded from analysis.
Structural profiling was performed using the UMI count table (Supplementary Table 7). The count table was converted to a presence/absence table such that if a probe had more than one UMI for a given sample, it was accepted as present (that is, not deleted). Samples were clustered into subtelomeric structural profile groups based on this table using the hierarchical clustering algorithm AgglomerativeClustering of the Python module Scikit-learn (v.0.20)56 using only the regions involved in the deletion events of the corresponding chromosome (position >1,372,615 for chromosome 8 and position > 2,806,319 for chromosome 13). Samples were grouped into their final subtelomeric structural profile based on visual inspection of the resulting clusters.
Initial variant calls were made using freebayes (v1.3.1) via MIPTools with the following options:--pooled-continuous--min-base-quality 1--min-alternate-fraction 0.01--min-alternate-count 2--haplotype-length -1--min-alternate-total 10--use-best-n-alleles 70--genotype-qualities. Variants were processed using MIPTools to filter for: variant quality >1, genotype quality >1, average alternate allele quality >15, minimum depth >2 UMIs; and make final genotype calls based on the major allele (within-sample allele frequency >0.5). In addition, the following variants were removed from the final call set: those that were observed as a major allele in less than two samples (singletons), not supported by more than two UMIs in at least three samples, present on multicopy genes, and indels. Variant calls were further filtered for missingness to avoid imputation in EHH calculations: samples missing calls for >50% of the variants were removed, variants missing calls in >50% of the samples were removed. Variants calls were converted to.map and.hap files (Supplementary Table 8) for use with the rehh package (v3.1.2) in R.
Assessment of MIP calls using whole-genome sequencing
We performed WGS on a subset of samples selected by convenience to assess the accuracy of MIP pfhrp2/3 deletion calls. DNA extracted from samples with discordant RDT results were selected for P. falciparum selective whole-genome amplification (sWGA) and whole-genome sequencing exactly as described previously31. In brief, DNA was first subjected to two separate sWGA reactions using the Probe_10 primer set described by Oyola et al57 and the JP9 primer set31. sWGA products were then pooled in equal volumes and acoustically sheared using a Covaris E220 instrument before to sequencing library preparation using Kappa Hyper library preps (Roche, catalogue no. KK8504). Indexed libraries were then pooled and sequenced on an Illumina HiSeq 4000 instrument using 150 bp, paired-end sequencing. Sequencing reads were deposited into NCBI’s Sequence Read Archive (PRJNA742125).
Published whole-genome sequencing data retrieval
Fastq files from 25 Ethiopian samples included in the MalariaGEN genome variation project19 and three laboratory strains (3D7, HB3 and DD2) from MalariaGEN genetic crosses project58 were downloaded from the European Nucleotide Archive using fasterq-dump (v.2.10.8) and sample accession numbers on 19 September 2020 (Supplementary Table 9).
WGS data analysis
All fastq files were processed as follows. Adaptor and quality trimming was performed using Trimmomatic (v.0.39) with the recommended options (seed mismatches:2, palindrome clip threshold:30, simple clip threshold:10, minAdapterLength:2, keepBothReads LEADING:3 TRAILING:3 MINLEN:36). Trimmed fastq files were mapped to 3D7 reference genome (v.3.0) concatenated to human genome (hg38, downloaded from the US National Institutes of Health National Center for Biotechnology and Information database on 2 December 2015, and available at https://www.ncbi.nlm.nih.gov/assembly/GCF_000001405.26/) to avoid incorrect mapping of reads originating from host DNA using bowtie2 (v.2.3.0) with the ‘--very-sensitive’ option. Reads mapping to the parasite chromosomes were selected and optical duplicates were removed using the sambamba (v.0.7.1) view and markdup commands, respectively. Read coverage was calculated using samtools (v.1.9) depth command with options ‘-a -Q1 -d0’, filtering reads with mapping quality of zero. Variants were called only for the regions of interest using freebayes (v.1.3.1) with the following options: ‘--use-best-n-alleles 70--pooled-continuous--min-alternate-fraction 0.01--min-alternate-count 2--min-alternate-total 10--genotype-qualities--haplotype-length -1--min-mapping-quality 15 -r region’. Regions of interest were from 300 kb centromeric to the deletions to chromosome ends (positions 1,074,000 to 1,472,805 and 2,505,000 to 2,925,236 for chromosomes 8 and 13, respectively).
Variants were filtered for: variant quality >20, genotype quality >15, average alternate allele quality >15, minimum depth >4 reads. In addition, the following variants were removed from the final call set: those that were never observed as a major allele in any sample, not supported by more than ten reads in at least one sample, and indels. Final genotype calls were based on the major allele (within-sample allele frequency >0.5). Variant calls were further filtered for missingness to avoid imputation in EHH calculations: samples missing calls for >95% of the variants were removed, variants missing calls in >10% of the samples were removed.
Telomeric profiling of the published genomes was carried out by visual inspection of depth-of-coverage plots (Extended Data Figs. 8 and 9). Summary statistics were generated (Supplementary Table 10) using the Python pandas module (v.0.23).
Statistical and population genetic analysis
Data collected during the participant’s study visit (clinical data and RDT results) were linked to laboratory results via the barcode number transcribed on DBS sent to the UNC and CDC laboratories. Samples in the dataset with missing or duplicate barcodes were arbitrated using original paper questionnaires by the EPHI data centre. An analysis dataset that included both PCR and field data was created including all samples that we could confidently merge by both barcode number and region label.
Statistical analysis was performed using R (v.3.6.0, R Core Team; www.R-project.org). All 95% CI values were generated using one-sample proportions test with Yates’ continuity correction (R package binom.confint, v.1.1-1), and unweighted Cohen’s kappa estimates were generated using the psych (v.1.8.1) and epiR (v.1.0-15) packages. Lilliefors test was used to test for normality, and P values calculated using chi-squared test for sex and the Kruskal–Wallis test for age and parasite density. ArcGIS (desktop v.10.5, ESRI) was utilized for mapping, with additional annotation performed using PowerPoint (v.16.31, Microsoft).
EHH statistics were calculated to evaluate the regions flanking the pfhrp2 and pfhrp3 genes for signatures of recent positive selection36 using the rehh package (v.3.1.2)59. EHH statistics were calculated using the data2haplohh and calc_ehh functions, haplotype furcations were calculated using calc_furcation, and plots were generated using the package’s plot function and annotated using Inkscape (v.0.92).
Complexity of infection (COI) for each sample was calculated using McCOILR (v.1.3.0, https://github.com/OJWatson/McCOILR), an Rcpp wrapper for THE REAL McCOIL60 with the options maxCOI = 25, totalrun = 2,000, burnin = 500, M0 = 15, err_method = 3. The same variant set used in the EHH analysis was used for the COI calculations, except that variants whose within-sample allele frequency were between 0.05 and 0.95 were called heterozygote for COI analysis.
Statistics and reproducibility
Sample sizes were chosen based on the WHO protocol30. Sources of data and samples included in the study are outlined in Fig. 2. DBS samples were only collected from a subset of participants based on the WHO protocol. Molecular, immunological and sequencing assays were performed on random subsets selected by EPHI. Most analyses were limited to samples that could be matched unambiguously across datasets. For example, any DBS samples found to have identical participant IDs were excluded from analysis. Similarly, DBS labelled with a participant and region ID that did not match clinical data were excluded from most analyses. These accounted for a minority of participants. Discordances in participant IDs and DBS sample labels were resolved whenever possible.
Field staff were not blinded to malaria RDT results because they were used to inform clinical care according to national guidelines. Pfhrp2/3 deletion calls using MIP sequencing were made by an investigator who was blinded to clinical data (including RDT results), HRP2 immunoassay results and pfhrp2/3 deletion calls using PCR.
Reporting Summary
Further information on research design is available in the Nature Research Reporting Summary linked to this article.
Supplementary information
Supplementary Note, Tables 1–11 and PCR conditions.
Supplementary Tables 1–11 (Excel format).
PCR conditions (Excel format).
De-identified demographic, clinical, and malaria RDT results for all subjects (n = 12,572).
De-identified demographic, clinical, malaria RDT, PCR and bead-based immunoassay results for all samples subjected to molecular analysis at UNC (n = 926).
MIP subtelomeric profile calls.
WGS median depth per 1 kb on chr. 8.
WGS median depth per 1 kb on chr. 13.
MIP UMI depth on chr. 8.
MIP UMI depth on chr. 13.
MIP coordinates on chr. 8.
MIP coordinates on chr. 13.
Acknowledgements
We thank the research teams for conducting fieldwork and the participants for participating in the study. We also thank S. R. Meshnick posthumously for contributions to the laboratory analyses and data analysis, and Q. Cheng for advice during PCR assay optimization. The following reagents were obtained through BEI Resources, NIAID, NIH: genomic DNA from P. falciparum strain 3D7, MRA-102G, contributed by D. J. Carucci; P. falciparum strain HB3, MRA-155G, contributed by T. E. Wellems; P. falciparum strain Dd2, MRA-150G, contributed by D. Walliker. We also acknowledge MSF Holland for supporting the field study in the Gambella region. The findings and conclusions in this report are those of the authors and do not necessarily represent the official position of the Centers for Disease Control and Prevention. This work was funded by the Global Fund to Fight AIDS, Tuberculosis, and Malaria through the Ministry of Health-Ethiopia (EPHI5405 to S.M.F.) and by the Bill and Melinda Gates Foundation through the World Health Organization (OPP1209843 to J.C., J.B.P.). It was also partially supported by MSF Holland, which supported fieldwork in the Gambella region, the Doris Duke Charitable Foundation (J.B.P.), the American Society for Tropical Medicine and Hygiene-Burroughs Wellcome Foundation (J.B.P.) and the US National Institutes of Health (R01AI132547 to J.J.J., J.A.B., O.A. and J.B.P.; K24AI134990 to J.J.J.). Under the grant conditions of the Bill and Melinda Gates Foundation, a Creative Commons Attribution 4.0 Generic License has already been assigned to the Author Accepted Manuscript version that might arise from this submission.
Extended data
Author contributions
S.M.F., J.C. and J.B.P. conceived the study. S.M.F., H. Mohammed and B.G.B. led the fieldwork, supervised by H. Mamo, H.S., B.P. and E.A. O.A., C.H., M.D. and E.R. performed laboratory assays and experiments. E.N.R., O.A., C.K., J.J.J., J.A.B., E.R. and J.B.P. analysed the laboratory data. E.N.R. and O.A. produced the tables and figures. S.M.F. and E.N.R. wrote the first draft with assistance from O.A. and J.B.P. All authors critically reviewed and approved the final manuscript.
Data availability
MIP and genomic sequencing data are available through the Sequence Read Archive (PRJNA742125). De-identified datasets generated during the current study and used to make all figures are available as supplementary files or tables. Extended Data Figs. 6 and 7 were derived from genomic sequencing data made publicly available by MalariaGEN (https://www.malariagen.net/data, downloaded 19 September 2020). Extended Data Fig. 8 was derived from genomic sequencing data generated during this study and publicly available through MalariaGEN.
Code availability
Code used during data analysis is available through GitHub at 10.5281/zenodo.5160363.
Competing interests
J.B.P. reports research support from Gilead Sciences and non-financial support from Abbott Diagnostics for studies of viral hepatitis, and honorarium from Virology Education for medical education teaching on COVID-19, all outside the scope of the current work. S.M.F. reports research support from Access Bio for a separate study of malaria RDTs, outside the current work. All other authors declare no competing interests.
Footnotes
Peer review informationNature Microbiology thanks the anonymous reviewers for their contribution to the peer review of this work. Peer reviewer reports are available.
Publisher’s note Springer Nature remains neutral with regard to jurisdictional claims in published maps and institutional affiliations.
These authors contributed equally: Sindew M. Feleke, Emily N. Reichert.
These authors jointly supervised this work: Jane Cunningham, Ozkan Aydemir, Jonathan B. Parr.
Contributor Information
Sindew M. Feleke, Email: sindewm@gmail.com
Jane Cunningham, Email: cunninghamj@who.int.
Jonathan B. Parr, Email: jonathan_parr@med.unc.edu
Extended data
is available for this paper at 10.1038/s41564-021-00962-4.
Supplementary information
The online version contains supplementary material available at 10.1038/s41564-021-00962-4.
References
- 1.False-negative RDT Results and Implications of New Reports of P. falciparum Histidine-rich Protein 2/3 Gene Deletions (World Health Organization, 2016).
- 2.Verma AK, Bharti PK, Das A. HRP-2 deletion: a hole in the ship of malaria elimination. Lancet Infect. Dis. 2018;18:826–827. doi: 10.1016/S1473-3099(18)30420-1. [DOI] [PubMed] [Google Scholar]
- 3.Wellems TE, Howard RJ. Homologous genes encode two distinct histidine-rich proteins in a cloned isolate of Plasmodium falciparum. Proc. Natl Acad. Sci. USA. 1986;83:6065–6069. doi: 10.1073/pnas.83.16.6065. [DOI] [PMC free article] [PubMed] [Google Scholar]
- 4.Howard RJ, et al. Secretion of a malarial histidine-rich protein (Pf HRP II) from Plasmodium falciparum-infected erythrocytes. J. Cell Biol. 1986;103:1269–1277. doi: 10.1083/jcb.103.4.1269. [DOI] [PMC free article] [PubMed] [Google Scholar]
- 5.Li B, et al. Performance of pfHRP2 versus pLDH antigen rapid diagnostic tests for the detection of Plasmodium falciparum: a systematic review and meta-analysis. Arch. Med. Sci. 2017;13:541–549. doi: 10.5114/aoms.2017.67279. [DOI] [PMC free article] [PubMed] [Google Scholar]
- 6.Baker J, et al. Genetic diversity of Plasmodium falciparum histidine-rich protein 2 (PfHRP2) and its effect on the performance of PfHRP2-based rapid diagnostic tests. J. Infect. Dis. 2005;192:870–877. doi: 10.1086/432010. [DOI] [PubMed] [Google Scholar]
- 7.Good Practices for Selecting and Procuring Rapid Diagnostic Tests for Malaria (World Health Organization, 2011).
- 8.Cheng Q, et al. Plasmodium falciparum parasites lacking histidine-rich protein 2 and 3: a review and recommendations for accurate reporting. Malar. J. 2014;13:283. doi: 10.1186/1475-2875-13-283. [DOI] [PMC free article] [PubMed] [Google Scholar]
- 9.Poti KE, Sullivan DJ, Dondorp AM, Woodrow CJ. HRP2: transforming malaria diagnosis, but with caveats. Trends Parasitol. 2020;36:112–126. doi: 10.1016/j.pt.2019.12.004. [DOI] [PubMed] [Google Scholar]
- 10.Gamboa D, et al. A large proportion of P. falciparum isolates in the Amazon region of Peru lack pfhrp2 and pfhrp3: implications for malaria rapid diagnostic tests. PLoS ONE. 2010;5:e8091. doi: 10.1371/journal.pone.0008091. [DOI] [PMC free article] [PubMed] [Google Scholar]
- 11.Grignard L, et al. A novel multiplex qPCR assay for detection of Plasmodium falciparum with histidine-rich protein 2 and 3 (pfhrp2 and pfhrp3) deletions in oolyclonal infections. EBioMedicine. 2020;55:102757. doi: 10.1016/j.ebiom.2020.102757. [DOI] [PMC free article] [PubMed] [Google Scholar]
- 12.Plucinski MM, et al. Screening for Pfhrp2/3-deleted Plasmodium falciparum, non-falciparum, and low-density malaria infections by a multiplex antigen assay. J. Infect. Dis. 2019;219:437–447. doi: 10.1093/infdis/jiy525. [DOI] [PMC free article] [PubMed] [Google Scholar]
- 13.Parr JB, Anderson O, Juliano JJ, Meshnick SR. Streamlined, PCR-based testing for pfhrp2- and pfhrp3-negative Plasmodium falciparum. Malar. J. 2018;17:137. doi: 10.1186/s12936-018-2287-4. [DOI] [PMC free article] [PubMed] [Google Scholar]
- 14.Berhane A, et al. Major threat to malaria control programs by Plasmodium falciparum lacking histidine-rich protein 2, Eritrea. Emerg. Infect. Dis. 2018;24:462–470. doi: 10.3201/eid2403.171723. [DOI] [PMC free article] [PubMed] [Google Scholar]
- 15.Akinyi S, et al. Multiple genetic origins of histidine-rich protein 2 gene deletion in Plasmodium falciparum parasites from Peru. Sci. Rep. 2013;3:2797. doi: 10.1038/srep02797. [DOI] [PMC free article] [PubMed] [Google Scholar]
- 16.Parr JB, et al. Pfhrp2-deleted Plasmodium falciparum parasites in the Democratic Republic of the Congo: a national cross-sectional survey. J. Infect. Dis. 2017;216:36–44. doi: 10.1093/infdis/jix347. [DOI] [PMC free article] [PubMed] [Google Scholar]
- 17.Sepúlveda N, et al. Global analysis of Plasmodium falciparumhistidine-rich protein-2 (pfhrp2) and pfhrp3 gene deletions using whole-genome sequencing data and meta-analysis. Infect. Genet. Evol. 2018;62:211–219. doi: 10.1016/j.meegid.2018.04.039. [DOI] [PubMed] [Google Scholar]
- 18.Gibbons J, et al. Lineage-specific expansion of Plasmodium falciparum parasites with pfhrp2 deletion in the Greater Mekong subregion. J. Infect. Dis. 2020;222:1561–1569. doi: 10.1093/infdis/jiaa250. [DOI] [PMC free article] [PubMed] [Google Scholar]
- 19.MalariaGEN et al. An open dataset of Plasmodium falciparum genome variation in 7,000 worldwide samples. Wellcome Open Res. 2021;6:42. doi: 10.12688/wellcomeopenres.16168.2. [DOI] [PMC free article] [PubMed] [Google Scholar]
- 20.Otto TD, et al. Long read assemblies of geographically dispersed Plasmodium falciparum isolates reveal highly structured subtelomeres. Wellcome Open Res. 2018;3:52. doi: 10.12688/wellcomeopenres.14571.1. [DOI] [PMC free article] [PubMed] [Google Scholar]
- 21.World Health Organization. False-negative RDT results and implications of new P. falciparum histidine-rich protein 2/3 gene deletions (WHO, 2016).
- 22.Menegon M, et al. Identification of Plasmodium falciparum isolates lacking histidine-rich protein 2 and 3 in Eritrea. Infect. Genet. Evol. 2017;55:131–134. doi: 10.1016/j.meegid.2017.09.004. [DOI] [PubMed] [Google Scholar]
- 23.Thomson R, et al. Prevalence of Plasmodium falciparum lacking histidine-rich proteins 2 and 3: a systematic review. Bull. World Health Organ. 2020;98:558–568F. doi: 10.2471/BLT.20.250621. [DOI] [PMC free article] [PubMed] [Google Scholar]
- 24.Golassa L, Messele A, Amambua-Ngwa A, Swedberg G. High prevalence and extended deletions in Plasmodium falciparum hrp2/3 genomic loci in Ethiopia. PLoS ONE. 2020;15:e0241807. doi: 10.1371/journal.pone.0241807. [DOI] [PMC free article] [PubMed] [Google Scholar]
- 25.Gefen-Halevi S, et al. HRP2/3 mutation in recrudescent Plasmodium falciparum malaria case acquired in Ethiopia. J. Travel Med. 2020;28:taaa196. doi: 10.1093/jtm/taaa196. [DOI] [PubMed] [Google Scholar]
- 26.Alemayehu GS, et al. Detection of high prevalence of Plasmodium falciparumhistidine-rich protein 2/3 gene deletions in Assosa zone, Ethiopia: implication for malaria diagnosis. Malar. J. 2021;20:109. doi: 10.1186/s12936-021-03629-x. [DOI] [PMC free article] [PubMed] [Google Scholar]
- 27.National Malaria Elimination Roadmap (Federal Democratic Republic of Ethiopia Ministry of Health, 2017).
- 28.World Malaria Report 2019 (World Health Organization, 2019); https://www.who.int/publications/i/item/world-malaria-report-2019
- 29.Taffese HS, et al. Malaria epidemiology and interventions in Ethiopia from 2001 to 2016. Infect. Dis. Poverty. 2018;7:103. doi: 10.1186/s40249-018-0487-3. [DOI] [PMC free article] [PubMed] [Google Scholar]
- 30.Template Protocols to Support Surveillance and Research for pfhrp2/pfhrp3 Gene Deletions (World Health Organization, 2020); https://www.who.int/malaria/publications/atoz/hrp2-deletion-protocol/en/
- 31.Morgan AP, et al. Falciparum malaria from coastal Tanzania and Zanzibar remains highly connected despite effective control efforts on the archipelago. Malar. J. 2020;19:47. doi: 10.1186/s12936-020-3137-8. [DOI] [PMC free article] [PubMed] [Google Scholar]
- 32.Parr, J. B. et al. Analysis of false-negative rapid diagnostic tests for symptomatic malaria in the Democratic Republic of the Congo. Sci. Rep. 11, 6495 (2021). [DOI] [PMC free article] [PubMed]
- 33.Aydemir O, et al. Drug-resistance and population structure of Plasmodium falciparum across the Democratic Republic of Congo using high-throughput molecular inversion probes. J. Infect. Dis. 2018;218:946–955. doi: 10.1093/infdis/jiy223. [DOI] [PMC free article] [PubMed] [Google Scholar]
- 34.Nunes MC, Okada M, Scheidig-Benatar C, Cooke BM, Scherf A. Plasmodium falciparum FIKK kinase members target distinct components of the erythrocyte membrane. PLoS ONE. 2010;5:e11747. doi: 10.1371/journal.pone.0011747. [DOI] [PMC free article] [PubMed] [Google Scholar]
- 35.Jaskiewicz E, Jodłowska M, Kaczmarek R, Zerka A. Erythrocyte glycophorins as receptors for Plasmodium merozoites. Parasit. Vectors. 2019;12:317. doi: 10.1186/s13071-019-3575-8. [DOI] [PMC free article] [PubMed] [Google Scholar]
- 36.Sabeti PC, et al. Detecting recent positive selection in the human genome from haplotype structure. Nature. 2002;419:832–837. doi: 10.1038/nature01140. [DOI] [PubMed] [Google Scholar]
- 37.Malaria Rapid Diagnostic Test Performance: Summary Results of WHO Product Testing of Malaria RDTs: Round 1-8 (2008–2018) (World Health Organization, 2018).
- 38.Berhane A, et al. Rapid diagnostic tests failing to detect Plasmodium falciparum infections in Eritrea: an investigation of reported false negative RDT results. Malar. J. 2017;16:105. doi: 10.1186/s12936-017-1752-9. [DOI] [PMC free article] [PubMed] [Google Scholar]
- 39.Boush MA, et al. Plasmodium falciparum isolate with histidine-rich protein 2 gene deletion from Nyala City, Western Sudan. Sci. Rep. 2020;10:12822. doi: 10.1038/s41598-020-69756-8. [DOI] [PMC free article] [PubMed] [Google Scholar]
- 40.Cunningham, J. Tracking the global distribution and prevalence of pfhrp2/3 gene deletions. In Tropical Medicine 2020, Annual Meeting of the American Society for Tropical Medicine and Hygiene, Symposium 167 (2020).
- 41.Gatton ML, et al. Implications of parasites lacking Plasmodium falciparum histidine-rich protein 2 on malaria morbidity and control when rapid diagnostic tests are used for diagnosis. J. Infect. Dis. 2017;215:1156–1166. doi: 10.1093/infdis/jix094. [DOI] [PubMed] [Google Scholar]
- 42.Watson OJ, et al. Modelling the drivers of the spread of Plasmodium falciparum hrp2 gene deletions in sub-Saharan Africa. eLife. 2017;6:e25008. doi: 10.7554/eLife.25008. [DOI] [PMC free article] [PubMed] [Google Scholar]
- 43.Watson OJ, et al. Impact of seasonal variations in Plasmodium falciparum malaria transmission on the surveillance of pfhrp2 gene deletions. eLife. 2019;8:e40339. doi: 10.7554/eLife.40339. [DOI] [PMC free article] [PubMed] [Google Scholar]
- 44.Kong A, et al. HRP2 and HRP3 cross-reactivity and implications for HRP2-based RDT use in regions with Plasmodium falciparum hrp2 gene deletions. Malar. J. 2021;20:207. doi: 10.1186/s12936-021-03739-6. [DOI] [PMC free article] [PubMed] [Google Scholar]
- 45.Pal P, et al. Plasmodium falciparum histidine-rich protein II compromises brain endothelial barriers and may promote cerebral malaria pathogenesis. mBio. 2016;7:e00617-16. doi: 10.1128/mBio.00617-16. [DOI] [PMC free article] [PubMed] [Google Scholar]
- 46.Pal P, et al. Plasmodium falciparum histidine-rich protein II causes vascular leakage and exacerbates experimental cerebral malaria in mice. PLoS ONE. 2017;12:e0177142. doi: 10.1371/journal.pone.0177142. [DOI] [PMC free article] [PubMed] [Google Scholar]
- 47.Leffler EM, et al. Resistance to malaria through structural variation of red blood cell invasion receptors. Science. 2017;356:eaam639. doi: 10.1126/science.aam6393. [DOI] [PMC free article] [PubMed] [Google Scholar]
- 48.Saito F, et al. Immune evasion of Plasmodium falciparum by RIFIN via inhibitory receptors. Nature. 2017;552:101–105. doi: 10.1038/nature24994. [DOI] [PMC free article] [PubMed] [Google Scholar]
- 49.Niang M, et al. STEVOR is a Plasmodium falciparum erythrocyte binding protein that mediates merozoite invasion and rosetting. Cell Host Microbe. 2014;16:81–93. doi: 10.1016/j.chom.2014.06.004. [DOI] [PMC free article] [PubMed] [Google Scholar]
- 50.National Malaria Guidelines (Federal Democratic Republic of Ethiopia Ministry of Health, 2017); https://www.humanitarianresponse.info/sites/www.humanitarianresponse.info/files/documents/files/eth_national_malaria_guidline_4th_edition.pdf
- 51.Plowe CV, Djimde A, Bouare M, Doumbo O, Wellems TE. Pyrimethamine and proguanil resistance-conferring mutations in Plasmodium falciparum dihydrofolate reductase: polymerase chain reaction methods for surveillance in Africa. Am. J. Trop. Med. Hyg. 1995;52:565–568. doi: 10.4269/ajtmh.1995.52.565. [DOI] [PubMed] [Google Scholar]
- 52.Pickard AL, et al. Resistance to antimalarials in Southeast Asia and genetic polymorphisms in pfmdr1. Antimicrob. Agents Chemother. 2003;47:2418–2423. doi: 10.1128/AAC.47.8.2418-2423.2003. [DOI] [PMC free article] [PubMed] [Google Scholar]
- 53.MIPTools. GitHubhttps://github.com/bailey-lab/MIPTools (2021).
- 54.Verity R, et al. The impact of antimalarial resistance on the genetic structure of Plasmodium falciparum in the DRC. Nat. Commun. 2020;11:2107. doi: 10.1038/s41467-020-15779-8. [DOI] [PMC free article] [PubMed] [Google Scholar]
- 55.MIPWrangler GitHubhttps://github.com/bailey-lab/MIPWrangler (2020).
- 56.Pedregosa F, et al. Scikit-learn: machine learning in Python. J. Mach. Learn. Res. 2011;12:2825–2830. [Google Scholar]
- 57.Oyola SO, et al. Whole genome sequencing of Plasmodium falciparum from dried blood spots using selective whole genome amplification. Malar. J. 2016;15:597. doi: 10.1186/s12936-016-1641-7. [DOI] [PMC free article] [PubMed] [Google Scholar]
- 58.Miles A, et al. Indels, structural variation, and recombination drive genomic diversity in Plasmodium falciparum. Genome Res. 2016;26:1288–1299. doi: 10.1101/gr.203711.115. [DOI] [PMC free article] [PubMed] [Google Scholar]
- 59.Gautier M, Vitalis R. rehh: an R package to detect footprints of selection in genome-wide SNP data from haplotype structure. Bioinformatics. 2012;28:1176–1177. doi: 10.1093/bioinformatics/bts115. [DOI] [PubMed] [Google Scholar]
- 60.Chang HH, et al. THE REAL McCOIL: a method for the concurrent estimation of the complexity of infection and SNP allele frequency for malaria parasites. PLoS Comput. Biol. 2017;13:e1005348. doi: 10.1371/journal.pcbi.1005348. [DOI] [PMC free article] [PubMed] [Google Scholar]
Associated Data
This section collects any data citations, data availability statements, or supplementary materials included in this article.
Supplementary Materials
Supplementary Note, Tables 1–11 and PCR conditions.
Supplementary Tables 1–11 (Excel format).
PCR conditions (Excel format).
De-identified demographic, clinical, and malaria RDT results for all subjects (n = 12,572).
De-identified demographic, clinical, malaria RDT, PCR and bead-based immunoassay results for all samples subjected to molecular analysis at UNC (n = 926).
MIP subtelomeric profile calls.
WGS median depth per 1 kb on chr. 8.
WGS median depth per 1 kb on chr. 13.
MIP UMI depth on chr. 8.
MIP UMI depth on chr. 13.
MIP coordinates on chr. 8.
MIP coordinates on chr. 13.
Data Availability Statement
MIP and genomic sequencing data are available through the Sequence Read Archive (PRJNA742125). De-identified datasets generated during the current study and used to make all figures are available as supplementary files or tables. Extended Data Figs. 6 and 7 were derived from genomic sequencing data made publicly available by MalariaGEN (https://www.malariagen.net/data, downloaded 19 September 2020). Extended Data Fig. 8 was derived from genomic sequencing data generated during this study and publicly available through MalariaGEN.
Code used during data analysis is available through GitHub at 10.5281/zenodo.5160363.


