
Fig. 4. Phenotypical characterization of co-cultured HSPCs.
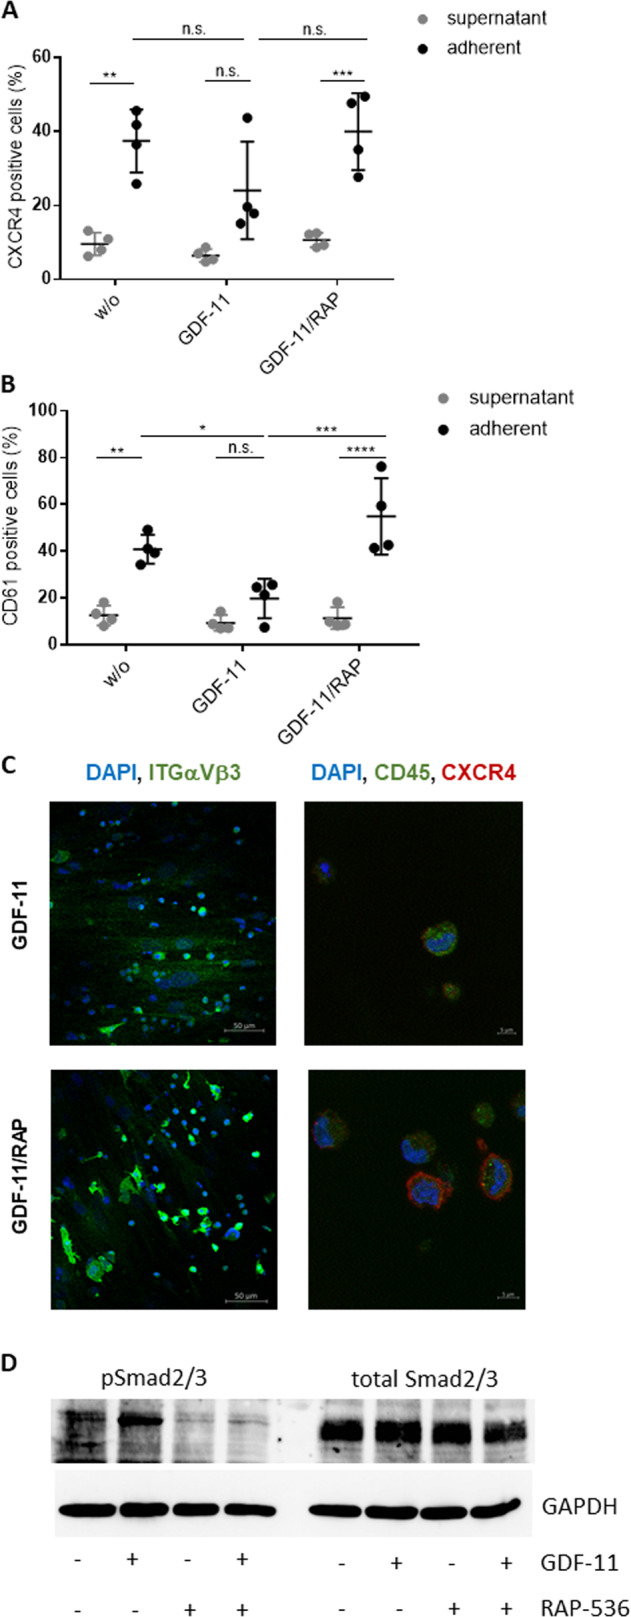
HSPCs cultured for 1 week on GDF-11/RAP-536 pre-treated MDS MSC layers were evaluated by flow cytometry for the expression of A CXCR4 and B CD61. Cumulative data from four experiments are shown as mean ± SD. ns, p > 0.05, *p < 0.05, **p < 0.01, ***p < 0.001, ****p < 0.0001. Significance was assessed by two-way ANOVA with Sidak’s and Tukey’s multiple comparisons test. C Representative confocal microscopy images of ITGαVβ3 (green) and CXCR4 (red)/CD45 (green) with nuclear DAPI staining of HSPCs adherent on GDF-11 or GDF-11/RAP-536 pre-treated MDS MSC layers. D Western blot analysis of phospho Smad2/3 (52 kDa) and total Smad2/3 protein (52 kDa) in GDF-11/RAP-536 pre-treated MSCs after co-culture with HSPCs. Duplicate sample aliquots were run on a single gel, which was blotted before being cut into two halves: one being used for phosphor Smad2/3 and one for total Smad2/3 detection. GAPDH (37 kDa) served as reference protein. One representative experiment is shown, N = 3.