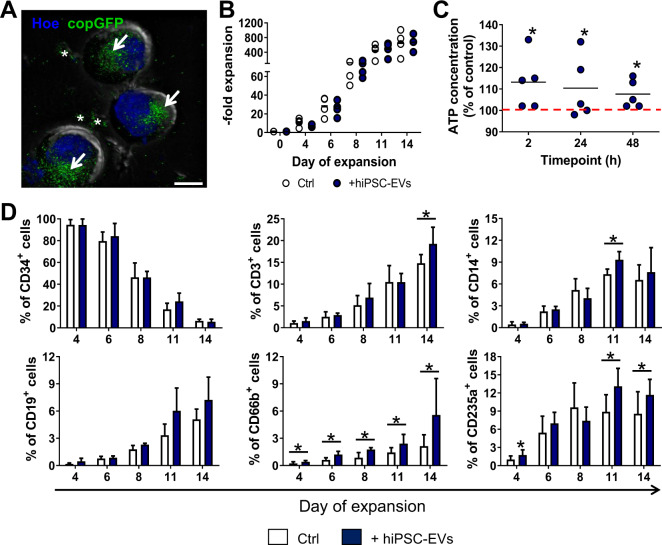
Fig. 2. hiPSC-EVs target CB-HSPCs during their ex vivo expansion.
CD34+ cell population highly enriched in HSPCs was purified from CB units and cultured in a dedicated expansion medium containing hiPSC-EVs. A Visualization of hiPSC-EVs internalization into CB-derived CD34+ cells. Cells were incubated with copGFP+ hiPSC-EVs for 2 h. After the removal of unbound hiPSC-EVs, cell nuclei were stained with Hoechst 33342 dye (Hoe). Cell images were captured by Leica DMI6000B microscope with 100× NA-1.47 oil immersion objective. A representative merged image for differential interference contrast module and fluorescence channels for copGFP and Hoe is presented. White arrows indicate copGFP+ hiPSC-EVs accumulated inside the CB-HSPCs. White asterisks indicate aggregated copGFP+ hiPSC-EVs attached to the cells. Scale bar indicates 5 µm. B Kinetics of CB-HSPCs ex vivo expansion. Data are expressed as fold expansion compared to the number of isolated CB-HSPCs. Each dot represents data obtained from individual experimental repetition (N = 4) for cells expanded in the control medium (Ctrl) or hiPSC-EVs (+hiPSC-EVs) medium. C The effect of hiPSC-EVs on the metabolic activity of CB-derived HSPCs. Expanding CB-HSPCs were treated with hiPSC-EVs for 2, 24, or 48 h. Subsequently, a luminescence assay was performed to measure the concentration of ATP produced by the cells. Data on the graph present the ATP level in hiPSC-EVs-treated cells expressed as the percentage of the control (cells untreated with hiPSC-EVs) in individual experimental repetitions (N = 5). Black lines represent the mean value, whereas the red line indicates the level of the control (100%). *p < 0.05 for the control vs. hiPSC-EVs-treated cells, two-tailed Student’s t-test. D Kinetics of phenotypic changes in CB-HSPCs during ex vivo expansion. Cells were expanded for 14 days in control medium (Ctrl) or medium containing hiPSC-EVs (+hiPSC-EVs). On the indicated day of the expansion, cells were harvested and stained with fluorescent-conjugated antibodies against CD34 and hematopoietic lineage markers. The analysis of antigen expression was performed with the BD LSRFortessa flow cytometer. Data are presented as mean ± SD (N = 3). *p < 0.05 for control vs. hiPSC-EVs-treated cells, two-tailed Student’s t-test.

