

Abstract
Childhood lead exposure interferes with brain maturation, which adversely impacts cognitive and behavioral development. Lower intelligence scores, impairments in decision making, and increased rates of delinquent and criminal behavior are adverse outcomes linked to childhood lead absorption. The present study examined the relationships between childhood blood lead concentrations, structural brain volume, and measures of adult criminality. We hypothesized that increased rates of criminal arrests in adulthood would be inversely correlated with regional gray and white matter volumes, especially prefrontal areas responsible for decision making and self-control. We obtained childhood blood lead histories and anatomical magnetic resonance imaging from a subset of the longitudinally followed birth cohort known as the Cincinnati Lead Study. Criminality data for cohort participants were extracted from public databases. Voxel based morphometry was used to examine spatial differences in regional gray and white matter volumes associated with childhood blood lead concentrations and measures of adult criminality, respectively. Conjunction analyses allowed for the exploratory evaluation of common regions of volume change. Childhood blood lead concentrations were inversely associated with gray and white matter volume in the frontal, parietal and temporal lobes. Gray matter volumes were also inversely associated with criminal arrests with key regions within the cingulate, precuneus, several frontal gyri and the supplementary motor area. Conjunction analyses identified regions in the anterior cingulate, frontal gray matter and supplementary motor area associated with childhood lead absorption and criminality. The results from this study suggest that reduced brain volumes in regions responsible for cognition and emotional regulation are associated with childhood lead exposure and criminal arrests.
Keywords: Lead absorption, criminal behavior, magnetic resonance imaging, volume, frontal lobe
1. Introduction
The etiology of criminal behavior is difficult to identify. While genetic and neurobiological characteristics influence the individual likelihood of future criminal activity (Baker et al., 2007; Baker et al., 2008; Nilsson et al., 2014; Rhee and Waldman, 2002; Simonoff et al., 2004; Weder et al., 2009), personality traits associated with antisocial behaviors in childhood, attention deficit disorders, conduct disorders, and a multitude of family variables including socioeconomic status and adverse child experiences, are identified as factors implicated in criminality (Hill and Nathan, 2008; Kosterman et al., 2001; Savage, 2009). There is growing evidence that exposure to environmental toxicants, such as the heavy metal lead, also increases the risk of juvenile delinquency and adult criminal behavior as childhood lead absorption has been associated with cognitive deficits and behavioral problems throughout the lifespan (Carpenter and Nevin, 2010).
With the Cincinnati Lead Study (CLS), a longitudinal study following a birth cohort for over 35 years (Bornschein et al., 1985), we have interrogated the relationship between childhood lead exposure and outcomes with a series of studies assessing cognition, neuropsychological functioning, delinquency, criminal behavior and neuroimaging features of brain structure and function. For instance, diminished neurocognitive abilities measured during childhood and adolescence (Coscia et al., 2003; Dietrich et al., 1993; Ris et al., 2004) and measures of antisocial behavior and juvenile delinquency were each correlated with childhood blood concentrations (Dietrich et al., 2001). Dietrich et al. (2001) found that prenatal exposure to lead was significantly associated with a covariate-adjusted increase in the frequency of parent-reported delinquent and antisocial behaviors, while prenatal and postnatal exposure to lead was significantly associated with a covariate-adjusted increase in frequency of self-reported delinquent and antisocial behaviors. These results would be further advanced in two studies by Wright et al. (2008; 2021) examining criminality at multiple timepoints of childhood lead exposure and age of adult arrests for the CLS participants. Covariate-adjusted rate ratios (RR) for total arrests and arrests for violent crimes were associated with increases in blood lead concentrations. Overall, a 5 μg/dL increase in childhood blood lead levels corresponded to a 5 to 6% increase in the rate of change in arrests over time (Wright et al., 2021). Childhood blood lead concentrations prospectively predicted variation in adult arrests and arrests over the life-course from 18 to 33 years (Wright et al., 2021). Also, Wright et al. (2009) observed a direct relationship between the total score on the Psychopathic Personality Inventory (Lilienfeld and Andrews, 1996) assessed in young adulthood and childhood blood lead concentrations at age 78 months (PbB78). PbB78 was predictive for four of the PPI subscales even after controlling for race, gender, child IQ, maternal IQ and HOME score; these included Machiavellian Egocentricity, Social Potency, Impulsive Nonconformity and Blame Externalization. These four dimensions portray an individual that is highly egocentric, consciously manipulates others for his/her own gain, and deflects blame for behavior to others. Psychopathy is highly predictive of future crime and violence (Hare et al., 2000).
By employing voxel based morphometric (VBM) analyses of anatomical neuroimaging, we previously demonstrated an inverse association between mean childhood blood lead concentrations and magnetic resonance imaging (MRI) derived brain volume with covariate adjustment when 157 members of the CLS cohort were between 19 and 24 years of age (Brubaker et al., 2010; Cecil et al., 2008). These results featured decreased adult cingulate, frontal, parietal and cerebellar gray matter volumes associated with increased mean childhood blood lead concentrations obtained from birth to seven years of age, especially for males. In a subsequent evaluation using higher MRI field strength and enhanced image resolution when 155 CLS participants were approximately 27 years of age, Beckwith et al. (2018) completed anatomical imaging with VBM analyses with his study extending the original findings by incorporating conjunction analyses for brain volume changes related to PbB78, sex and total scores for the Psychopathic Personality Inventory (Lilienfeld and Andrews, 1996). VBM analyses did not display a direct effect between total psychopathy score and gray matter volume for the cohort; however, the analyses revealed reduced white matter volume in the cerebellum and brain stem. An interaction between sex and total psychopathy score was also identified. Females displayed increased gray matter volume in the frontal, temporal, and parietal lobes associated with increased total psychopathy score, but did not display any white matter volume differences. Males primarily displayed reductions in frontal gray and white matter brain volume in relation to increased total psychopathy scores. With conjunction analyses, Beckwith et al. (2018) revealed a volumetric decrease in the white matter of the left prefrontal cortex associated with increased total psychopathy scores and increased blood lead concentration in males.
To further advance our investigation of the relationship between lead and criminality, we conducted the current study to examine differences in structural brain volume associated with total criminal and violent arrests in the CLS population. We hypothesized that measures of criminality would be inversely correlated with regional brain volumes, particularly in areas highly involved in cognition, decision making, self-control, and emotional regulation such as the orbitofrontal cortex (OFC), ventromedial prefrontal cortex (VMPFC), dorsolateral prefrontal cortex (DLPFC), anterior cingulate cortex (ACC), and the medial temporal lobe. Using a parallel approach to our VBM analyses with psychopathy, we hypothesized that conjunction analyses of lead concentration and arrests would reveal volume loss within regions in the frontal and temporal lobes.
2. Materials and Methods
2.1. Cincinnati Lead Study Participants
Participants were recruited from the CLS, a longitudinal cohort study from an urban setting for the purpose of studying the developmental consequences of environmental lead exposure. Participants and/or guardians provided informed written consent prior to participation in any research study for the CLS. Consent was collected by an investigator or senior research staff member after participants and/or guardians indicated comprehension of the implications of the research. This protocol was reviewed and approved by the institutional review boards at the University of Cincinnati College of Medicine and Cincinnati Children’s Hospital Medical Center.
Pregnant women, recruited from inner city neighborhoods of Cincinnati historically displaying an elevated incidence of childhood lead poisoning with locations near major interstates and aging housing stock, were recruited for the CLS between 1979 and 1984 (Bornschein et al., 1985). A total of 376 newborns were enrolled into the study at birth, of which 305 received follow up examinations at ages 3 and 6 months. Offspring were assessed in the research clinic quarterly until age 60 months and semiannually from 66 months to 78 months. Subsequent visits in the research clinic were at 10 years, 16–17 years, between the ages of 19 to 24 years, and between 27 to 33 years of age. From the last visit, 174 participants were screened for the MRI examination, however, 16 were ineligible due to contraindications (e.g., claustrophobia, implanted metal, pregnancy (not allowed for research purposes)) or lived out of state. With the remaining 158 participants, 32 examinations were removed from the analysis due to imaging data collected on a scanner that could not be combined with the larger group, leaving 126 participants with MRI examinations available for analysis. Imaging examinations for an additional 3 participants were removed due to technical issues with anatomical image reconstruction. Imaging and criminality data from the remaining 123 participants (71 Female, 52 Male) were used for this analysis.
2.2. Blood lead concentrations
Blood lead concentrations were obtained throughout the first 78 months of development. The concentration of Pb in whole blood (μg/dL) was assessed in the mother (prenatal first or early second trimester), in the neonate at 10 days, in the child on a quarterly basis up to 60 months and again at 66, 72, and 78 months (Dietrich et al., 1991; Dietrich et al., 1992). In some cases, blood was sampled by heel stick (mostly for neonates) or finger stick, if necessitated by the behavioral or physical characteristics of the child. However, the vast majority of blood samples were collected by venipuncture. Blood lead concentrations were determined using anodic stripping voltammetry (Dietrich et al., 1993; Dietrich et al., 1987; Roda et al., 1988).
2.3. Criminal arrests
Capitalizing on the longitudinal nature of the data, we created a measure of the total number of arrests from ages 18 to 33 years or from 1998 to 2013 (Wright et al., 2021). This measure reflects the accumulated number of arrests over the individual’s lifetime. We obtained adult arrest histories from public records in Hamilton County, Ohio. Public data on arrest histories are available online from the Hamilton County Clerk of Courts website, updated frequently and provided a comprehensive picture of the nature of the offenses and any resulting dispositions. Conviction data were not collected as they are subject to plea bargains, diversion programs and other extra-legal variables which influence reporting of convictions (Wright et al., 2008). Two reviewers independently coded individual’s arrest histories and the nature of the arrest. Differences between reviewers in the coding of arrests, which occurred in less than 1% of cases, were resolved by a third reviewer. Individuals who committed or who were charged with multiple crimes from a single criminal event were coded as a single arrest incident. The arrest categories included: disorderly conduct; drug offenses; fraud; obstruction of justice; offenses against property; serious motor vehicle offenses; violent offenses; and “other” offenses that did not conform to any listed category. For the purposes of this study, arrests for violent offenses and total arrests were the primary variables analyzed. Violent offenses could represent murder, rape, robbery, assault, domestic violence and weapons possession. Wright et al. (2008) reported the full details regarding the initial collection of adult criminal records between the ages of 18 and 24 years with extended analyses up to age 33 years subsequently reported in Wright et al. (2021). The interobserver agreement assessed by Cohen’s kappa was 0.97 for participant offenses.
2.4. Imaging Acquisition
Three dimensional (3D) T1-weighted anatomical images were obtained on a Philips 3T Achieva scanner (Philips Medical Systems, Cleveland, OH) with an 8-channel head coil using a single-shot Turbo Field Echo (TFE) pulse sequence with the following key parameters: repetition time = 8.1 ms; echo time = 3.7 ms; minimum inversion time delay = 889.7 ms; flip angle = 8°; voxel size = 1 mm x 1 mm x 1 mm.
2.5. Imaging Data Processing
The data processing methods for VBM of the imaging dataset have been previously described (Beckwith et al., 2018). Briefly, T1-weighted anatomical images were imported into Statistical Parametric Mapping 8 (SPM8; Wellcome Department of Cognitive Neurology, London) running in Matlab 7.13.0.564 (The Mathworks, Inc., Natick, MA) with the default parameters for the VBM8 toolbox (http://www.neuro.uni-jena.de/vbm8/). Images were first bias-field corrected to remove inhomogeneities and registered to a Montreal Neurological Institute (MNI) template using a 12-parameter linear affine transformation. Segmentation of T1 images into tissue classes (gray matter, white matter, and cerebral spinal fluid) was conducted using a unified segmentation model in SPM8 (Ashburner and Friston, 2005). Segmented tissue classes were registered to MNI-template space via rigid-body transformation. Tissue classes were then imported into the DARTEL toolbox (Ashburner, 2007), normalized, and registered to a template from the IXI-database (http://www.braindevelopment.org) in MNI space. The normalized images were then modulated by multiplying voxels by non-linear components. An 8 mm full-width half-maximum Gaussian Kernel was used to smooth modulated gray and white matter images.
2.6. Statistical analyses
2.6.1. Participant Characteristics
We compared the participant characteristics from the current study to the larger CLS birth cohort using SAS 9.4 (SAS Institute Inc., Cary, NC) to identify biases due to attrition (Table 1). We employed a Chi-Square test for categorical variables and a one-way ANOVA for continuous variables in our comparisons. Comparisons of the excluded imaging from cohort participants due to acquisition on a different scanner have been previously described by Beckwith et al. (2018).
Table 1.
Characteristics for Participants and their Mothers in the Cincinnati Lead Study
| Characteristics | Analysis Cohort (N =123) | Range | Full Cohort (N=250) |
|---|---|---|---|
|
| |||
| Female | 71 (58%) | 125 (50%) | |
| African American | 115 (93%) | 225 (90%) | |
| BPb78 (μg/dL) | 7.82 ± 4.2 | 3.15–24.75 | 8.29 ± 4.76 |
| Violent Arrests* | 1.03 ± 2.09 | 0–15 | 1.00 ± 2.38 |
| Total Arrests* | 6.7 ± 7.57 | 0–38 | 7.01 ± 9.80 |
| Age in 2013 | 29.46 ± 1.25 | 27–33 | 29.82 ± 1.51 |
| Age at Imaging (years) | 26.82 ± 1.17 | 25.05–30.58 | 26.82 ± 1.08 † |
| BW (grams) | 3163.54 ± 486.38 | 1814–4400 | 3144.14 ± 452.99 |
| GEST (weeks) | 39.63 ± 1.7 | 35–43 | 39.57 ± 1.70 |
| Educational Attainment* | 11.94 ± 1.77 | 7–16 | 11.97 ± 1.83 |
| HOME | 30.9 ± 5.17 | 17–43 | 32.3 ± 6.6 |
| SES | 18.24 ± 4.3 | 8–34 | 18.0 ± 4.8 |
| FSIQ at 7 years | 85.98 ± 11.33 | 50–116 | 86.91 ± 11.31 |
| Maternal IQ | 75.06 ± 8.75 | 58–100 | 75.27 ± 9.29 |
| Single Parent Household | 76 (62%) | 155 (62%) | |
| Participant Marijuana Use | 70 Yes (57%) | 77 Yes (55%)† | |
| Maternal Tobacco Use | 53 Yes (43%) | 121 Yes (48%) | |
| Maternal Alcohol Use | 15 Yes (12%) | 36 Yes (14%) | |
| Maternal Marijuana Use | 13 Yes (11%) | 29 Yes (12%) | |
| Maternal Narcotic Use | 1 Yes (1%) | 3 Yes (1%) | |
Data presented as mean ± standard deviation or n (%)
Abbreviations: BPb78 = Blood lead value at age 78 months; BW = Birth Weight; FSIQ = Full Scale Intelligence Quotient; HOME = Home Observation for Measurement of the Environment; SES = Hollingshead Socioeconomic Status
Denotes variables with statistically significant difference between males and females.
Contains missing data, data only collected for participants receiving MRI
2.6.2. Voxel Based Morphometry
Preprocessed gray and white matter images were analyzed within the framework of a general linear model (GLM). A multiple linear regression model was utilized for the final analyses with covariates. Binary masks were generated and applied to limit the analysis to voxels within gray matter or white matter, respectively. Data were analyzed for both volume gain and volume reduction. Threshold Free Cluster Enhancement (TFCE) (Smith and Nichols, 2009) was utilized to correct for multiple comparisons (FWE-p < 0.05). For visualization of all VBM results, an overlay of significant clusters for each analysis was created in SPM8 and superimposed upon a template atlas provided in the VBM8 toolbox. Identification of structures and regions was aided through the use of several atlases (Haines, 2008; Nolte and Angevine, 2007; Oishi et al., 2011).
2.6.3. Conjunction Analyses
Where there were intersections between statistically significant clusters from the VBM analyses of blood lead concentration (PbB78) and arrests (total and violent), for each tissue class, we performed conjunction analyses. We generated masks of the significant clusters for each analysis. For each tissue class, we overlaid the cluster masks from PbB78 and arrests onto a template image, and extracted a mask representing the intersection between PbB78 and arrests, if one existed. Separate analyses were performed; one for PbB78 with Total Arrests, and one for PbB78 with Total Violent Arrests. The conjunction analyses were performed using the relevant post-hoc T-contrasts for each variable within the same statistical model.
Conjunction analyses were confined to the region of intersection using the previously generated mask and corrected for multiple comparisons at FWE-p < 0.05 applying a small volume correction (Worsley et al., 1996).
2.6.4. Covariate Selection
Based upon prior CLS studies, variables considered for inclusion as covariates were sex, race, age at time of imaging, gestational age at birth, weight at birth, maternal and participant full-scale IQ (Silverstein, 1985), mean childhood Home Observation for Measurement of the Environment (HOME) inventory score (Bradley and Caldwell, 1977; Bradley and Caldwell, 1979; Caldwell and Bradley, 1978), mean childhood Hollingshead socioeconomic status (SES) score (Cirino et al., 2002), highest level of educational attainment for the participant, participant marijuana usage based upon urine screening for drugs of abuse at time of imaging, maternal prenatal alcohol use, maternal prenatal tobacco use, and maternal prenatal marijuana use. Age in 2013 was considered as a covariate to account for the amount of time a participant was at risk for arrest (Wright et al., 2008). Collinearity was assessed for all potential covariates in SAS. Age at time of imaging and age in 2013 did display traits of collinearity (λ = 0.00062, Condition Index = 152.89); however, the tolerance (T) and variance inflation factor (VIF) were unremarkable [Age at time of imaging: T = 0.53, VIF = 1.87; Age in 2013: T = 0.53, VIF = 1.9], so neither variable was excluded from consideration. To avoid circular analyses (Button, 2019; Kriegeskorte et al., 2010; Kriegeskorte et al., 2009; Poldrack et al., 2017; Vul and Pashler, 2012), we established covariate inclusion based on previous analyses of a similar MRI data (Cecil et al., 2008). For all final analyses, age at time of imaging (Guxens et al., 2018), birth weight (Haukvik et al., 2014), and total intracranial volume (Crowley et al., 2018) were included as covariates. Due to differences in arrest rates (Wright et al., 2008), sex and age in 2013 (Wright et al., 2021) were included as a covariate for criminality measures. PbB78 concentrations were incorporated into the criminal arrest analyses to account for childhood lead exposure. This value was selected over other blood lead measurements because later childhood blood lead levels are thought to better reflect body-lead accumulation and demonstrate greater associations with neuropsychological and behavioral measures (Baghurst et al., 1992; Dietrich et al., 2001; Hornung et al., 2009; Ris et al., 2004; Wasserman et al., 1997; Wright et al., 2009; Wright et al., 2008).
2.6.5. Missing data
Missing data points were imputed using a Markov Chain Monte Carlo method with a multivariate normal distribution model. The likelihood of missingness was estimated using Little’s missing completely at random (MCAR) test in R version 3.6 (Little, 1988). The results were not statistically significant [X2 (156, N = 123) = 141.27, p = 0.79), suggesting the data meet the assumptions required for multiple imputation. The PROC MI procedure in SAS was utilized to impute missing data points. Ten data sets for each variable with missing data points were imputed within a general linear model and averaged. A pooled analysis was conducted to compare the standard errors for the initial and imputed data sets. Additional details regarding the imputation of missing data points are described in Beckwith et al. (2018).
3. Results
3.1. Participant Characteristics
We compared the participant characteristics from the present study (N = 123) to the characteristics from the larger CLS cohort (N = 250) to estimate potential sample bias. For the longitudinal arrest histories, only participant age in 2013 was shown to be different statistically [F (1, 349) = 4.99, p = 0.026] with the study sample mean being 29.46 years and the CLS cohort being 29.82 years. The cohort is homogenous with respect to many social variables important to criminality such as race, SES and single parent households. Participant characteristics are presented in Table 1. Participants excluded due to scanner incompatibility had lower birthweights (2958.69 + 490.6) grams, lower gestational ages (38.8 ± 2.05 weeks) and higher maternal tobacco usage (20 Yes, 63%) as previously described (Beckwith et al., 2018).
3.2. Blood Lead Concentrations at 78 Months and Adult VBM
We compared blood lead concentrations with anatomical imaging adjusting for age at time of imaging, birth weight and total intracranial volume. VBM analysis in gray matter demonstrated reduced regional volumes primarily in the cingulate, medial frontal gyrus, paracentral lobule and supplementary motor area (SMA) associated with increased PbB78 concentrations (Fig 1, Table 2). Regional volumetric decreases in white matter associated with PbB78 were observed in the subcortical white matter about the orbital frontal gyrus, cingulate, paracentral lobule, pre- and post-central gyri, superior temporal gyrus, as well as deep white matter structures within the temporal and parietal lobes (Fig 2, Table 3).
Fig 1. Regional gray matter volume loss inversely associated with childhood blood lead concentrations at age 78 months with covariates.

Clusters were corrected for multiple comparisons (FWE = 0.05) using threshold free cluster enhancement. Negative slice numbers = Left hemisphere, Positive slice numbers = Right hemisphere. Color bar represents -log(p) value.
Table 2.
Reduced Gray Matter Volume Associated with Childhood Blood Concentrations at Age 78 Months
| Anatomical Region | Cluster Size (Voxels) | Peak Voxel MNI Coordinates (X,Y,Z) | Peak Voxel TFCE | Voxel P-Value |
|---|---|---|---|---|
|
| ||||
| Cingulate Medial Frontal Gyrus Superior Frontal Gyrus |
1291 | 0 35 32 | 8814.85 | 0.043 |
| Cingulate Medial Frontal Gyrus Paracentral Lobule Supplementary Motor Area |
844 | −2 −21 48 | 8687.25 | 0.046 |
| Medial Frontal Gyrus Supplementary Motor Area |
444 | 0 −6 63 | 8720.01 | 0.046 |
Model adjusted for age at time of imaging, birth weight and total intracranial volume. Voxels and clusters corrected for multiple comparisons (FWE) at P ≤ 0.05 using TFCE. FWE = Familywise Error Rate; MNI = Montreal Neurological Institute; TFCE = Threshold Free Cluster Enhancement
Fig 2. Regional white matter volume loss inversely associated with childhood blood lead concentrations at age 78 months with covariates.

Clusters were corrected for multiple comparisons (FWE = 0.05) using threshold free cluster enhancement. Negative slice numbers = Left hemisphere, Positive slice numbers = Right hemisphere. Color bar represents -log(p) value.
Table 3.
Reduced White Matter Volume Associated with Childhood Blood Concentrations at Age 78 Months
| Anatomical Region | Cluster Size (Voxels) | Peak Voxel MNI Coordinates (X,Y,Z) | Peak Voxel TFCE | Voxel P-Value |
|---|---|---|---|---|
|
| ||||
| Cingulate Inferior Frontal Gyrus Medial Frontal Gyrus Middle Frontal Gyrus Orbital Gyrus Superior Frontal Gyrus |
4361 | −5 45 −15 | 8123.55 | 0.034 |
| Cingulate Cuneus Inferior Parietal Lobule Insula Medial Frontal Gyrus Middle Occipital Gyrus Postcentral Gyrus Precentral Gyrus Precuneus Superior Temporal Gyrus |
26652 | 35 −29 26 | 12690.48 | 0.01 |
| Subcallosal Gyrus | 132 | 11 15 −17 | 7202.14 | 0.046 |
| Inferior Frontal Gyrus Medial Frontal Gyrus |
423 | 12 38 −15 | 7218.73 | 0.046 |
| Medial Frontal Gyrus Superior Frontal Gyrus |
286 | 20 50 9 | 7199.75 | 0.047 |
| Cingulate Inferior Parietal Lobule Middle Occipital Gyrus Postcentral Gyrus Precentral Gyrus Precuneus Supramarginal Gyrus |
6013 | −26 −63 41 | 8764.15 | 0.029 |
| Cingulate Medial Frontal Gyrus Supplemental Motor Area |
926 | −17 −7 53 | 7259.18 | 0.045 |
Model adjusted for age at time of imaging, birth weight and total intracranial volume. Voxels and clusters corrected for multiple comparisons (FWE) at P ≤ 0.05 using TFCE. FWE = Familywise Error Rate; MNI = Montreal Neurological Institute; TFCE = Threshold Free Cluster Enhancement
3.3. Total Arrests and Adult VBM
We compared total number of adult arrests with anatomical imaging adjusting for sex, age in 2013, PbB78, age at time of imaging, birth weight and total intracranial volume. VBM analyses in gray matter demonstrated reduced regional volume predominately in the frontal lobe, primarily in the cingulate, dorsomedial prefrontal cortex, ventromedial prefrontal cortex, as well as the medial and superior frontal gyri plus the SMA and precuneus (Fig 3, Table 4). For white matter, trends demonstrating reductions in white matter volume were observed primarily in the cerebellum, thalamus, insula, superior temporal gyrus, and limbic system, including the hippocampus, parahippocampal gyrus, and amygdala (Supplementary Fig 1, Supplementary Table 1). These white matter effects were statistically insignificant in the adjusted model.
Fig 3. Regional gray matter volume loss inversely associated with adult total arrests in 2013 with covariates.

Clusters were corrected for multiple comparisons (FWE = 0.05) using threshold free cluster enhancement. Negative slice numbers = Left hemisphere, Positive slice numbers = Right hemisphere. Color bar represents -log(p) value.
Table 4.
Reduced Gray Matter Volume Associated with Total Arrests
| Anatomical Region | Cluster Size (Voxels) | Peak Voxel MNI Coordinates (X, Y, Z) | Peak Voxel TFCE | Voxel P-Value |
|---|---|---|---|---|
|
| ||||
| Fusiform Gyrus Inferior Temporal Gyrus Middle Temporal Gyrus |
1425 | −44 −6 −42 | 1452.31 | 0.022 |
| Cingulate Inferior Frontal Gyrus Medial Frontal Gyrus Middle Frontal Gyrus Orbital Gyrus Precentral Gyrus Precuneus Superior Frontal Gyrus Supplementary Motor Area |
38891 | −9 14 56 | 2301.93 | 0.002 |
| Cerebellum | 13 | −18 −30 −21 | 1173.27 | 0.049 |
| Cingulate Precuneus |
66 | −14 −57 27 | 1281.16 | 0.034 |
| Cuneus | 27 | 18 −78 24 | 1178.41 | 0.049 |
Model adjusted for age at time of imaging, birth weight, total intracranial volume, age in 2013, sex and PbB78. Voxels and clusters corrected for multiple comparisons (FWE) at P ≤ 0.05 using TFCE. FWE = Familywise Error Rate; MNI = Montreal Neurological Institute; TFCE = Threshold Free Cluster Enhancement
3.4. Total Violent Arrests and Adult VBM
We compared total number of violent arrests with anatomical imaging adjusting for sex, age in 2013, PbB78, age at time of imaging, birth weight and total intracranial volume. VBM analysis demonstrated reduced gray matter volume primarily in the frontal lobe (Fig 4, Table 5). Regions included the superior, middle, medial, and inferior frontal gyri, cingulate, and parts of the pre-and postcentral gyri plus the SMA. In white matter, trends showing reduced volumes were observed primarily in the cerebellum, thalamus, basal ganglia, and limbic portions of the temporal lobe, such as the hippocampus, parahippocampal gyrus, and amygdala (Supplementary Fig 2, Supplementary Table 2). These white matter effects were statistically insignificant in the adjusted model.
Fig 4. Regional gray matter volume loss inversely associated with adult total violent arrests in 2013 with covariates.

Clusters were corrected for multiple comparisons (FWE = 0.05) using threshold free cluster enhancement. Negative slice numbers = Left hemisphere, Positive slice numbers = Right hemisphere. Color bar represents -log(p) value.
Table 5.
Reduced Gray Matter Volume Associated with Total Violent Arrests
| Anatomical Region | Cluster Size (Voxels) | Peak Voxel MNI Coordinates (X, Y, Z) | Peak Voxel TFCE | Voxel P-Value |
|---|---|---|---|---|
|
| ||||
| Cingulate Inferior Frontal Gyrus Medial Frontal Gyrus Middle Frontal Gyrus Superior Frontal Gyrus Supplementary Motor Area Precentral Gyrus |
27149 | −26 24 53 | 12070.09 | 0.013 |
Model adjusted for age at time of imaging, birth weight, total intracranial volume, age in 2013, sex and PbB78. Voxels and clusters corrected for multiple comparisons (FWE) at P ≤ 0.05 using TFCE. FWE = Familywise Error Rate; MNI = Montreal Neurological Institute; TFCE = Threshold Free Cluster Enhancement
3.5. Conjunction of VBM Analyses
From the intersection of VBM analyses between PbB78 and Total Arrests, the conjunction analysis revealed a decrease in gray matter volume in the cingulate, medial frontal gyrus, and SMA (Fig 5, Table 6). From the intersection of VBM analyses between PbB78 and Total Violent Arrests, the conjunction analysis revealed a small decrease in gray matter volume in the superior frontal gyrus and SMA (Fig 6, Table 6). No significant white matter associations were observed.
Fig 5. Conjunction analysis for gray matter loss inversely associated with childhood blood lead concentrations at age 78 months and adult total arrests in 2013. Small volume correction was used to correct for multiple comparisons.
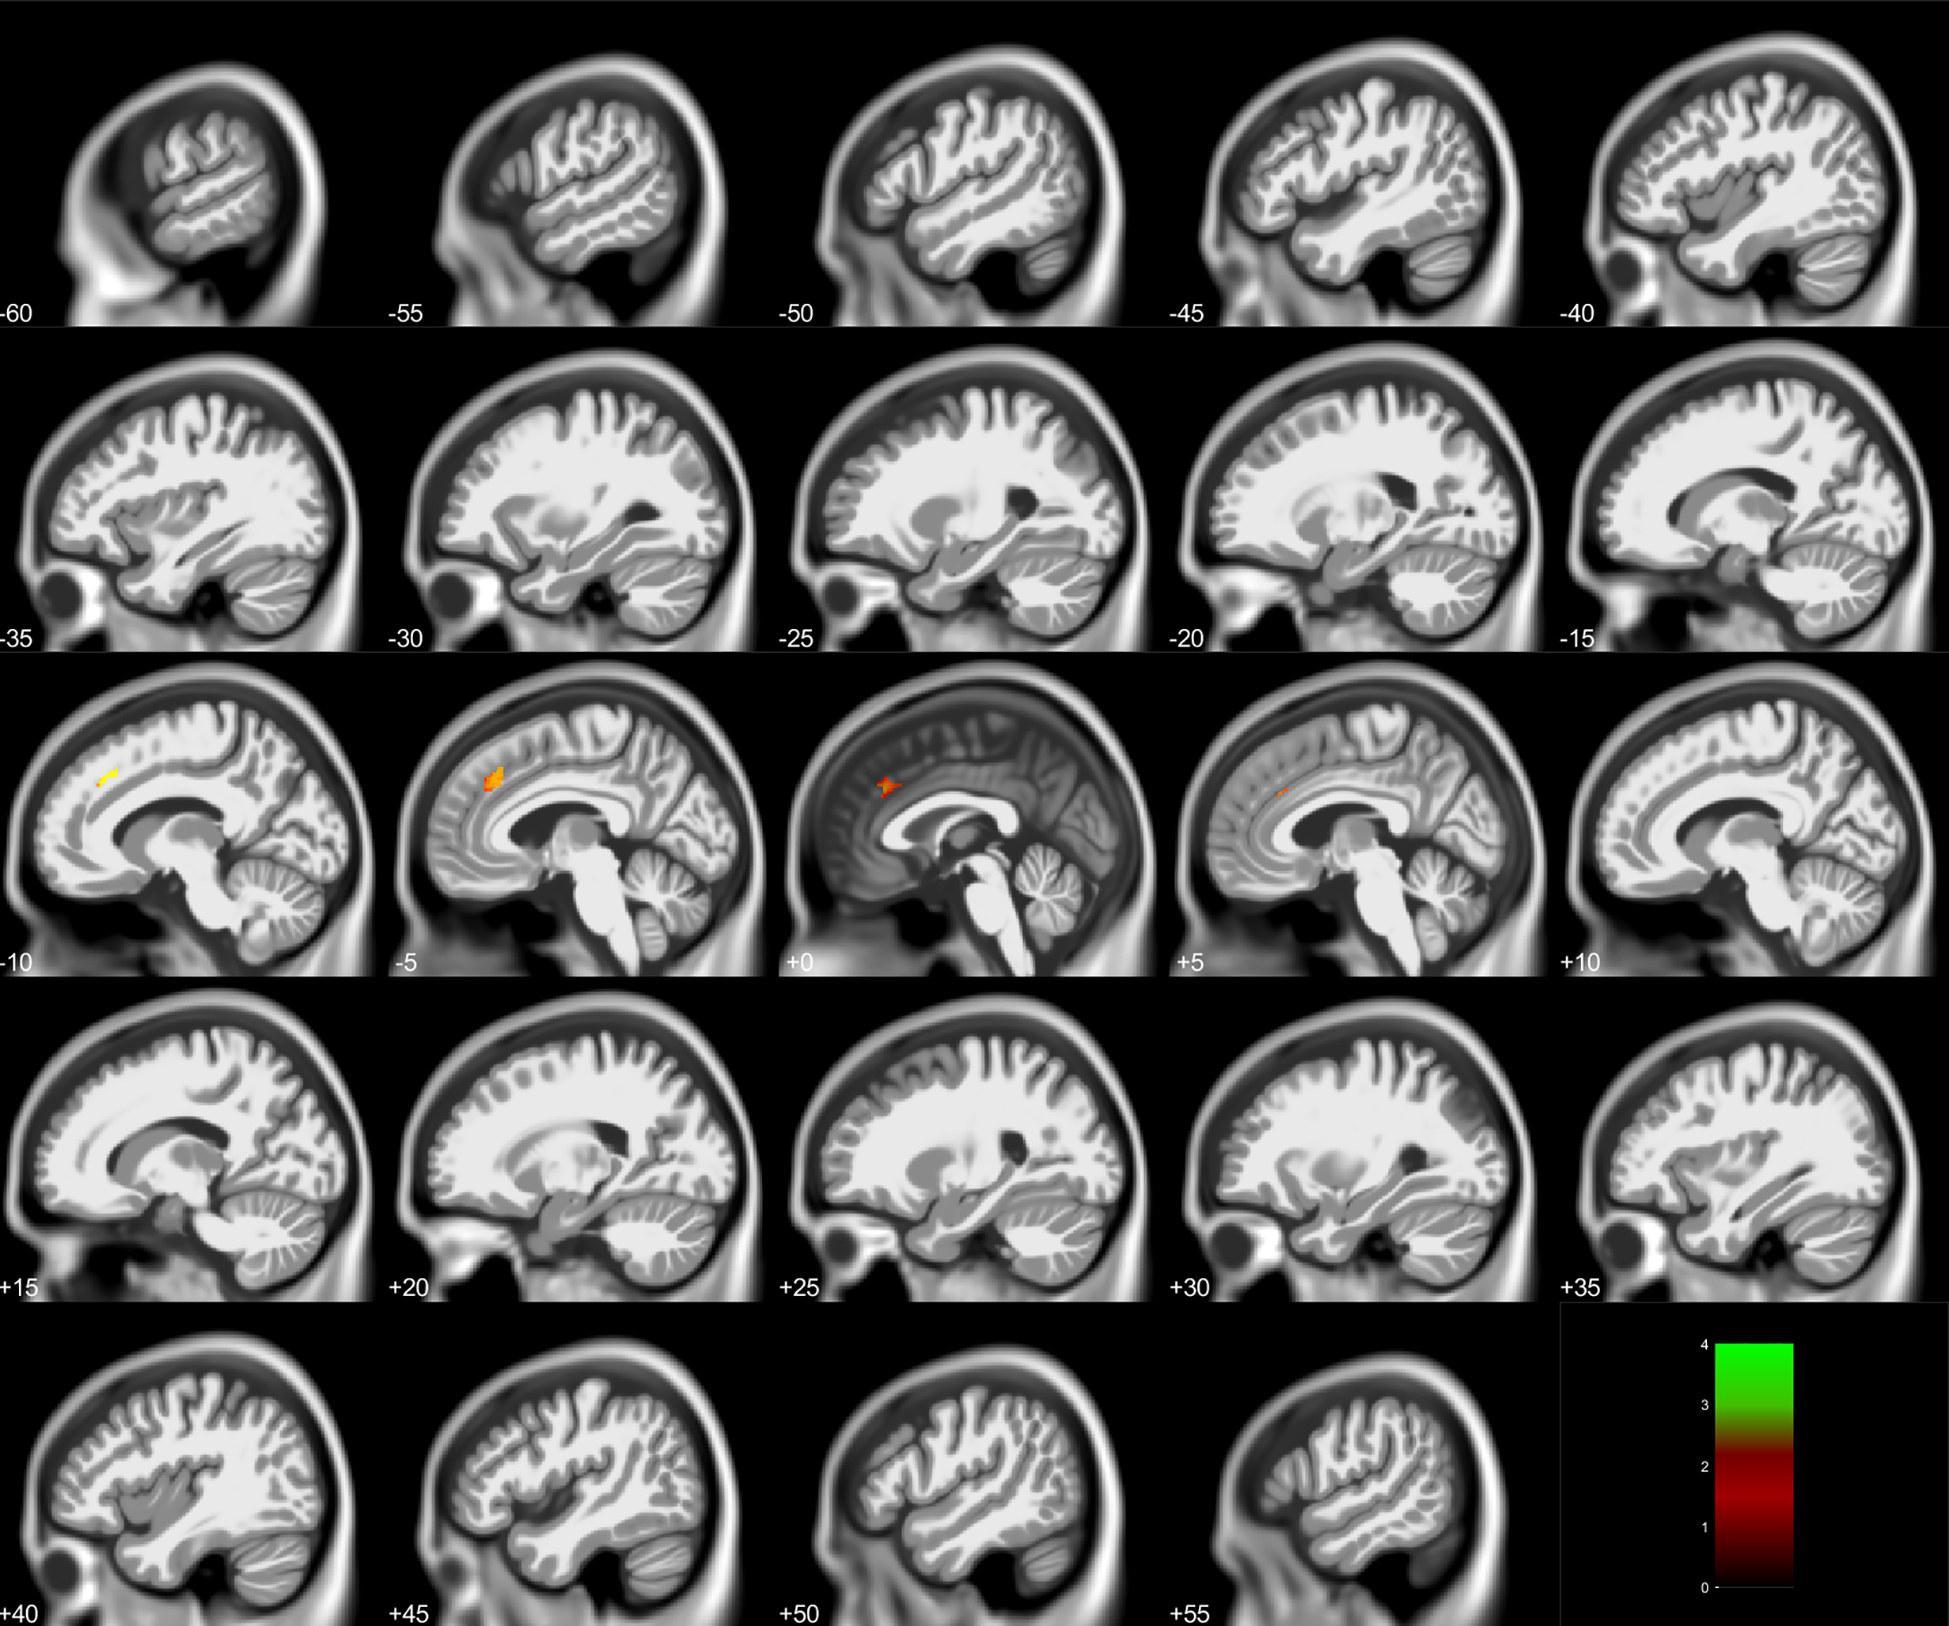
Negative slice numbers = Left hemisphere, Positive slice numbers = Right hemisphere. Color bar represents T-value. Note associations in midline structures between −10 and +5.
Table 6.
Conjunction Analyses Between Childhood Lead Concentrations and Arrests
| Anatomical Region | Cluster Size (Voxels) | Peak Voxel MNI Coordinates (X, Y, Z) | Peak Voxel T | Voxel P-Value |
|---|---|---|---|---|
|
| ||||
| Total Arrests | ||||
| Gray Matter | ||||
| Cingulate Medial Frontal Gyrus |
302 | −12 27 39 | 2.62 | 0.002 |
| Medial Frontal Gyrus | 80 | −3 11 53 | 2.51 | 0.004 |
| Medial Frontal Gyrus | 11 | −3 −2 62 | 2.15 | 0.019 |
| Total Violent Arrests | ||||
| Gray Matter | ||||
| Superior Frontal Gyrus | 11 | −21 12 45 | 2.28 | 0.001 |
| Supplementary Motor Area | 20 | −2 −8 68 | 2.61 | <0.001 |
MNI = Montreal Neurological Institute
Fig 6. Conjunction analysis for gray matter loss inversely associated with childhood blood lead concentrations at age 78 months and adult total violent arrests in 2013.

Small volume correction was used to correct for multiple comparisons. Negative slice numbers = Left hemisphere, Positive slice numbers = Right hemisphere. Color bar represents T-value. Note associations at +0 and-20.
4. Discussion
Numerous epidemiological studies associate environmental lead exposure with lower IQ scores in children (Baghurst et al., 1992; Bellinger et al., 1992; Canfield et al., 2003; Dietrich et al., 1990; Ernhart et al., 1989; Lanphear et al., 2000; Needleman and Gatsonis, 1990; Wasserman et al., 1997). In turn, lower IQ scores are linked to increased delinquent behavior (Huesmann et al., 2002; Moffitt et al., 1981; White et al., 1989). Many studies directly relate early life lead absorption to a variety of behavioral problems, including juvenile delinquency and adult criminal behavior (Marcus et al., 2010; Sampson and Winter, 2018). Sciarillo et al. (1992) observed among 201 African-American, inner-city children ages 2 through 5 years that those with higher lead levels, defined as at least two consecutive blood lead concentrations equal to 15 μg/deciliter, scored higher on the externalizing scales of the Child Behavior Checklist than children with lower lead levels while accounting for maternal factors in the analysis. In a cohort from the Pittsburgh Youth Study evaluated at ages 7 and 11 years, Needleman et al. (1996) observed that increased bone-lead levels were correlated with a greater likelihood for antisocial and delinquent behavior after adjustment for covariates spanning maternal intelligence, SES and quality of child rearing. In a case-control study of 194 youths aged 12–18 years, Needleman (2002) found that delinquency was positively correlated with bone-lead levels while accounting for race, parent education and occupation, presence of two parental figures in the home, number of children in the home and neighborhood crime rate. In 173 Brazilian youths ages 14–18 years, Olympio et al (2010) reported high dental enamel lead levels were associated with increased risk of social problems and rule-breaking behavior with adjustment for familial and social covariates. Naicker et al. (2012) observed an association between destructive behavior and lead exposure in 1041 South African boys and girls at age 13 years with adjustment for a socioeconomic index. Denno (1990) noted that previous exposure to lead predicted juvenile delinquency and adult criminality in a survey of 987 African-American males from Philadelphia. This data, collected between birth and 22 years of age from the Collaborative Perinatal project, considered over 100 predictors of violent and chronic delinquent behavior. Pihl and Ervin (1990) observed that violent incarcerated offenders tended to have higher levels of hair lead and cadmium compared with non-violent offenders without differences in age, socioeconomic status or period of incarceration.
At the aggregate level, associations between air lead concentrations and crime rates have been observed such as those described by Nevin (2007, 2008). Stretesky and Lynch (2001) determined that air lead concentrations predicted homicide rates upon analyzing air pollution for 3,111 counties in the United States. Their analysis included 15 additional variables accounting for other pollutants as well as sociological factors. In a study of 88 counties in Ohio, Haynes et al. (2011) revealed that air lead levels predicted county-level adjudication rates for adolescent offenders with adjustment for urban–rural residence, percentage of African Americans, median family income, percentage of family below poverty, percentage of high school graduation in 25 years and older populations, and population density. Boutwell et al. (2017) analyzed the association between blood lead levels in children under the age of 6 with all violent crime corresponding to the 106 census tracts within St. Louis, Missouri, between 1996 and 2007. The model included an index of concentrated disadvantage, residential mobility and age of the housing stock. Significant associations between aggregated blood lead levels and firearms crimes, assault, robbery, and homicide were observed (Boutwell et al., 2017). Martin and Wolfe (2020) examined aggregate housing characteristics, blood lead concentrations from over 21,000 preschool children, and crime data from 167 census tracts within Boston, Massachusetts. Upon accounting for housing built before 1979 in models of concentrated disadvantage, elevated blood lead levels and crime, their data reveals that the relationship between elevated blood lead levels and crime is stronger in areas with greater disadvantage.
There are many neuroimaging studies evaluating criminal and violent cohorts with several critical reviews and meta-analyses examining antisocial behaviors, aggression, and psychopathy (Brower and Price, 2001; Bufkin and Luttrell, 2005; Deming and Koenigs, 2020; Wahlund and Kristiansson, 2009; Yang and Raine, 2009) without knowledge of lead absorption histories. This literature focuses primarily on gray matter structure and function. In 2001, Brower and Price (2001) reviewed the literature from 1966–2000 for evidence for a causal relationship between abnormal frontal lobe function and violent crime. Their review examined 10 neuroimaging studies with the majority employing nuclear imaging methods, which identified a strong association with increased aggression and reduced prefrontal cortical activity and/or size. Bufkin and Luttrell (2005) further examined the literature in the context of how faulty emotion regulation links with aggression and violence. From 17 functional and structural neuroimaging studies, they reported findings of decreased prefrontal activity and increased subcortical activity within the medial temporal lobe. These features may predispose individuals to antisocial behaviors as evidence supports an association between prefrontal dysfunction and an impulsive subtype of aggressive behavior. Wahlund and Kristiansson’s (2009) review of 48 articles reported a strong connection between dysfunctional frontal and temporal lobes with violent antisocial behavior and psychopathy. A meta-analysis of 43 independent studies conducted by Yang and Raine (2009) determined significant effect sizes for both structural and functional studies in antisocial individuals. Prefrontal structural and functional impairments featured right hemisphere orbitofrontal, left dorsolateral frontal, and right anterior cingulate cortex. With another meta-analysis, a multilevel kernel density analysis of functional MRI studies of psychopathy identified consistent findings across 25 studies of task-related brain activity (Deming and Koenigs, 2020). Psychopathy was related to decreased task-related activity in a region of the dorsal anterior cingulate cortex overlapping within the salience network. Psychopathy was associated with increased task-related activity predominantly in midline cortical regions overlapping with the default mode network (dorsomedial prefrontal cortex, posterior cingulate, and precuneus) as well as medial temporal lobe (including amygdala).
For the current study, we found that while there is a strong relationship with white matter volumes and PbB78 alone, the associations of gray matter volumes with blood lead concentration and arrests emerge from the conjunction analyses. The relationship between PbB78 and regional gray matter brain volume was inversely associated. As lead concentrations increased, the volume decreased for three primary clusters located medially within the frontal and parietal lobes including the cingulate, paracentral lobule (which includes the precentral and postcentral gyri), and SMA, which corresponds to our previous report (Cecil et al., 2008) (Table 2). The relationship between total arrests and regional gray matter brain volume was also inversely associated as higher arrests corresponded with reduced volume in five clusters located in the temporal, frontal and parietal lobes plus the cerebellum (Table 4). The key clusters included the cingulate and extended posterior to the precuneus, plus the frontal gyri (inferior, medial, middle, orbital, superior and precentral) and extended posterior to include the SMA. The relationship between total violent arrests and regional gray matter brain volume shares a portion of the same inverse association found with total arrests in the primary cluster that included the frontal gyri and extended posterior to include the SMA (Table 5). The conjunction analysis of PbB78, total arrests and gray matter identified three clusters that featured the cingulate, medial frontal gyrus and SMA (Table 6). The conjunction analysis of PbB78, total violent arrests and gray matter identified two clusters that featured the superior frontal gyrus and SMA (Table 6).
For the key regions implicated in our conjunction results, we observed a reduction in volume, which implies some level of functional impairment of these regions. The cingulate cortex is part of the limbic system and involved in cognition, emotional regulation, executive functioning, planning, morality, and socially appropriate behaviors (Bush et al., 2000, Vogt 1992). The neural circuits of cognition and emotion are integrated within the cingulate cortex by incorporating cognitive, emotional, sensory and motor information (Cupaioli 2021). However, the cognitive and emotional aspects are managed distinctly (Cupaioli 2021). The anterior portion of the cingulate is mainly involved in executive functions while the posterior portion has evaluative functions (Vogt 1992, Cupaioli et al., 2021). Raine (2019) describes the anterior cingulate as a possible common denominator to antisociality and morality. The cognitive aspects of the anterior cingulate are interconnected with the premotor cortex and SMA, the lateral prefrontal cortex and parietal cortex. The emotional component of the anterior cingulate is connected to the amygdala, hippocampus, anterior insula, hypothalamus, nucleus accumbens, lateral, medial and dorsal prefrontal cortex (Devinsky et al. 1995, Stevens et al. 2011, Beckman et al. 2009, Cupaioli et al., 2021). The amygdala plays an important role in the regulation of fear and other emotions along with violence (DeLisi et al., 2009, Davidson et al., 2000). Our results comparing brain volume with arrests demonstrated only trends for a volumetric reduction within the amygdala. A complex circuit composed of the anterior cingulate, orbital frontal cortex, amygdala and several other regions typically regulate emotion (Davidson, et al., 2000). A provocative or challenging situation will be processed in relation to past emotional conditioning with encoding within the amygdala and related limbic regions (Siever 2008). The amygdala response may trigger an aggressive behavior while the anterior cingulate attempts to modulate the response and serve to suppress behaviors with negative consequences. The anterior cingulate and orbital frontal cortex are involved in the calibration of behavior to social cues and predicting expectancies of reward and punishment. (Siever 2008) Gao and colleagues (2010) found that poor fear conditioning at age 3 predisposes to crime at age 23. Amygdala and prefrontal cortex dysfunction may underlie the lack of fear pertaining to social punishments (Gao 2010). The dorsomedial prefrontal cortex is implicated in handling a sense of self, theory of mind, morality judgements, social impressions, empathy, decision making, and top-down motor cortex inhibition (Gusnard et al. 2001, Mitchell et al. 2004, Narayanan et al. 2006, Ferrari et al. 2016). Functional connectivity in premotor areas has been shown to be related to impulse control (Shannon et al. 2011). The superior frontal gyrus is involved with motor tasks, working memory, attention, and the default mode network (Buckner et al. 2008; du Boisgueheneuc et al. 2006; Li et al. 2013; Martino et al. 2011; Owen 1997). Ly et al. (2012) reports evidence of cortical thinning of the superior frontal gyrus in a study of incarcerated males. Gregory et al. (2012) discovered reduced superior frontal gyrus gray matter in a group with antisocial personality disorder with psychopathy when compared with non-offenders and those with only antisocial personality disorder.
It is important to recognize the limitations of this study. Our measure of criminal behavior, arrests, represented a conservative measurement, was collected from only one county, and likely underestimated an individual’s true criminal involvement. We did not collect any self-report surveys to gauge the level of additional criminal activity. However, there is strong evidence for criminal offenders to commit offenses in nearby locations rather than more distant ones (Hipp 2020, Chamberlain & Hipp 2015), especially violent crime. CLS participants were sampled from a predominately urban African American population born during the period when leaded gasoline was being phased out, which may impact the generalizability of the results to other populations. While minimizing differences in cohort characteristics, most of the studied population lived with single mothers as head of the household (89%) within the lowest two levels for SES. We were not able to address concentrated disadvantage given the homogeneity of the cohort inherent in the study design, which targeted specific urban neighborhoods with known lead hazards. Sample size is also a limitation with this analysis; this is especially appreciated in analyses of white matter associated with arrests, which demonstrated only trends featuring the amygdala, superior temporal gyrus, and cerebellum. Though 174 participants were recruited for this phase of the cohort study, only 158 received MRI examinations and ultimately 123 used in the analyses. Unfortunately, data were collected on MRI scanners from two different vendors due to an equipment upgrade at the medical center (Beckwith et al., 2018). While there is some evidence that the effect of multiple scanners is limited (Teipel et al., 2010) and techniques are available to better harmonize multi-scanner data (Keshavan et al., 2016; Li et al., 2018; Li et al., 2020), we decided to exclude the 32 participants with imaging data collected on an MRI scanner produced by another vendor due to intrinsic differences in the acquisition protocol. Model construction, sample size and composition with respect to sex (more females) compared with the initial VBM analysis (Brubaker et al., 2010; Cecil et al., 2008) of lead exposure within the CLS and the current study are present. Minor differences in the results for gray matter are present; however, the addition of covariates to the model also produces significant reductions in white matter volume with increasing PbB78 levels that were not discovered until the Beckwith et al., 2018 study and the current analyses were performed. While the imaging data used for the psychopathy and the current criminality analysis are derived from the same dataset, differences in post-processing approaches, particularly in correcting for multiple comparisons, influence comparisons of the results. The current study incorporated sex as a covariate to account for differences in arrest rates while the CLS imaging-psychopathy study detected a sex interaction with contrasting imaging relationships with total psychopathy scores between men and women.
5. Conclusion
Our results revealed reduced regional gray matter volumes associated with measures of criminal arrests, and that some of these regions corresponded with frontal lobe volume loss associated with childhood blood lead concentrations. Childhood lead exposure harmed the developing brain, especially the regions that are responsible for cognition, decision making, impulse control, socially driven behaviors, emotional regulation, and risky behaviors. Though these results do not establish causality, they provided evidence suggesting that changes in the brain from lead absorption influences the structure of regions recognized for regulating cognition and social behaviors. Structural volume loss in these regions likely imparted functional deficits within these cognitive and behavioral circuits. Without these key regions and cortical networks functioning appropriately, the behavioral consequences could lead to criminal behaviors when individual and societal factors exert their influences on an individual. Further research is needed to directly explore how lead associated volume loss in strategic regions impact connectivity and functionality within the brain.
Supplementary Material
Acknowledgements
We acknowledge the efforts and are grateful to Dr. Blaise V. Jones, MD, for reviewing the images for incidental findings of potential clinical significance. We also appreciate the cooperation given by all of the participants from the Cincinnati Lead Study.
Funding
This work was supported by the National Institutes of Environmental Health Sciences (NIEHS P01 ES011261, R01 ES015559, R01 ES027224, R01 ES026446 and T32 ES10957) and the United States Environmental Protection Agency (R82938901). The funding agencies played no role in the study design, data collection and analyses, decision to publish or preparation of the manuscript.
Footnotes
Declaration of Interest
The authors have no conflicts of interest to disclose.
Human Subjects Protection
Participants and/or guardians provided informed written consent prior to participation in any research study for the Cincinnati Lead Study. Consent was collected by an investigator or senior research staff member after participants and/or guardians indicated comprehension of the implications of the research. This protocol was reviewed and approved by the institutional review boards at the University of Cincinnati College of Medicine and Cincinnati Children’s Hospital Medical Center.
Declaration of interests
The authors declare that they have no known competing financial interests or personal relationships that could have appeared to influence the work reported in this paper.
Publisher's Disclaimer: This is a PDF file of an unedited manuscript that has been accepted for publication. As a service to our customers we are providing this early version of the manuscript. The manuscript will undergo copyediting, typesetting, and review of the resulting proof before it is published in its final form. Please note that during the production process errors may be discovered which could affect the content, and all legal disclaimers that apply to the journal pertain.
References
- Ashburner J, 2007. A fast diffeomorphic image registration algorithm. Neuroimage. 38, 95–113. [DOI] [PubMed] [Google Scholar]
- Ashburner J, Friston KJ, 2005. Unified segmentation. Neuroimage. 26, 839–51. [DOI] [PubMed] [Google Scholar]
- Baghurst PA, et al. , 1992. Environmental exposure to lead and children’s intelligence at the age of seven years. The Port Pirie Cohort Study. N Engl J Med. 327, 1279–84. [DOI] [PubMed] [Google Scholar]
- Baker LA, et al. , 2007. Genetic and environmental bases of childhood antisocial behavior: a multi-informant twin study. J Abnorm Psychol. 116, 219–35. [DOI] [PMC free article] [PubMed] [Google Scholar]
- Baker LA, et al. , 2008. Differential genetic and environmental influences on reactive and proactive aggression in children. J Abnorm Child Psychol. 36, 1265–78. [DOI] [PMC free article] [PubMed] [Google Scholar]
- Beckmann M, et al. , 2009. Connectivity-based parcellation of human cingulate cortex and its relation to functional specialization. J Neurosci. 29, 1175–90. [DOI] [PMC free article] [PubMed] [Google Scholar]
- Beckwith TJ, et al. , 2018. Reduced regional volumes associated with total psychopathy scores in an adult population with childhood lead exposure. Neurotoxicology. 67, 1–26. [DOI] [PMC free article] [PubMed] [Google Scholar]
- Bellinger DC, et al. , 1992. Low-level lead exposure, intelligence and academic achievement: a long-term follow-up study. Pediatrics. 90, 855–61. [PubMed] [Google Scholar]
- Bornschein RL, et al. , 1985. The Cincinnati prospective study of low-level lead exposure and its effects on child development: protocol and status report. Environ Res. 38, 4–18. [DOI] [PubMed] [Google Scholar]
- Boutwell BB, et al. , 2017. Aggregate-level lead exposure, gun violence, homicide, and rape. PLoS One. 12, e0187953. [DOI] [PMC free article] [PubMed] [Google Scholar]
- Bradley RH, Caldwell BM, 1977. Home observation for measurement of the environment: a validation study of screening efficiency. Am J Ment Defic. 81, 417–20. [PubMed] [Google Scholar]
- Bradley RH, Caldwell BM, 1979. Home observation for measurement of the environment: a revision of the preschool scale. Am J Ment Defic. 84, 235–44. [PubMed] [Google Scholar]
- Brower MC, Price BH, 2001. Neuropsychiatry of frontal lobe dysfunction in violent and criminal behaviour: a critical review. J Neurol Neurosurg Psychiatry. 71, 720–726. [DOI] [PMC free article] [PubMed] [Google Scholar]
- Brubaker CJ, et al. , 2010. The influence of age of lead exposure on adult gray matter volume. Neurotoxicology. 31,259–66. [DOI] [PMC free article] [PubMed] [Google Scholar]
- Buckner RL, et al. , 2008. The brain’s default network: anatomy, function, and relevance to disease. Ann N Y Acad Sci. 1124, 1–38. [DOI] [PubMed] [Google Scholar]
- Bufkin JL, Luttrell VR, 2005. Neuroimaging studies of aggressive and violent behavior: Current findings and implications for criminology and criminal justice. Trauma Violence Abuse. 6, 176–191. [DOI] [PubMed] [Google Scholar]
- Bush G, et al. , 2000. Cognitive and emotional influences in anterior cingulate cortex. Trends Cogn Sci. 4, 215–222. [DOI] [PubMed] [Google Scholar]
- Button KS, 2019. Double-dipping revisited. Nat Neurosci. 22, 688–690. [DOI] [PubMed] [Google Scholar]
- Caldwell BM, Bradley RH, 1978. Administration manual: Home observation for measurement of the environment. University of Arkansas at Little Rock., Little Rock. [Google Scholar]
- Canfield RL, et al. , 2003. Intellectual impairment in children with blood lead concentrations below 10 micrograms per deciliter. N Engl J Med. 348, 1517–26. [DOI] [PMC free article] [PubMed] [Google Scholar]
- Carpenter DO, Nevin R, 2010. Environmental causes of violence. Physiol Behav. 99, 260–8. [DOI] [PubMed] [Google Scholar]
- Cecil KM, et al. , 2008. Decreased brain volume in adults with childhood lead exposure. PLoS Medicine. 5, 741–750. [DOI] [PMC free article] [PubMed] [Google Scholar]
- Chamberlain AW, Hipp JR, 2015. It’s all releative: Concentrated disadvantage within and across neighborhoods and communities, and the consequences for neighborhood crime. J Crim Justice. 43, 431–43. [Google Scholar]
- Cirino PT, et al. , 2002. Measuring socioeconomic status: reliability and preliminary validity for different approaches. Assessment. 9, 145–55. [DOI] [PubMed] [Google Scholar]
- Coscia JM, et al. , 2003. Cognitive development of lead exposed children from ages 6 to 15 years: an application of growth curve analysis. Child Neuropsychol. 9, 10–21. [DOI] [PubMed] [Google Scholar]
- Crowley S, et al. , 2018. Considering total intracranial volume and other nuisance variables in brain voxel based morphometry in idiopathic PD. Brain Imaging Behav. 12, 1–12. [DOI] [PMC free article] [PubMed] [Google Scholar]
- Cupaioli FA, et al. , 2021. The neurobiology of human aggressive behavior: Neuroimaging, genetic, and neurochemical aspects. Prog Neuropsychopharmacol Biol Psychiatry. 106, 110059. [DOI] [PubMed] [Google Scholar]
- Davidson RJ, Putnam KM, & Larson CL, 2000. Dysfunction in the neural circuitry of emotion regulation: A possible prelude to violence. Science. 289, 591–594. [DOI] [PubMed] [Google Scholar]
- Deming P, Koenigs M, 2020. Functional neural correlates of psychopathy: a meta-analysis of MRI data. Transl Psychiatry. 10, 133. [DOI] [PMC free article] [PubMed] [Google Scholar]
- Denno DW, 1990. Biology and violence: from birth to adulthood. Cambridge University, Cambridge England. [Google Scholar]
- Devinsky O, et al. , 1995. Contributions of anterior cingulate cortex to behaviour. Brain. 118 ( Pt 1), 279–306. [DOI] [PubMed] [Google Scholar]
- Dietrich KN, et al. , 1993. The developmental consequences of low to moderate prenatal and postnatal lead exposure: intellectual attainment in the Cincinnati Lead Study Cohort following school entry. Neurotoxicol Teratol. 15, 37–44. [DOI] [PubMed] [Google Scholar]
- Dietrich KN, et al. , 1987. Low-level fetal lead exposure effect on neurobehavioral development in early infancy. Pediatrics. 80, 721–30. [PubMed] [Google Scholar]
- Dietrich KN, et al. , 2001. Early exposure to lead and juvenile delinquency. Neurotoxicol Teratol. 23, 511–8. [DOI] [PubMed] [Google Scholar]
- Dietrich KN, et al. , 1991. Lead exposure and the cognitive development of urban preschool children: the Cincinnati Lead Study cohort at age 4 years. Neurotoxicol Teratol. 13, 203–11. [DOI] [PubMed] [Google Scholar]
- Dietrich KN, et al. , 1992. Lead exposure and the central auditory processing abilities and cognitive development of urban children: the Cincinnati Lead Study cohort at age 5 years. Neurotoxicol Teratol. 14, 51–6. [DOI] [PubMed] [Google Scholar]
- Dietrich KN, et al. , 1990. Lead exposure and neurobehavioral development in later infancy. Environ Health Perspect. 89, 13–9. [DOI] [PMC free article] [PubMed] [Google Scholar]
- DeLisi M, Umphress ZR, Vaughn MG, 2009. The criminology of the amygdala. Crim Justice Behav. 36, 1241–52. [Google Scholar]
- du Boisgueheneuc F, et al. , 2006. Functions of the left superior frontal gyrus in humans: a lesion study. Brain. 129, 3315–28. [DOI] [PubMed] [Google Scholar]
- Ernhart CB, et al. , 1989. Low level lead exposure in the prenatal and early preschool periods: intelligence prior to school entry. Neurotoxicol Teratol. 11, 161–70. [DOI] [PubMed] [Google Scholar]
- Ferrari C, et al. , 2016. The Dorsomedial Prefrontal Cortex Plays a Causal Role in Integrating Social Impressions from Faces and Verbal Descriptions. Cereb Cortex. 26, 156–65. [DOI] [PubMed] [Google Scholar]
- Friston KJ, et al. , 1999. Multisubject fMRI studies and conjunction analyses. Neuroimage. 10, 385–96. [DOI] [PubMed] [Google Scholar]
- Friston KJ, et al. , 2005. Conjunction revisited. Neuroimage. 25, 661–7. [DOI] [PubMed] [Google Scholar]
- Gao Y, et al. , 2010. Association of Poor Childhood Fear Conditioning and Adult Crime. 167, 56–60. [DOI] [PubMed] [Google Scholar]
- Gregory S, et al. , 2012. The Antisocial Brain: Psychopathy Matters A Structural MRI Investigation of Antisocial Male Violent Offenders. Arch Gen Psych. 69, 962–972. [DOI] [PubMed] [Google Scholar]
- Gusnard DA, et al. , 2001. Medial prefrontal cortex and self-referential mental activity: relation to a default mode of brain function. Proc Natl Acad Sci U S A. 98, 4259–64. [DOI] [PMC free article] [PubMed] [Google Scholar]
- Guxens M, et al. , 2018. Air Pollution Exposure During Fetal Life, Brain Morphology, and Cognitive Function in School-Age Children. Biol Psychiatry. 84, 295–303. [DOI] [PubMed] [Google Scholar]
- Haines D, 2008. Neuroanatomy: An atlas of structures, sections, and systems. Lippincott Williams & Wilkins., Philadelphia, PA. [Google Scholar]
- Hare RD, et al. , 2000. Psychopathy and the predictive validity of the PCL-R: an international perspective. Behav Sci Law. 18, 623–45. [DOI] [PubMed] [Google Scholar]
- Haukvik UK, et al. , 2014. Normal birth weight variation is related to cortical morphology across the psychosis spectrum. Schizophr Bull. 40, 410–9. [DOI] [PMC free article] [PubMed] [Google Scholar]
- Haynes EN, et al. , 2011. Exposure to airborne metals and particulate matter and risk for youth adjudicated for criminal activity. Environ Res. 111, 1243–8. [DOI] [PMC free article] [PubMed] [Google Scholar]
- Hill J, Nathan R, 2008. Childhood antecedents of serious violence in adult male offenders. Aggress Behav. 34, 329–38. [DOI] [PubMed] [Google Scholar]
- Hipp JR, 2020. Simulating spatial crime patterns: What do we learn in standard ecological studies of crime? J Crim Justice. 70, 101727. [Google Scholar]
- Hornung RW, et al. , 2009. Age of greatest susceptibility to childhood lead exposure: a new statistical approach. Environ Health Perspect. 117, 1309–12. [DOI] [PMC free article] [PubMed] [Google Scholar]
- Huesmann LR, et al. , 2002. Childhood predictors of adult criminality: are all risk factors reflected in childhood aggressiveness? Crim Behav Ment Health. 12, 185–208. [DOI] [PubMed] [Google Scholar]
- Keshavan A, et al. , 2016. Power estimation for non-standardized multisite studies. Neuroimage. 134, 281–294. [DOI] [PMC free article] [PubMed] [Google Scholar]
- Kosterman R, et al. , 2001. Childhood risk factors for persistence of violence in the transition to adulthood: a social development perspective. Violence Vict. 16, 355–69. [PubMed] [Google Scholar]
- Kriegeskorte N, et al. , 2010. Everything you never wanted to know about circular analysis, but were afraid to ask. J Cereb Blood Flow Metab. 30, 1551–7. [DOI] [PMC free article] [PubMed] [Google Scholar]
- Kriegeskorte N, et al. , 2009. Circular analysis in systems neuroscience: the dangers of double dipping. Nat Neurosci. 12, 535–40. [DOI] [PMC free article] [PubMed] [Google Scholar]
- Lanphear BP, et al. , 2000. Cognitive deficits associated with blood lead concentrations <10 microg/dL in US children and adolescents. Public Health Rep. 115, 521–9. [DOI] [PMC free article] [PubMed] [Google Scholar]
- Li H, et al. , 2018. Combining Multi-Site/Multi-Study MRI Data: Linked-ICA Denoising for Removing Scanner and Site Variability from Multimodal MRI Data BioRxiv. 1, 337576. [Google Scholar]
- Li H, et al. , 2020. Denoising scanner effects from multimodal MRI data using linked independent component analysis. Neuroimage. 208, 116388. [DOI] [PubMed] [Google Scholar]
- Li W, et al. , 2013. Subregions of the human superior frontal gyrus and their connections. Neuroimage. 78, 46–58. [DOI] [PubMed] [Google Scholar]
- Lilienfeld SO, Andrews BP, 1996. Development and preliminary validation of a self-report measure of psychopathic personality traits in noncriminal populations. J Pers Assess. 66, 488–524. [DOI] [PubMed] [Google Scholar]
- Little RJA, 1988. A Test of Missing Completely at Random for Multivariate Data with Missing Values. J Am Stat Assoc. 83, 1198–1202. [Google Scholar]
- Ly M, et al. , 2012. Cortical Thinning in Psychopathy. Am J Psychiatry. 169, 743–749. [DOI] [PMC free article] [PubMed] [Google Scholar]
- Marcus DK, et al. , 2010. Lead and conduct problems: a meta-analysis. J Clin Child Adolesc Psychol. 39, 234–41. [DOI] [PubMed] [Google Scholar]
- Martin TE, Wolfe SE, 2020. Lead exposure, concentrated disadvantage, and violent crime rates. Justice Q. 37, 1–24. [Google Scholar]
- Martino J, et al. , 2011. Intrasurgical mapping of complex motor function in the superior frontal gyrus. Neuroscience. 179, 131–42. [DOI] [PubMed] [Google Scholar]
- Mitchell JP, et al. , 2004. Encoding-specific effects of social cognition on the neural correlates of subsequent memory. J Neurosci. 24, 4912–7. [DOI] [PMC free article] [PubMed] [Google Scholar]
- Moffitt TE, et al. , 1981. Socioeconomic status, IQ, and delinquency. J Abnorm Psychol. 90, 152–6. [DOI] [PubMed] [Google Scholar]
- Naicker N, et al. , 2012. Environmental lead exposure and socio-behavioural adjustment in the early teens: the birth to twenty cohort. Sci Total Environ. 414, 120–5. [DOI] [PubMed] [Google Scholar]
- Narayanan NS, Laubach M, 2006. Top-down control of motor cortex ensembles by dorsomedial prefrontal cortex. Neuron. 52, 921–31. [DOI] [PMC free article] [PubMed] [Google Scholar]
- Needleman HL, Gatsonis CA, 1990. Low-level lead exposure and the IQ of children. A meta-analysis of modern studies. JAMA. 263, 673–8. [PubMed] [Google Scholar]
- Needleman HL, et al. , 2002. Bone lead levels in adjudicated delinquents. A case control study. Neurotoxicol Teratol. 24, 711–7. [DOI] [PubMed] [Google Scholar]
- Needleman HL, et al. , 1996. Bone lead levels and delinquent behavior. JAMA. 275, 363–369. [PubMed] [Google Scholar]
- Nevin R, 2007. Understanding international crime trends: the legacy of preschool lead exposure. Environ Res. 104, 315–36. [DOI] [PubMed] [Google Scholar]
- Nevin R, et al. , 2008. Monetary benefits of preventing childhood lead poisoning with lead-safe window replacement. Environ Res. 106, 410–9. [DOI] [PubMed] [Google Scholar]
- Nilsson KW, et al. , 2014. Genotypes do not confer risk for delinquency but rather alter susceptibility to positive and negative environmental factors: gene-environmentinteractions of BDNF Val66Met, 5-HTTLPR, and MAOA-uVNTR. Int J Neuropsychopharmacol. 18, 107. [DOI] [PMC free article] [PubMed] [Google Scholar]
- Nolte J, Angevine J, 2007. The human brain in photographs and diagrams. Mosby, Philadelphia, PA. [Google Scholar]
- Oishi K, et al. , 2011. MRI atlas of human white matter. Elsevier/Academic Press, Amsterdam. [Google Scholar]
- Olympio KP, et al. , 2010. Surface dental enamel lead levels and antisocial behavior in Brazilian adolescents. Neurotoxicol Teratol. 32, 273–9. [DOI] [PubMed] [Google Scholar]
- Owen AM, 1997. The functional organization of working memory processes within human lateral frontal cortex: The contribution of functional neuroimaging. Eur J Neurosci. 9, 1329–1339. [DOI] [PubMed] [Google Scholar]
- Pihl RO, Ervin F, 1990. Lead and Cadmium Levels in Violent Criminals. Psycholl Rep. 66, 839–844. [DOI] [PubMed] [Google Scholar]
- Poldrack RA, et al. , 2017. Scanning the horizon: towards transparent and reproducible neuroimaging research. Nat Rev Neurosci. 18, 115–126. [DOI] [PMC free article] [PubMed] [Google Scholar]
- Raine A, 2019. The neuromoral theory of antisocial, violent, and psychopathic behavior. Psychiatry Res. 277, 64–69. [DOI] [PubMed] [Google Scholar]
- Rhee SH, Waldman ID, 2002. Genetic and environmental influences on antisocial behavior: a meta-analysis of twin and adoption studies. Psychol Bull. 128, 490–529. [PubMed] [Google Scholar]
- Ris MD, et al. , 2004. Early exposure to lead and neuropsychological outcome in adolescence. J Int Neuropsychol Soc. 10, 261–70. [DOI] [PubMed] [Google Scholar]
- Roda SM, et al. , 1988. Anodic stripping voltammetry procedure modified for improved accuracy of blood lead analysis. Clin Chem. 34, 563–7. [PubMed] [Google Scholar]
- Sampson RJ, Winter AS, 2018. Poisoned Development: Assessing Childhood Lead Exposure as a Cause of Crime in a Birth Cohort Followed Through Adolescence. Criminology. 56, 269–301. [Google Scholar]
- Savage J, Understandng Persistent Offending: Linking Developmental Psychology with Research on the Criminal Career. In: Savage J, (Ed.), The Development of Persistent Criminality. University Press, Oxford: NY, 2009, pp. 3–33. [Google Scholar]
- Sciarillo WG, et al. , 1992. Lead-Exposure and Child-Behavior. American Journal of Public Health. 82, 1356–1360. [DOI] [PMC free article] [PubMed] [Google Scholar]
- Shannon BJ, et al. , 2011. Premotor functional connectivity predicts impulsivity in juvenile offenders. Proc Natl Acad Sci U S A. 108, 11241–11245. [DOI] [PMC free article] [PubMed] [Google Scholar]
- Siever LJ, 2008. Neurobiology of Aggression and Violence. Am J Psych. 165, 429–442. [DOI] [PMC free article] [PubMed] [Google Scholar]
- Silverstein AB, 1985. Two- and four-subtest short forms of the WAIS-R: a closer look at validity and reliability. J Clin Psychol. 41, 95–7. [DOI] [PubMed] [Google Scholar]
- Simonoff E, et al. , 2004. Predictors of antisocial personality. Continuities from childhood to adult life. Br J Psychiatry. 184, 118–27. [DOI] [PubMed] [Google Scholar]
- Smith SM, Nichols TE, 2009. Threshold-free cluster enhancement: addressing problems of smoothing, threshold dependence and localisation in cluster inference. Neuroimage. 44, 83–98. [DOI] [PubMed] [Google Scholar]
- Stevens FL, et al. , 2011. Anterior cingulate cortex: unique role in cognition and emotion. J Neuropsychiatry Clin Neurosci. 23, 121–5. [DOI] [PubMed] [Google Scholar]
- Stretesky PB, Lynch MJ, 2001. The relationship between lead exposure and homicide. Arch Pediatr Adolesc Med. 155, 579–82. [DOI] [PubMed] [Google Scholar]
- Teipel SJ, et al. , 2010. Multicentre variability of MRI-based medial temporal lobe volumetry in Alzheimer’s disease. Psychiatry Res. 182, 244–50. [DOI] [PubMed] [Google Scholar]
- Vogt BA, et al. , 1992. Functional heterogeneity in cingulate cortex: the anterior executive and posterior evaluative regions. Cereb Cortex. 2, 435–43. [DOI] [PubMed] [Google Scholar]
- Vul E, Pashler H, 2012. Voodoo and circularity errors. Neuroimage. 62, 945–8. [DOI] [PubMed] [Google Scholar]
- Wahlund K, Kristiansson M, 2009. Aggression, psychopathy and brain imaging - Review and future recommendations. Int J Law Psychiatry. 32, 266–71. [DOI] [PubMed] [Google Scholar]
- Wasserman GA, et al. , 1997. Lead exposure and intelligence in 7-year-old children: The Yugoslavia prospective study. Environ Health Perspect. 105, 956–962. [DOI] [PMC free article] [PubMed] [Google Scholar]
- Weder N, et al. , 2009. MAOA genotype, maltreatment, and aggressive behavior: the changing impact of genotype at varying levels of trauma. Biol Psychiatry. 65, 417–24. [DOI] [PMC free article] [PubMed] [Google Scholar]
- White JL, et al. , 1989. A Prospective Replication of the Protective Effects of IQ in Subjects at High-Risk for Juvenile-Delinquency. J Consult Clin Psychol. 57, 719–724. [DOI] [PubMed] [Google Scholar]
- Worsley KJ, et al. , 1996. A unified statistical approach for determining significant signals in images of cerebral activation. Hum Brain Mapp. 4, 58–73. [DOI] [PubMed] [Google Scholar]
- Wright JP, et al. , 2009. Blood Lead Levels in Early Childhood Predict Adulthood Psychopathy. Youth Violence Juv Justice. 7, 208–222. [Google Scholar]
- Wright JP, et al. , 2008. Association of prenatal and childhood blood lead concentrations with criminal arrests in early adulthood. PLoS Med. 5, e101. [DOI] [PMC free article] [PubMed] [Google Scholar]
- Wright JP, et al. , 2021. Developmental lead exposure and adult criminal behavior: A 30-year prospective birth cohort study. Neurotoxicol Teratol. 106960. [DOI] [PMC free article] [PubMed] [Google Scholar]
- Yang Y, Raine A, 2009. Prefrontal structural and functional brain imaging findings in antisocial, violent, and psychopathic individuals: a meta-analysis. Psychiatry Res. 174, 81–8. [DOI] [PMC free article] [PubMed] [Google Scholar]
Associated Data
This section collects any data citations, data availability statements, or supplementary materials included in this article.