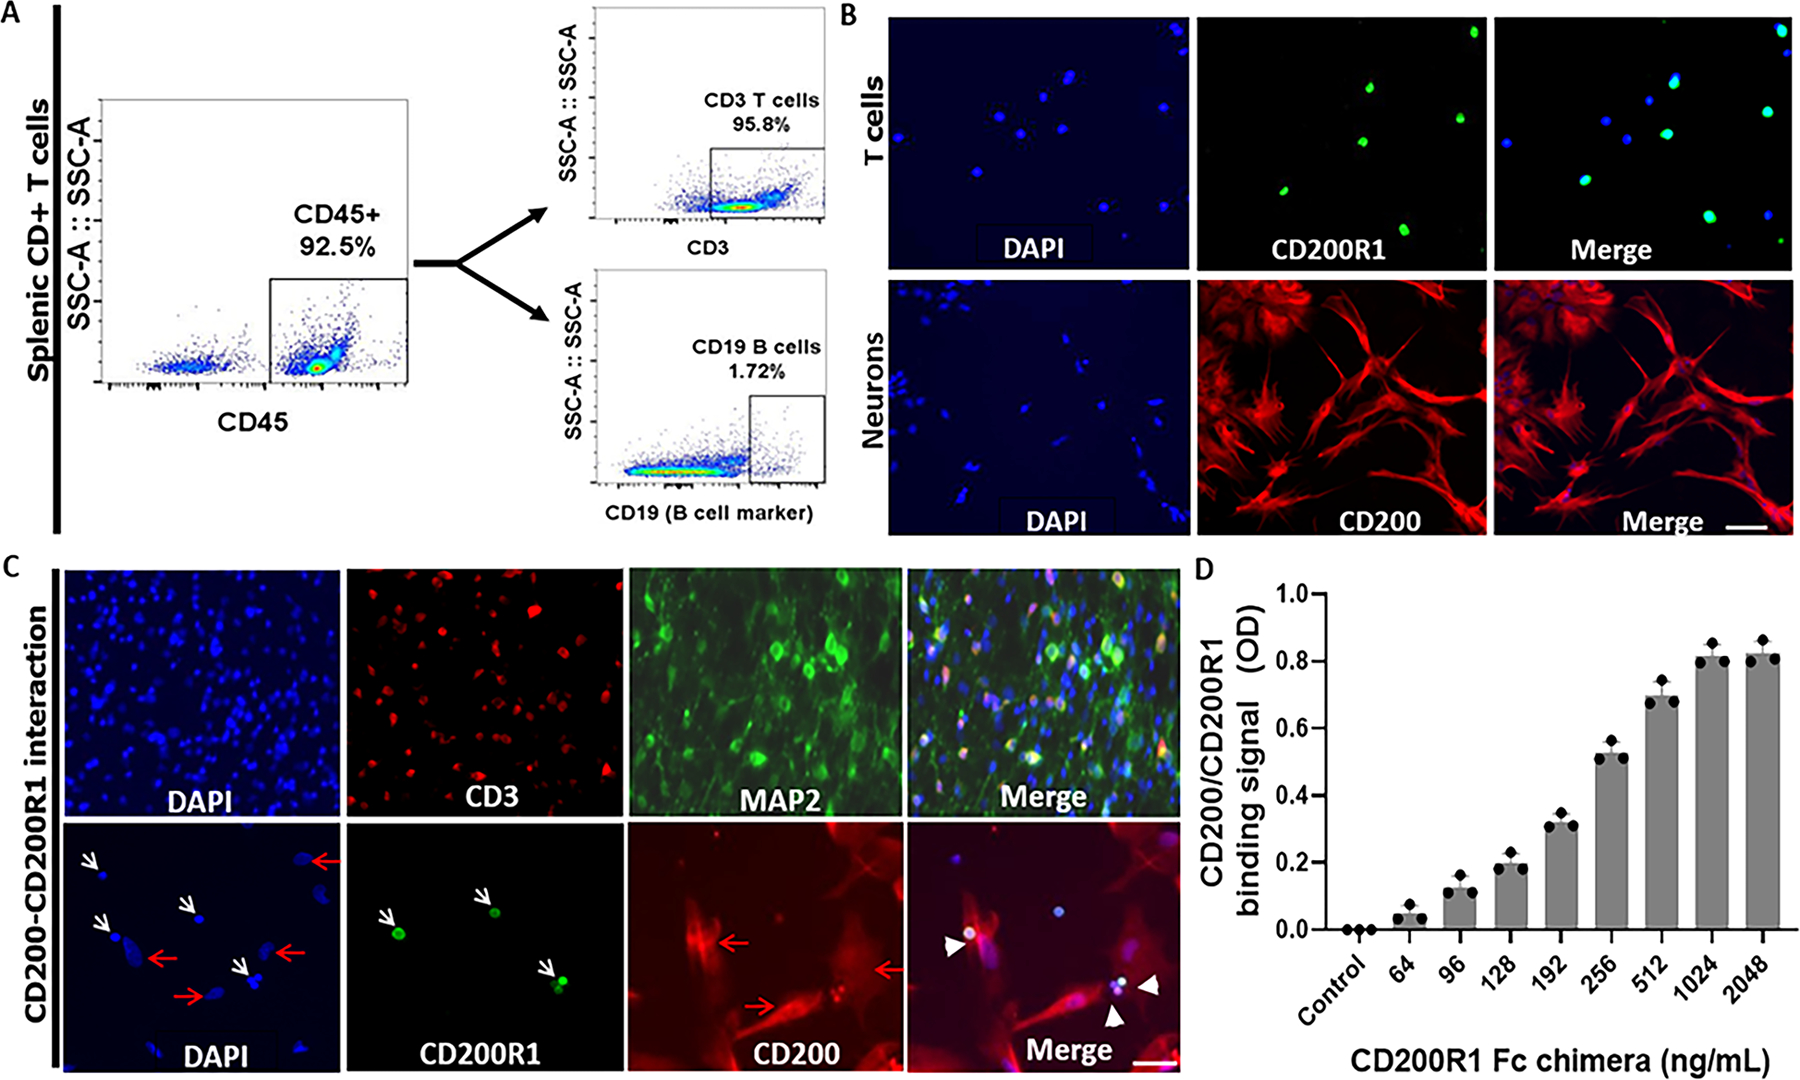
Figure 6.

Interaction of neuronal CD200 with lymphocytic CD200R1. (A) The purity of CD45+CD3+ T cells from spleens of C57BL/6 mice were confirmed by flow cytometry. (B) Representative ICC images showed splenic CD3+ T cells express CD200R1 (upper panels; green) and cultured primary neurons express CD200 (lower panels; red). (C) Neurons interact with CD3+ T cells. Upper panels, colocalization of CD3 (marker for T cells) and MAP2 (marker for neurons). Lower panels, colocalization of CD200 ligand on neurons and CD200R1 on T cells. White arrows indicate T cells; red arrows indicate neurons; white arrow heads indicate the interaction of CD200 with CD200R. Scale bar=100 μm. (D) ELISA binding assay of mouse biotinylated CD200Fc chimera protein with mouse CD200R1 chimera protein (captured by anti-CD200R1 antibody) immobilized on a Nunc™ MaxiSorp™ ELISA plate and in a concentration dependent manner (n = 4 assays per group). Control ELISA wells were without CD200R1 Fc chimera protein.
