

Abstract
The trimeric thrombospondin homologs, TSP1 and TSP2, are both components of bone tissue and contribute in redundant and distinct ways to skeletal physiology. TSP1-null mice display increased femoral cross-sectional area and thickness due to periosteal expansion, as well as diminished matrix quality and impaired osteoclast function. TSP2-null mice display increased femoral cross-sectional thickness and reduced marrow area due to increased endosteal osteoblast activity, with very little periosteal expansion. Osteoblast lineage cells are reduced in TSP2-null mice, but not in TSP1-null. The functional effects of combined TSP1 and TSP2 deficiency remain to be elucidated. Here, we examined the spectrum of detergent soluble proteins in diaphyseal cortical bone of growing (6-week old) male and female mice deficient in both thrombospondins (double knockout (DKO)). Of 3,429 detected proteins, 195 were differentially abundant in both male and female DKO bones. Physiologically relevant annotation terms identified by Ingenuity Pathway Analysis included “ECM degradation” and “Quantity of Monocytes.” Manual inspection revealed that a number of proteins with shared expression among osteoclasts and osteocytes were reduced in DKO bones. To associate changes in protein content with phenotype, we examined 12-week old male and female DKO and WT mice. DKO mice were smaller than WT and in male DKO, femoral cross section area was reduced. Some of the male DKO femora also had a flattened, less circular cross-section. Male DKO bones were less stiff in bending and they displayed reduced ultimate load. Displacements at yield load and at max load were both elevated in male DKO. However, the ratios of post-yield to pre-yield displacements significantly diminished in DKO suggesting proportionally reduced post-yield behavior. Male DKO mice also exhibited reductions in trabecular bone mass, which were surprisingly associated with equivalent osteoblast numbers and accordingly increased osteoblast surface. Marrow-derived colony forming unit-fibroblastic was reduced in male and female DKO mice. Together our data suggest that when both TSP1 and TSP2 are absent, a unique, sex-specific bone phenotype not predicted by the single knockouts, is manifested.
Introduction
The trimeric thrombospondins, TSP1 and TSP2, are matricellular proteins with a high degree of sequence similarity (1,2) that have overlapping and unique functions. Phenotypes of TSP1 and TSP2 null mice are distinct due in part to tissue-specific patterns of gene expression. For example, in the developing lung, TSP1 is expressed in bronchial epithelium while TSP2 is restricted to the surrounding connective tissue (3). In developing liver, TSP1 mRNA levels are higher than TSP2 (3). One exception is the skeleton, where TSP1 and TSP2 are both components of bone ECM (4–6). TSP1 and TSP2 are secreted by MSC and osteoblasts. TSP2 expression increases with osteoblast commitment (7) and stays constant during osteocyte maturation (8). In contrast, TSP1 expression decreases during osteocyte maturation (8).
TSP1−/− and TSP2−/− mice each display distinct alterations in skeletal morphology and bone matrix quality (5,9,10). Examination of bone tissues and MSC-osteoblasts from TSP1 and TSP2 deficient mice reveals that both facilitate collagen matrix maturation in the skeleton. (11,12). In addition, both thrombospondins are potent inhibitors of angiogenesis (13). TSP1 and TSP2 also have distinct effects on skeletal progenitor cell (MSC) biology. TSP2 inhibits MSC proliferation (10) and it promotes osteoblast lineage progression at the expense of adipogenesis (7). In committed osteoblasts, TSP2-deficiency is associated with impaired matrix maturation and mineralization (12,14). Conversely, TSP1 inhibits osteoblast differentiation of human (15) and mouse osteoblast lineage cells (16). Osteoclasts of TSP1−/− and TSP2−/− mice likely also have overlapping functional deficits (9,17).
We used proteomics analysis of RIPA buffer soluble proteins to identify candidate effects of TSP1 and TSP2 double deficiency on cellular physiology in diaphyseal cortical bone. A number of proteins with overlapping expression in both osteoclasts and osteocytes were reduced in both male and female DKO bones. As well, DKO bones exhibited altered expression of a number of additional genes expressed by osteocytes. We used nanoCT, mechanical testing, histology, and in vitro studies to determine the extent to which these changes were associated with altered bone metabolism in the DKO skeleton. The effects of TSP1-TSP2 double knockout on dermal wound healing, stroke recovery, synapse formation and inhibition of ocular angiogenesis have been documented (18–21), but to our knowledge, this is the first analysis of the TSP1-TSP2 double knockout skeleton. Our data suggest that dual deficiency of TSP1 and TSP2 uniquely affects bone mass and matrix quality in male mice.
Methods
Animals
All animal procedures were performed at the University of Michigan under Institutional Animal Care and Use Committee (IACUC) approval and complied with NIH guidelines outlined in the Guide for the Care and Use of Laboratory Animals. We maintain colonies of TSP1−/− ((22); The Jackson Laboratories) and TSP2−/− (23) mice on the C57BL/6J background. TSP1-TSP2 double knockout (DKO) mice were generated by compound heterozygous breeding and by maintaining homozygous double deficient colonies. As such, littermates and cage mates are represented in the data. Animals were housed under specific pathogen free conditions and had free access to standard chow, water, and cage activity. 6-week old male and female mice, as well as 12-week old male and female mice, were used in this study.
Procurement of Skeletal Tissue for Proteomics Analysis
6-week old male and female mice were sacrificed by CO2 inhalation. Femora were dissected, cleaned of soft tissue with a Kim Wipe, flash frozen in liquid nitrogen and stored at −80°C. On the day of protein extraction, bones were cut over ice using a #10-scalpel blade. Proximal ends were cut at the greater trochanter, marrow contents were removed by centrifugation and distal ends were separated from the mid-diaphysis. The remaining diaphyseal cortical shell was immediately homogenized in RIPA buffer as outlined below.
Bone Protein Extraction
Bone was crushed and homogenized on ice with a polytron in RIPA buffer containing the Complete Protease Inhibitor Cocktail (Roche). Extracts were incubated 4 hours at 4°C with rocking. Samples were then centrifuged at 12,000 rpm for 20 minutes at 4°C. The supernatant was collected and protein concentrations were determined using the BCA assay. RIPA-insoluble pellets, which contain cross-linked mature collagenous ECM, were not analyzed in this study.
TMT Proteomics
In order to obtain adequate amounts of protein for the TMT assay, cortical bone from 3 animals per genotype and sex were combined. TMT proteomic analysis was conducted at the Proteomics Research Facility at the University of Michigan Department of Pathology. Equal amounts of protein were digested with trypsin, multiplexed using the TMT-10plex mass tag labeling kit (ThermoFisher) and fractionated using 2D liquid chromatography. Peptide sequences were obtained via mass spec (Orbitrap fusion). Proteins were identified using Proteome Discoverer (v 2.1). Valid spectra were distinguished from false ones using a machine learning algorithm called Percolator that is part of Proteome Discover software package (24). Only spectra with FDR ≤ 1% were considered true spectra. 3,924 proteins met our selection criteria of ≥ 2 peptide spectral matches with FDR ≤ 1%. Normalized abundance values were obtained against the total peptide signal. The mass spectrometry proteomics data have been deposited to the ProteomeXchange Consortium via the PRIDE partner repository with the dataset identifier PXD020832. Normalized abundance values of TSP-deficient samples were compared to WT. Ratios ≤ 0.55 and ≥1.95 compared to WT within the same sex were considered differentially abundant. Here, we present proteins that were differentially abundant in both male and female DKO bones; the intersection of the Venn diagram shown in Figure 1. Potential physiological consequences of TSP1-TSP2 double knockout were also identified in IPA (QIAGEN Inc., https://www.qiagenbioinformatics.com/products/ingenuity-pathway-analysis).
Figure 1. TSP1 and TSP2 double knock out has over-lapping and unique effects on levels of individual proteins in male and female cortical bone.

Venn Diagram summarizing the number of differentially abundant proteins in female DKO bones only (left), male DKO bones only (right) and both male and female DKO bones (intersection). The affected proteins are presented in Table S1.
Determination of cell types represented by the proteins recovered
Because our protein extraction protocol was not expected to recover all proteins present in bone, we utilized CTen (Cell Type enrichment analysis) (25) to estimate which bone cell types most likely contributed to the proteins recovered. We also manually compared proteins recovered in our study to an RNAseq dataset obtained during in vitro maturation of an osteocyte cell line (8).
Bone Phenotyping
12-week old mice (12 male WT; 9 male DKO; 5 female WT; 6 female DKO) were utilized for skeletal phenotyping studies. At 11 weeks of age, the mice underwent fluorochrome labeling at 7 days (Calcein 30 mg/kg IP) and 2 days (Alizarin Complexone 10 mg/kg IP) before harvest at 12 weeks of age. Animal mass and length was recorded at sacrifice. Right femora were subject to nanoCT and 4-point bending as outlined below. Left femora were fixed in 10% Neutral Buffered Formalin, embedded in plastic and bisected transversely just distal to the lateral third trochanter. Thick transverse sections were obtained from the proximal surface to assess diaphyseal cortical bone formation and thin longitudinal sections were obtained from the distal end to assess metaphyseal trabecular bone formation. Clear double label at the periosteal surface was only achieved in a subset of the femora and so only static histology is presented here.
NanoCT
NanoCT was conducted as described (26). Specimens were immobilized inside a plastic tube and scanned using a nanotom M nanoCT (phoenix x-ray, GE Measurement & Control; Wunstorf, Germany). The X-ray tube was powered to 80 kV and 400 μA, utilized a diamond coated tungsten target, a 0.381mm aluminum filter, and was set to a spot size of 0. Imaging used an exposure time of 500ms; 3 frames averaged and 1 skipped for each rotation. The sample stage rotated through 360 degrees and collected 2000 images per scan. A custom calibration phantom containing regions of air, water, and a 1.2 mm square rod of 1.69 mg/cc hydroxyapatite mimicker (Gammex) was included in all scans to generate a measure of tissue mineral density. Image acquisition and reconstruction of raw data were performed using Datos|x 2 version 2.6.1 (phoenix x-ray, GE Measurement & Control; Wunstorf, Germany). 3D images were reconstructed at 8 μm isotropic voxel size and analyzed in Microview ABA 2.2. Images were aligned such that the long axis of the bone was positioned along the Z-axis with the femoral head pointed in the positive Z direction and the 3rd trochanter pointed in the positive Y direction. The proximal end of the bone, the base of the 3rd trochanter, the proximal end of the distal growth plate and the distal end of the bone were located. The length of the bone was calculated using the proximal and distal ends. The Z height of the cortical and trabecular ROIs were set at 15% of the length of the bone. The cortical ROI was positioned at the base of the third trochanter and extended distally. The trabecular ROI was located in the distal metaphysis adjacent to the distal growth plate and extended proximally. Otsu thresholding was utilized to determine bone vs. non-bone voxels within each ROI.
4-point bending
Four-point bending was conducted as described (5). Briefly, after nanoCT scanning, femora were loaded to failure in the anterior-posterior direction at 0.5 mm/s using a servohydraulic testing machine with upper and lower supports 6.26 and 2.085 mm apart, respectively (858 Minibiox II; MTS Systems, Eden Prairie, MN). The posterior side was in tension. Crosshead displacement was recorded using an external variable differential transducer (LVDT; Lucas Schavitts, Hampton, VA), and load data collected with a 50-lb load cell (Sensotec, Columbus, OH) at a sampling frequency of 2,048 Hz. Load-displacement curves were analyzed for whole bone stiffness, yield load, ultimate load, elastic energy, plastic energy, total energy to failure and post-yield displacement using custom computational code (MATLAB 7.11; Mathworks, Natick, MA).
Static Histology
The longitudinal sections of distal femur obtained after bisecting plastic embedded bones transversely were dehydrated and stained with Masson’s trichrome. Serial sections were stained with TRAP as outlined below. Brightfield images (20X) of the entire section were obtained using the scan large image function on a Nikon eclipse microscope. Regions of interest were created in ImageJ. Specifically, a box sized 1.5% of the total bone length (determined from nanoCt) was positioned immediately proximal to the growth plate and this region was cleared from the image in order to avoid primary spongiosa. A second box sized 5% of the total bone length was then positioned just proximal to the deleted region and this image was saved as the trabecular ROI. Black and white masks of trabecular bone were created in Photoshop and trabecular bone volume, trabecular surface and total tissue volume were determined in ImageJ as described (27). Osteoblast number and surface, as well as osteoid perimeter were determined using the cell counter and segmented line tools in ImageJ, respectively. Osteoclasts were visualized in TRAP stained sections (see methods below) and counted by hand in ImageJ.
TRAP staining
Slides were deplasticized in acetone, sequentially rehydrated (100% EtOH, 95% EtOH, ddH2O) and then incubated 1 hour at 37°C in 0.2 M Tris-HCI buffer, pH 9.0. TRAP staining solution was prepared according to the manufacturer’s instructions (Sigma Catalog #387A). Approximately 50 μl was pipetted directly onto each section and then incubated 4 hours in a 37°C humidified chamber. The slides were rinsed in dH2O and then coverslipped with water-based mounting medium (Vectashield Hardset Cat# H1400). Brightfield images were obtained after 24 hours to avoid fading of the TRAP stain.
Colony Forming Unit-Fibroblastic Assay
CFU-F analysis was performed as described previously (4,10) with minor modifications. The proximal epiphysis was removed from the tibiae of the same mice used for structural and functional analyses of femora. Marrow was obtained by centrifuging the bones and then suspended in culture medium. A single cell suspension was obtained using a 21-gauge needle and the cells were washed once with medium. Whole marrow was plated at 2x10⁶ cells per 60 mm dish in αMEM containing 10%FBS, 100 IU/ml penicillin, 100 g/ml streptomycin, 10 μM amphotericin B and 50 μM ascorbate 2-phosphate. One third of the medium was replaced after 4 days. After 9 days, colonies were stained using a commercially available alkaline phosphatase kit (Sigma, St. Louis, MO). Images of whole plates were obtained using a Biotek Lionheart scanning at 4X. Alkaline phosphatase positive and total colonies (stained with neutral red) were counted manually.
Statistics
All data are presented as scatter dot plots with mean and SD indicated. Each dot corresponds to data obtained from a single mouse (table S4). Phenotypic outcomes were compared using 2-way ANOVA with genotype and sex as the main factors. In cases with significant or close-to-significant interaction, Tukey post-hoc tests were conducted to address potential of DKO status in male DKO vs. WT and in female DKO vs. WT. Graph Pad Prism v8 was used for analysis.
Results
Our protein extraction protocol allows recovery of detergent soluble proteins. Thus soluble cellular components and newly secreted, soluble ECM proteins and growth factors will be captured, but multimeric protein aggregates in the cell membrane, cytoskeleton and the mature collagenous ECM remain insoluble (5,11). We used TMT proteomics to determine the abundance of detergent soluble proteins in WT and DKO bones. The cellular content of cortical bone is composed mostly of osteocytes, and 91% (3,583 of 3,924) of the proteins recovered here are also expressed by an osteocyte cell line during in vitro maturation (8). CTen enrichment analysis revealed substantial overlap with bone tissue and bone cell genes (Table 1). As previously described, (8,28) genes expressed by osteocyte enriched cortical bone and osteocytes overlap significantly with the transcriptome of skeletal muscle and CTen enrichment analysis confirmed this published observation (Table 1). In addition, proteins that are also expressed in brown adipose tissue and microglia were recovered (Table 1). Manual comparison to the Cten database suggested that proteins expressed in “bone” “osteoblast” and “osteoclast” were recovered at roughly equivalent percentages (Table 2). While we did not recover all bone proteins using RIPA buffer, our results do not appear to be biased towards unequal recovery of proteins expressed by one particular bone cell lineage.
Table 1. Overlap of detected proteins with cell-specific highly enriched genes from the Cten database.
The enrichment score is log10 of FDR corrected p values. Enrichment scores >2.0 are considered meaningful and all physiologically relevant tissue/cell types that met this criteria are shown.
| Enrichment Score | |
|---|---|
| Skeletal Muscle | 53.3 |
| Adipose Brown | 52.3 |
| Bone | 26.3 |
| Osteoblast Day 5 | 15.0 |
| Osteoblast Day 21 | 12.8 |
| Osteoblast Day 14 | 10.7 |
| Bone Marrow | 8.8 |
| Osteoclasts | 6.5 |
| Microglia | 5.6 |
| Macrophage Bone Marrow | 5.3 |
Table 2.
Bone specific coverage
| CTen category | CTen total | Proteomics total | Percent Coverage |
|---|---|---|---|
| Bone | 838 | 369 | 44.0% |
| Osteoblast day 5 | 800 | 362 | 45.2% |
| Osteoblast day 14 | 913 | 390 | 42.7% |
| Osteoblast day 21 | 926 | 395 | 42.7% |
| Osteoclast | 631 | 223 | 35.3% |
TSP1-TSP2 double knockout affects the overall protein profile of diaphyseal cortical bone
TSP1/TSP2 double knock out had both overlapping and unique effects on abundance of specific proteins in the detergent soluble fraction of cortical bone. The number of differentially abundant proteins depended on sex, as 344 protein were differentially abundant only in female bones and 202 proteins were different exclusively in male bones. In addition to these sex-specific differences, 193 proteins were differentially abundant in both male and female DKO bones (Figure 1). The differentially abundant proteins encompassed in the Venn Diagram are presented in Table S1. The 195 proteins in the intersection were subject to Ingenuity Pathway Analysis to detect potential biological consequences of DKO in both male and female bones. Pathway assessment revealed possible global effects on a number of signaling pathways (Table 3). Examination of annotation categories revealed that monocyte number was predicted to be elevated, while connective tissue and ECM degradation were predicted to be reduced (Table 4).
Table 3.
Canonical Pathways affected in both male and female DKO bones
| Pathway | P value | Z score |
|---|---|---|
| Leukocyte Extravasation Signaling | 3.3E-11 | −3.7 |
| EIF2 signaling | 2.27E-10 | 3.4 |
| Production of NO and ROS by macrophages | 1.17E-06 | −3.0 |
| Pentose Phosphate | 1.29E-06 | −2.8 |
| Integrin | 7.25E-04 | −2.8 |
| GP6 signaling | 1.27E-05 | −2.8 |
| p70S6K signaling | 6.34E-03 | −2.2 |
| Sirtuin signaling | 3.27E-04 | 2.3 |
Table 4.
Summary of physiologically relevant affected annotation categories
| Term | Z score | Overlap p value | Genes |
|---|---|---|---|
| Quantity of Monocytes | 2.18 | 9.66E-06 | ITGB3, PRTN3, FCGR2B, ITGAL, MMP9, ITGB2, LCN2, (LGALS3, Ly6a) |
| Degradation of Connective Tissue | −2.40 | 9.38E-05 | PRTN3, ELANE, SLP1, MMP13, FCGR2B, CTSG, CTSK |
| Degradation of ECM | −2.16 | 1.73E-06 | CTSH, MMP13, MMP8, MMP9, CTSK, TGFB1I1 |
Proteins that are expressed by both osteocytes and osteoclasts are differentially abundant in DKO bones
Proteomics allowed us to survey the total profile of detergent soluble proteins TSP-deficient cortical bone. In order to estimate whether particular cell types might be disproportionately affected by double TSP1-TSP2 knockout, we used the same gene expression data bases referred to above, (25) and (8). CTen analysis revealed that all of the osteoclast HECS (highly expressed cell specific) genes affected by DKO status had diminished protein levels (Table 5). With the exception of S100A9, all of these proteins are also listed in the published osteocyte RNAseq data set (8). Similar to the osteoclast HECS, the majority of affected osteocyte associated genes were diminished in DKO bone (tables S2 and S3). In order to connect changes in gene expression with possible effects on bone cell physiology, we examined the skeletal phenotype of 12-week old male and female DKO mice.
Table 5.
Differentially abundant osteoclast proteins identified using Cten.
| Symbol | Name | Female DKO | Male DKO |
|---|---|---|---|
| s100a8* | Protein S100-A8 | 0.13 | 0.18 |
| S100a9$ | Protein S100-A9 | 0.17 | 0.17 |
| CAMP | Cathelicidin antimicrobial peptide | 0.21 | 0.42 |
| Ltf | Lactotransferrin | 0.22 | 0.21 |
| Ctsk* | Cathepsin K | 0.24 | 0.39 |
| Ppbp# | Chemokine (C-X-C motif) ligand 7, isoform CRA_b | 0.24 | 0.52 |
| Itgam | Integrin αM | 0.26 | 0.39 |
| Ngp | Neutrophilic granule protein | 0.28 | 0.30 |
| Itgb2* | Integrin beta-2 | 0.28 | 0.39 |
| Rac2 | Ras-related C3 botulinum toxin substrate 2 | 0.28 | 0.38 |
| Acp5# | Tartrate-resistant acid phosphatase type 5 | 0.29 | 0.33 |
| Icn2 | Neutrophil gelatinase-associated lipocalin | 0.29 | 0.31 |
| msn | moesin | 0.29 | 0.53 |
| Sash3* | SAM and SH3 domain-containing protein 3 | 0.30 | 0.41 |
| Cybb | Cytochrome B 245-β-chain | 0.30 | 0.42 |
| Lyz2* | Lysozyme C-2 | 0.31 | 0.31 |
| Mmp8 | Neutrophil collagenase | 0.34 | 0.38 |
| Aldh3b1 | Aldehyde dehydrogenase family 3 member B1 | 0.34 | 0.51 |
| FCGR2B | Fc fragment of IgG receptor IIb | 0.34 | 0.45 |
| Ncf2* | Neutrophil cytosol factor 2 | 0.34 | 0.36 |
| MMP9 | Matrix Metalloproteinase 9 | 0.35 | 0.33 |
| Ncf1 | Neutrophil cytosol factor 1 | 0.35 | 0.38 |
| Emb | Embigen | 0.36 | 0.53 |
| Hk3 | Hexokinase-3 | 0.37 | 0.37 |
| Ptpn6# | Isoform 2 of Tyrosine-protein phosphatase non-receptor type 6 | 0.37 | 0.40 |
| lcp1# | Plastin-2 | 0.38 | 0.40 |
| Grn | Granulins | 0.39 | 0.50 |
| Fermt3 | Fermitin family homolog 3 | 0.41 | 0.53 |
| Fgr | Tyrosine-protein kinase Fgr | 0.42 | 0.40 |
| Cfp# | Properdin | 0.44 | 0.47 |
| Prtn3* | Myeloblastin | 0.46 | 0.50 |
| Lgals3* | Galectin-3-binding protein | 0.48 | 0.50 |
| Spn | Leukosialin | 0.50 | 0.42 |
| Tcirg1# | V-type proton ATPase subunit a | 0.51 | 0.49 |
| Tpd52* | Tumor protein D52 | 0.51 | 0.42 |
| Hcls1 | Hematopoietic lineage cell-specific protein | 0.54 | 0.44 |
All proteins in Table 5 are highly expressed cell specific (HECS) osteoclast genes in CTen and all except S100A9 ($) are also listed in a published RNAseq data set obtained from osteocytes undergoing in vitro maturation.
Denotes gene that increases during in vitro osteocyte maturation and is also listed in table Table S2.
Denotes gene that decreases during in vitro osteocyte maturation and is also listed in table S3.
Male DKO femora display a brittle bone phenotype
Two-way ANOVA indicated that sex and genotype both affected mouse size and femur size (Figure 2 ANOVA tables). Post-hoc analysis suggested that male, but not female DKO mice exhibited smaller body mass than their wild-type counterparts (Figure 2A). Female DKO mice exhibited lower nose to tail length compared to WT (Figure 2B). Male DKO femora were shorter than WT (Figure 2C). Total femoral cross-sectional area was decreased in male DKO mice (Figure 2D).
Figure 2. DKO mice display sex-specific reductions in body size and bone size.
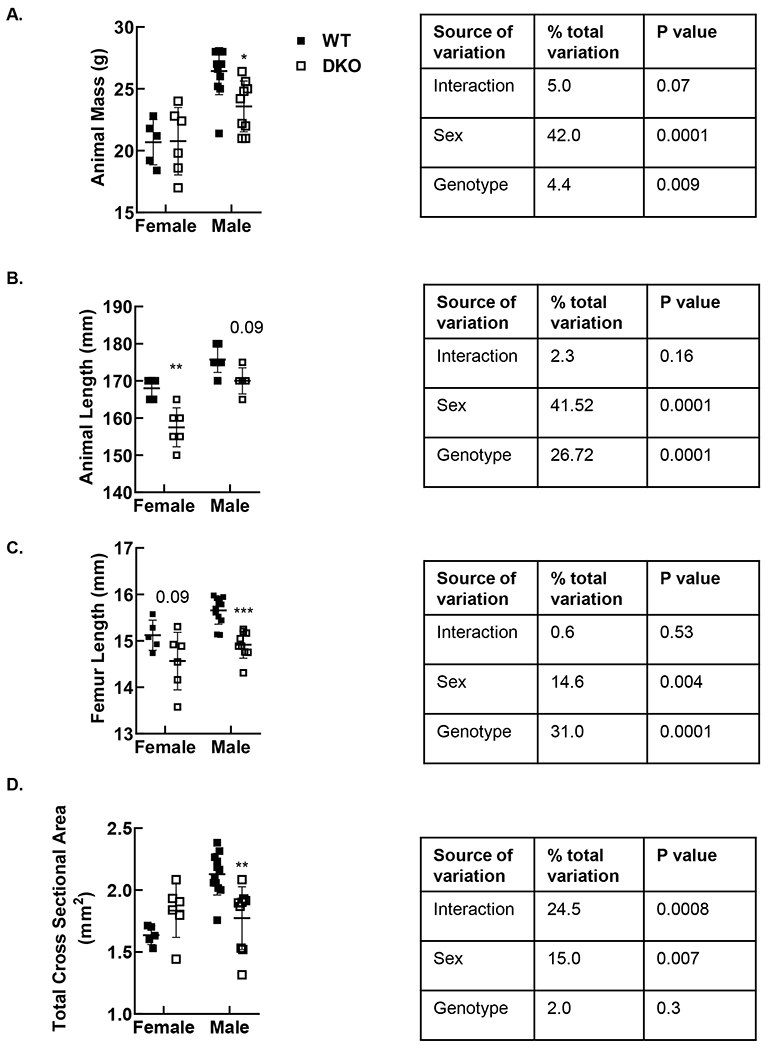
Animal mass was acquired at the time of sacrifice. Total femoral cross-sectional area was obtained on nanoCT. Male DKO mice displayed reduced mass (A), while reductions in length were significant in female mice (B). Femur length and total femoral cross-sectional area were reduced in male DKO mice. *p<0.05, **p<0.01, *** p<0.001 vs. WT of the same sex by Tukey post-test. Solid square denotes WT; open square denotes DKO.
Some male DKO bones exhibited a flattened shape in cross section (Figure 3A). We used circularity ((4π) (total cross-sectional area/outer perimeter2)) to quantify this alteration in shape. A circle has a circularity value of 1.0 while ellipsoid shapes have circularity <1.0 with values lessening with increasing difference between major and minor axes. Two-way ANOVA suggested that both genotype and sex affect circularity (Figure 3 ANOVA table). Tukey post-hoc tests revealed a significant effect of DKO on shape in the male cohort where circularity values were 0.90±0.03 and 0.81±0.09 for WT and DKO bones, respectively (p<0.01). Circularity was not affected by TSP status in the female cohort (94±0.01 and 90±0.04 in WT and DKO, respectively; p=0.7).
Figure 3. Male DKO femora display a flattened morphology with variable penetrance.

A.) Cross-sectional nanoCT images were obtained at the femoral mid-diaphysis just distal to the third trochanter. B.) Circularity was used to quantify shape. Cross-sectional nanoCT images from the whole cohort are shown in figure S1. ** p<0.01 vs WT of the same sex by Tukey post-hoc analysis. Solid square denotes WT; open square denotes DKO.
Two-way ANOVA revealed significant interaction terms for all measures of cross-sectional geometry and so Tukey post-hoc tests were used to address potential effects of DKO status in male and female bones. Reduced total cross-sectional area (figure 2D) was associated with reduced cortical bone area in male DKO femora (Figure 4A p<0.001 by Tukey post-hoc analysis). Marrow area was also reduced in DKO male femora (Figure 4B, p=0.01 by Tukey post-hoc analysis). Periosteal perimeter was not affected by TSP status (Figure 4C) and male DKO femora exhibited a trend towards reduced endosteal perimeter (Figure 4D, p=0.06 by post-hoc analysis) Consistent with their smaller size, male DKO bones were less stiff and displayed decreased ultimate load in 4-point bending, (Figure 5A and B both p<0.05 by Tukey post-hoc analysis). Female DKO bones exhibited stiffness and ultimate load values on par with WT female (Figure 5).
Figure 4. Male DKO bones display reduced cortical area.

Measures of cortical geometry were obtained by nanoCT. ** p<0.01; *** p<0.001 vs. WT of same sex on Tukey post-test. Solid square denotes WT; open square denotes DKO.
Figure 5. Male DKO bones display reduced stiffness and ultimate load in 4-point bending.

Stiffness (A) and ultimate load (B) were decreased in male, but not female, DKO as expected based on diminished polar moment of inertia in the male bones (C). * p<0.05, # p<0.0001 by Tukey post-hoc analysis. Solid square denotes WT; open square denotes DKO.
With the exception of failure displacement, two-way ANOVA suggested that genotype had a main effect on post-yield behavior. However, interaction terms trended towards or were significant for the same post-yield measures (Figure 6 ANOVA tables). Tukey post-hoc analysis suggested that differences in displacement were more evident in males. Displacement at maximum (p<0.001 by Tukey post-test) and yield loads (p<0.0001 by Tukey post-test) were elevated in male DKO bones (Figure 6A and B). Quantifying pre-and post-yield behavior as ratios can be helpful to reveal additional mechanical attributes independent of bone size. We calculated displacement ratio using two different methods. Displacement ratio 1 was defined as max displacement/yield displacement. Despite the elevations in max and yield displacements observed in male bones, when combined these changes lead to a lower displacement ratio 1 in the male bones (p<0.0001 by Tukey post-hoc analysis Figure 6C). Displacement ratio 2 was defined as post-yield displacement/yield displacement. Post-yield displacement was modestly diminished in DKO bones, but when divided by higher yield displacement values (figure 6B) displacement ration 2 also decreased (Figure S2). Together, these reductions in post-yield-to-pre-yield ratios suggest that male DKO bones are more brittle than WT. Increased mineral content could lead to reduced post-yield behavior and contribute to a brittle phenotype. However, cortical tissue mineral density (TMD) was not affected in DKO bones S3.
Figure 6. DKO bones exhibit post-yield behavior consistent with a brittle bone phenotype.

Increased pre and post yield displacement magnitudes resulted in a decreased displacement ratio in male mice. * p<0.05, *** p<0.001, #p<0.0001 vs. WT of same sex by Tukey post-analysis Solid square denotes WT; open square denotes DKO.
Male DKO distal femur displays reduced trabecular bone mass with paradoxically increased osteoblast surface.
Similar to measures of cortical geometry, interaction terms were significant for nanoCT and histological analyses of trabecular bone mass (ANOVA tables, Figure 7 and 8A, B). On nanoCT, male DKO mice displayed reduced trabecular bone mass, which was associated with reductions in trabecular volume fraction (p<0.001 by Tukey post-hoc) and thickness (p<0.0001 by Tukey post-hoc), (Figure 7B and C). Static histology revealed that DKO bones had normal architecture and cellular attributes (Figure 8A). Analysis of trabecular bone masks in ImageJ revealed reductions in bone mass (p<0.001 by Tukey post-test) and perimeter (p<0.001 by Tukey post-test) in male DKO bones (Figure 8B and C), consistent with the nanoCt data shown in Figure 7. Osteoblast numbers were not affected by DKO status (Figure 8D), although there were significantly more osteoblasts in male compared to female bones, regardless of genotype (p=0.0001 Figure 8C ANOVA table) (Figure 8D). Diminished trabecular surface coupled with equivalent osteoblast numbers lead to an increase in osteoblast surface for male DKO (p<0.05 by Tukey post hoc). While there was a trend towards reduced osteoclast numbers in male DKO bones (p<0.06 by Tukey post-hoc), osteoclast surface was not affected by DKO status (Figure 9). Two-way ANOVA revealed a main effect of DKO status on Total CFU-F (p<0.05, Figure 10A ANOVA table). The proportion of alkaline phosphatase positive colonies was not affected by DKO (Figure 10B).
Figure 7.

Reduced trabecular bone volume at the distal femur in male DKO bones is associated with reductions in trabecular size. The nanoCT images shown in A had the median BV/TV values for each genotype. *** p<0.001, #p<0.0001 vs. WT of same sex by Tukey post-analysis. Solid square denotes WT; open square denotes DKO.
Figure 8. Male DKO bones exhibit increased osteoblast surface because of reductions in trabecular perimeter.

Static histology revealed normal tissue and cellular architecture in DKO trabecular bone (A). Trabecular mass and surface were reduced in DKO (B, C), but osteoblast number were not affected (D), leading to increases in osteoblast surfaces (F,). * p<0.05, ** p<0.01 by Students t test Tukey post-hoc analysis. Scale bars are 50 microns. Solid square denotes WT; open square denotes DKO.
Figure 9. Osteoclast surface is not affected in DKO trabecular bone.

Despite reduced expression of TRAP and catK, osteoclast numbers (A) and surface (B) were not affected in DKO mice (A), Exemplary TRAP positive images are shown in C. The scale bars are 50 microns. Solid square denotes WT; open square denotes DKO.
Figure 10. DKO mice have a diminished marrow-derived MSC pool, but the proportion of osteoblast progenitors is not affected.

A.) Total colonies, defined as a group of 30 or more cells, were visualized using neutral red. B.) ALP+ colonies were identified by purple staining. Solid square denotes WT; open square denotes DKO.
Discussion
TSP1 and TSP2 are highly homologous, produced by osteoblasts, and might be expected to play redundant roles in the bone extracellular matrix. Indeed, both thrombospondins are anti-angiogenic and they affect collagen fibrillogenesis in soft tissues (29,30). Accordingly, both TSP1−/− and TSP2−/− bones exhibit reductions in collagen matrix maturation (22) and TSP2−/− endosteal cortical bone displays altered collagen fibril morphology (5). TSP1 and TSP2 have also been implicated in regulation of lysyl oxidase (11,30). On the other hand, the phenotypes of bone cells from TSP1−/− and TSP2−/− mice are distinct. An intriguing question is how TSP1 and TPS2 might work in concert, or how one protein may compensate for the other. In particular, TSP1 and TSP2 seem to have overlapping effects on collagen, an ECM protein known to drive osteoblast differentiation. On the other hand, the unique phenotypes of TSP1 and TSP2 deficient MSC suggest distinct functions of the two matricellular proteins. Here we completed a thorough phenotyping of bones from DKO mice relative to WT, which included a comprehensive analysis of the detergent soluble proteins present in WT and TSP-deficient bones. Our proteomics approach allowed us to address cellular-level changes resulting from removal of ECM proteins from the tissue milieu.
Diaphyseal cortical bone is enriched with osteocytes and osteoblasts, and it also contains a variety of other cell types including osteoclasts, endothelial cells, nerve cells and immune cells. To understand how DKO might affect bone cells specifically, we compared our differentially abundant proteins to osteoblast and osteoclast HECS (highly expressed cell specific genes) in the Cten database (25). We also compared our data to an RNAseq data set obtained during in vitro osteocyte maturation (8). Our protein extraction protocol did not allow complete recovery of all proteins present in bone. Thus, it was important to address the possibility of biased protein recovery using mRNA-based data sets with more complete coverage. These comparisons revealed a number of proteins expressed by both osteoclasts and osteocytes that were reduced in DKO (Table 5). As well, the majority of differentially abundant osteocyte genes presented in supplemental Tables 2 and 3 were also reduced. As such, conclusions concerning effects of DKO on osteoclast vs. osteocyte number or physiology were difficult to draw from the proteomics data alone. Thus, we undertook a more comprehensive phenotypic analysis of DKO bone.
Although marrow-derived mesenchymal stem cells were reduced in both male and female DKO mice, our phenotypic analyses suggest that the effects of TSP1 and TSP2 double deficiency are more pronounced in the male skeleton. In male mice, DKO out was associated with changes in cortical bone geometry and trabecular bone mass, as well as unexpected mechanical behavior indicative of increased brittleness. In the trabecular compartment of male mice, DKO was associated with substantial reductions in bone volume that were paradoxically associated with increased osteoblast surface. Osteoclast parameters were not affected by DKO status, thus underscoring the importance of coupling protein abundance data with phenotypic analysis. Male DKO bones also exhibited unexpected mechanical behavior indicative of increased brittleness. As detailed below, these outcomes are not reflective of the skeletal phenotypes of single TSP1 or TSP2 null mice.
No effects of TSP1 or TSP2 deficiency on body size have been reported, although TSP2−/− mice have greater adiposity (7). Differences in body mass were also not previously reported for the TSP1/TSP2 DKO mouse (129SvJ/FVB background) (18). In our study, male DKO mice and bones were smaller than WT. Female DKO mice were shorter than WT, but weights were equivalent.
C57Bl/6J TSP1−/− mice display increases in cortical area and thickness, as well as trabecular bone volume (9). As expected with increased cross-sectional area, TSP1−/− femora display increased bending strength (9). However, TSP1−/− bones are less stiff in bending compared to WT (9). Decreased stiffness was one of the TSP1−/− characteristics reflected in the male DKO bones, but deficits in matrix quality rather than decreased bone size appear to underlie diminished stiffness in TSP1−/− bone (9). (9). Amend et al went on to show that TSP1 in the bone matrix regulates nitric oxide production and signaling by osteoclasts. TSP1−/− MSC displayed normal in vitro osteoblast differentiation capacity (9).
In contrast to male DKO, stiffness is not affected in bones of male or female C57BL/6J TSP2−/− mice (5,10). TSP2−/− mice exhibit increased cortical thickness associated with increased endosteal bone formation rather than periosteal expansion as seen with TSP1 deficiency (9). TSP2−/− mice also display a unique endosteal response to mechanical loading with very little periosteal bone formation (32). In TSP2−/− mice, increased endosteal bone formation is associated with increases in both CFU-F and in vitro MSC proliferative capacity (10). The effects of DKO on periosteal and endosteal bone formation remains to be determined. In contrast to TSP2−/− (10), CFU-F were reduced in DKO marrow-derived MSC cultures.
Similar to the results presented here on femora of 12-week old male DKO mice, we previously reported that femora of 6-week old TSP2−/− mice display post-yield behavior suggestive of a brittle phenotype (5). We applied the same calculations utilized here to this published data set in order to facilitate a direct comparison. Femora from 6-week old male TSP2−/− mice did not display any of the displacement behaviors documented for bones of 12-week old male DKO mice in the current paper. Also in contrast to DKO bones, TSP2−/− bones displayed increased yield displacement, normal max displacement and a trend towards decreased failure displacement (5). TMD was not affected in DKO or single null (5,9,10) bones. Instead, deficits in collagen fibrillogenesis and matrix maturation have been documented in TSP1−/−, TSP2−/− and DKO bone (5,11) and could contribute to a brittle phenotype. Thus, as yet unidentified differences in collagen fibrillogenesis or morphology might be responsible for post-yield behavior of DKO bones. Together, our results suggest that TSP2-deficiency does not fully account for the post-yield behavior of DKO bones from male mice.
Deletion of TSP1, TSP2 and DKO on the C57BL/J background resulted in three unique trabecular phenotypes. TSP1−/− mice have increased trabecular bone mass (9). TSP2−/− mice display WT equivalent trabecular bone parameters at both the vertebrae and the distal femur (5,10). Male DKO distal femora displayed a substantial reduction in trabecular bone volume, with correspondingly decreased trabecular thickness. To our surprise this phenotype was associated with increases in osteoblast surface but diminished CFU-F. These data are consistent with the possibility of depletion of marrow-derived progenitor cells via increased MSC proliferation or osteoblast lineage progression in the DKO. Our proteomic data were collected at 6 weeks of age and the skeletal phenotyping was conducted at 12 weeks of age. As such we cannot rule out possible age-related effects of DKO on MSC dynamics over the intervening 6-week period. This hypothesis remains to be tested directly.
With variable penetrance, male DKO femora displayed a flattened morphology not documented in the TSP1 or TSP2 null mice. The possibility that normal mechanical forces associated with growth and development, combined with an altered pattern of bone formation, underlies this interesting shape change is an open question. Indeed, as noted above when subject to mechanical loading, TSP2 null mice show enhanced bone formation at the endosteal surface rather than the periosteum as seen in WT mice (33)
Our study has several limitations. We referred to historical single knock-out controls for comparison. While not ideal, given the extensive documentation of single knock-outs in the past, we believe our results are sound. Our proteomics analysis is preliminary and validation of differential protein levels via rtPCR and Western blot of male and female bones remains to be completed. Reductions in integrin signaling suggested by pathway analysis could reflect altered osteoblast and osteocyte interactions with the bone matrix and matrix remodeling, which could affect bone material properties and osteoblast differentiation. These hypotheses remain to be tested. Cortical bone lysates from multiple mice were combined to achieve adequate protein yield, thereby reducing the final number of biological replicates. To address this reduction in sample number we focused our proteomics analysis on proteins that were significantly affected in both male and female DKO bones. Our skeletal phenotyping data suggest that TSP1 and TSP2 double-deficiency has greater effects on the male compared to the female skeleton, and so validation of the sex-specific effects on protein profiles is an important undertaking. Our histological analysis suggested DKO status affects osteoblast surface in male, but not female, mice. Accordingly, SOST was reduced in male but not female DKO bones (table S1), suggesting that the increased osteoblast surface observed in male mice may be associated with altered wnt signaling. However, we also observed that the majority of differentially abundant osteocyte proteins were diminished in both male and female DKO bones (Table S3) and so we cannot rule out differences in osteocyte function in both male and female mice. For example, Ctsk, MMP13, TRAP and ATP6v0d2, proteins implicated in perilacunar remodeling (33,34), were all diminished in both male and female DKO bones. Thus, osteocyte-induced remodeling of the pericellular ECM may be impaired in DKO bones. Along these same lines, IPA revealed possible reductions in the annotation categories “degradation of connective tissue” and “degradation of ECM.” Altered matrix turnover could also contribute to altered post-yield behavior and lead to increased brittleness. Future studies will include histological analyses of osteocyte number, lacunar size and density, as well as canalicular density. As well, more complete assessments of osteoclast and osteoblast lineage progression and function in DKO are warranted. Finally, spectroscopic analysis of DKO ECM might reveal possible effects of DKO on bone quality.
Taken together, our data suggest that when TSP1 and TSP2 are both absent from the male skeleton, osteoblast physiology is altered resulting in reduced cortical bone size, altered cortical bone shape, and reduced trabecular bone mass. In addition, a unique brittle bone phenotype that is not predicted by individual null mutations in either TSP1 or TSP2 is manifested.
Supplementary Material
Table 6.
Summary of TSP1−/−, TSP2−/− and DKO skeletal phenotypes. All studies utilized C57BL6/J mice.
| TSP1 | TSP2 (5, 10) | DKO | |
|---|---|---|---|
| Mouse Details | 8,12, 16, 32 wk male+female | 6 wk male+female; 16 wk female; 26 wk male | 12 wk male and female |
| Femoral Geometry | ↑CSA | =CSA | ↓CSA in male only |
| Trabecular Mass | ↑BV/TV | =BV/TV | ↓BV/TV in male only |
| Sex differences | no | no | yes |
Acknowledgments
We thank Anita B. Reddy, Anne Ryan, Parker Acevedo and Karen Kessel for expert technical assistance.
Michigan Integrative Musculoskeletal Health Core Center NIH P30 AR069620.
Literature Cited
- 1.Bornstein P, O’Rourke K, Wikstrom K, Wolf FW, Katz R, Li P, and Dixit VM (1991) A second, expressed thrombospondin gene (Thbs2) exists in the mouse genome. The Journal of biological chemistry 266, 12821–12824 [PubMed] [Google Scholar]
- 2.Laherty CD, O’Rourke K, Wolf FW, Katz R, Seldin MF, and Dixit VM (1992) Characterization of mouse thrombospondin 2 sequence and expression during cell growth and development. The Journal of biological chemistry 267, 3274–3281 [PubMed] [Google Scholar]
- 3.Iruela-Arispe ML, Liska DJ, Sage EH, and Bornstein P (1993) Differential expression of thrombospondin 1, 2, and 3 during murine development. Developmental dynamics: an official publication of the American Association of Anatomists 197, 40–56 [DOI] [PubMed] [Google Scholar]
- 4.Alford AI, Reddy AB, Goldstein SA, Murthy P, Tayim R, and Sharma G (2012) Two molecular weight species of thrombospondin-2 are present in bone and differentially modulated in fractured and nonfractured tibiae in a murine model of bone healing. Calcified tissue international 90, 420–428 [DOI] [PMC free article] [PubMed] [Google Scholar]
- 5.Manley E Jr., Perosky JE, Khoury BM, Reddy AB, Kozloff KM, and Alford AI (2015) Thrombospondin-2 deficiency in growing mice alters bone collagen ultrastructure and leads to a brittle bone phenotype. Journal of applied physiology 119, 872–881 [DOI] [PMC free article] [PubMed] [Google Scholar]
- 6.Robey PG, Young MF, Fisher LW, and McClain TD (1989) Thrombospondin is an osteoblast-derived component of mineralized extracellular matrix. The Journal of cell biology 108, 719–727 [DOI] [PMC free article] [PubMed] [Google Scholar]
- 7.Shitaye HS, Terkhorn SP, Combs JA, and Hankenson KD (2010) Thrombospondin-2 is an endogenous adipocyte inhibitor. Matrix biology: journal of the International Society for Matrix Biology 29, 549–556 [DOI] [PMC free article] [PubMed] [Google Scholar]
- 8.St John HC, Bishop KA, Meyer MB, Benkusky NA, Leng N, Kendziorski C, Bonewald LF, and Pike JW (2014) The osteoblast to osteocyte transition: epigenetic changes and response to the vitamin D3 hormone. Molecular endocrinology 28, 1150–1165 [DOI] [PMC free article] [PubMed] [Google Scholar]
- 9.Amend SR, Uluckan O, Hurchla M, Leib D, Novack DV, Silva M, Frazier W, and Weilbaecher KN (2015) Thrombospondin-1 regulates bone homeostasis through effects on bone matrix integrity and nitric oxide signaling in osteoclasts. Journal of bone and mineral research : the official journal of the American Society for Bone and Mineral Research 30, 106–115 [DOI] [PMC free article] [PubMed] [Google Scholar]
- 10.Hankenson KD, Bain SD, Kyriakides TR, Smith EA, Goldstein SA, and Bornstein P (2000) Increased marrow-derived osteoprogenitor cells and endosteal bone formation in mice lacking thrombospondin 2. Journal of bone and mineral research : the official journal of the American Society for Bone and Mineral Research 15, 851–862 [DOI] [PubMed] [Google Scholar]
- 11.Shearer D, Mervis MO, Manley E Jr., Reddy AB, and Alford AI (2019) TSP1 and TSP2 deficiencies affect LOX protein distribution in the femoral diaphysis and propeptide removal in marrow-derived mesenchymal stem cells in vitro. Connective tissue research 60, 495–506 [DOI] [PubMed] [Google Scholar]
- 12.Alford AI, Golicz AZ, Cathey AL, and Reddy AB (2013) Thrombospondin-2 facilitates assembly of a type-I collagen-rich matrix in marrow stromal cells undergoing osteoblastic differentiation. Connective tissue research 54, 275–282 [DOI] [PMC free article] [PubMed] [Google Scholar]
- 13.Lawler PR, and Lawler J (2012) Molecular basis for the regulation of angiogenesis by thrombospondin-1 and -2. Cold Spring Harbor perspectives in medicine 2, a006627. [DOI] [PMC free article] [PubMed] [Google Scholar]
- 14.Alford AI, Terkhorn SP, Reddy AB, and Hankenson KD (2010) Thrombospondin-2 regulates matrix mineralization in MC3T3-E1 pre-osteoblasts. Bone 46, 464–471 [DOI] [PMC free article] [PubMed] [Google Scholar]
- 15.Bailey Dubose K, Zayzafoon M, and Murphy-Ullrich JE (2012) Thrombospondin-1 inhibits osteogenic differentiation of human mesenchymal stem cells through latent TGFbeta activation. Biochemical and biophysical research communications 422, 488–493 [DOI] [PMC free article] [PubMed] [Google Scholar]
- 16.Ueno A, Miwa Y, Miyoshi K, Horiguchi T, Inoue H, Ruspita I, Abe K, Yamashita K, Hayashi E, and Noma T (2006) Constitutive expression of thrombospondin 1 in MC3T3-E1 osteoblastic cells inhibits mineralization. Journal of cellular physiology 209, 322–332 [DOI] [PubMed] [Google Scholar]
- 17.Hankenson KD, James IE, Apone S, Stroup GB, Blake SM, Liang X, Lark MW, and Bornstein P (2005) Increased osteoblastogenesis and decreased bone resorption protect against ovariectomy-induced bone loss in thrombospondin-2-null mice. Matrix biology: journal of the International Society for Matrix Biology 24, 362–370 [DOI] [PubMed] [Google Scholar]
- 18.Agah A, Kyriakides TR, Lawler J, and Bornstein P (2002) The lack of thrombospondin-1 (TSP1) dictates the course of wound healing in double-TSP1/TSP2-null mice. The American journal of pathology 161, 831–839 [DOI] [PMC free article] [PubMed] [Google Scholar]
- 19.Christopherson KS, Ullian EM, Stokes CC, Mullowney CE, Hell JW, Agah A, Lawler J, Mosher DF, Bornstein P, and Barres BA (2005) Thrombospondins are astrocyte-secreted proteins that promote CNS synaptogenesis. Cell 120, 421–433 [DOI] [PubMed] [Google Scholar]
- 20.Cursiefen C, Masli S, Ng TF, Dana MR, Bornstein P, Lawler J, and Streilein JW (2004) Roles of thrombospondin-1 and -2 in regulating corneal and iris angiogenesis. Investigative ophthalmology & visual science 45, 1117–1124 [DOI] [PubMed] [Google Scholar]
- 21.Liauw J, Hoang S, Choi M, Eroglu C, Choi M, Sun GH, Percy M, Wildman-Tobriner B, Bliss T, Guzman RG, Barres BA, and Steinberg GK (2008) Thrombospondins 1 and 2 are necessary for synaptic plasticity and functional recovery after stroke. Journal of cerebral blood flow and metabolism : official journal of the International Society of Cerebral Blood Flow and Metabolism 28, 1722–1732 [DOI] [PubMed] [Google Scholar]
- 22.Crawford SE, Stellmach V, Murphy-Ullrich JE, Ribeiro SM, Lawler J, Hynes RO, Boivin GP, and Bouck N (1998) Thrombospondin-1 is a major activator of TGFbeta1 in vivo. Cell 93, 1159–1170 [DOI] [PubMed] [Google Scholar]
- 23.Kyriakides TR, Zhu YH, Yang Z, and Bornstein P (1998) The distribution of the matricellular protein thrombospondin 2 in tissues of embryonic and adult mice. The journal of histochemistry and cytochemistry: official journal of the Histochemistry Society 46, 1007–1015 [DOI] [PubMed] [Google Scholar]
- 24.Käll L, Canterbury J, Weston J, Noble WS, MacCoss MJ (2007) Semi-supervised learning for peptide identification from shotgun proteomics datasets. Nat Methods 4, 923–925 [DOI] [PubMed] [Google Scholar]
- 25.Shoemaker JE, Lopes TJ, Ghosh S, Matsuoka Y, Kawaoka Y, and Kitano H (2012) CTen: a web-based platform for identifying enriched cell types from heterogeneous microarray data. BMC genomics 13, 460. [DOI] [PMC free article] [PubMed] [Google Scholar]
- 26.Khoury BM, Bigelow EM, Smith LM, Schlecht SH, Scheller EL, Andarawis-Puri N, and Jepsen KJ (2015) The use of nano-computed tomography to enhance musculoskeletal research. Connective tissue research 56, 106–119 [DOI] [PMC free article] [PubMed] [Google Scholar]
- 27.Egan KP, Brennan TA, and Pignolo RJ (2012) Bone histomorphometry using free and commonly available software. Histopathology 61, 1168–1173 [DOI] [PMC free article] [PubMed] [Google Scholar]
- 28.Schlecht SH, Smith LM, Ramcharan MA, Bigelow EM, Nolan BT, Mathis NJ, Cathey A, Manley E Jr., Menon R, McEachin RC, Nadeau JH, and Jepsen KJ (2017) Canalization Leads to Similar Whole Bone Mechanical Function at Maturity in Two Inbred Strains of Mice. Journal of bone and mineral research : the official journal of the American Society for Bone and Mineral Research 32, 1002–1013 [DOI] [PMC free article] [PubMed] [Google Scholar]
- 29.Kyriakides TR, Zhu YH, Smith LT, Bain SD, Yang Z, Lin MT, Danielson KG, Iozzo RV, LaMarca M, McKinney CE, Ginns EI, and Bornstein P (1998) Mice that lack thrombospondin 2 display connective tissue abnormalities that are associated with disordered collagen fibrillogenesis, an increased vascular density, and a bleeding diathesis. The Journal of cell biology 140, 419–430 [DOI] [PMC free article] [PubMed] [Google Scholar]
- 30.Bornstein P, Agah A, and Kyriakides TR (2004) The role of thrombospondins 1 and 2 in the regulation of cell-matrix interactions, collagen fibril formation, and the response to injury. The international journal of biochemistry & cell biology 36, 1115–1125 [DOI] [PubMed] [Google Scholar]
- 31.Rosini S, Pugh N, Bonna AM, Hulmes DJS, Farndale RW, and Adams JC (2018) Thrombospondin-1 promotes matrix homeostasis by interacting with collagen and lysyl oxidase precursors and collagen cross-linking sites. Science signaling 11 [DOI] [PubMed] [Google Scholar]
- 32.Hankenson KD, Ausk BJ, Bain SD, Bornstein P, Gross TS, and Srinivasan S (2006) Mice lacking thrombospondin 2 show an atypical pattern of endocortical and periosteal bone formation in response to mechanical loading. Bone 38, 310–316 [DOI] [PubMed] [Google Scholar]
- 33.Dole NS, Mazur CM, Acevedo C, Lopez JP, Monteiro DA, Fowler TW, Gludovatz B, Walsh F, Regan JN, Messina S, Evans DS, Lang TF, Zhang B, Ritchie RO, Mohammad KS, and Alliston T (2017) Osteocyte-Intrinsic TGFbeta Signaling Regulates Bone Quality through Perilacunar/Canalicular Remodeling. Cell reports 21, 2585–2596 [DOI] [PMC free article] [PubMed] [Google Scholar]
- 34.Dole NS, Yee CS, Mazur CM, Acevedo C, and Alliston T (2020) TGFbeta Regulation of Perilacunar/Canalicular Remodeling Is Sexually Dimorphic. Journal of bone and mineral research : the official journal of the American Society for Bone and Mineral Research [DOI] [PMC free article] [PubMed] [Google Scholar]
Associated Data
This section collects any data citations, data availability statements, or supplementary materials included in this article.