

Abstract
Purpose:
To describe the relationship between the number of Federal Drug Administration (FDA)-approved manufacturers and the price change of generic and branded topical eye drops.
Methods:
Retrospective analysis of topical eye drop medications with formulations listed in the Federal Drug Administration’s (FDA) Orange Book and the National Average Drug Acquisition Cost database from 2013 to 2017.
Results:
The most frequently prescribed generic topical drugs were glaucoma medications (34%), antimicrobials (32%), anti-inflammatories (24%), mydriatics (5%), and anesthetics (5%). The most frequently prescribed branded topical drugs were anti-inflammatories (45%), glaucoma medications (32%), antimicrobials (21%) and dry eye medications (3%). From 2013 to 2017, generic eye drops had a median price decrease of 20% (IQR 32%) while branded eye drops had a median price increase of 44% (IQR 28%) (P<.001). A significant inverse association was identified between the price change of generic eye drops and the total number of all manufacturers (r=−.41, P=.010), generic drug manufacturers (r=−.32, P=.0496), and alternative branded drug manufacturers (r=−.57, P=.002). There was no significant association between the price change of branded eye drops and number of manufacturers. Glaucoma (r=−.58, P=.039) and anti-inflammatory (r=−.69, P=.047) eye drops also had significant inverse associations with the number of generic manufacturers.
Conclusion:
From 2013 to 2017, the price of generic eye drops decreased whereas the price of branded eye drops increased. Market competition was significantly inversely associated with price changes of generic eye drops but not branded eye drops.
Keywords: Pharmaceutical, pharmacoeconomics, drug price, eye drops, market competition
INTRODUCTION
Prescription drug spending in the United States exceeds that in all other countries, largely as a result of brand-name drug prices increasing at rates faster than the consumer price index.1 Ophthalmologists had the highest proportion of brand-name drug Medicare claims in 2013 compared to all other specialties,2 and national expenditures for prescription ophthalmic medications nearly doubled between 2007 to 2016.3 In this time period, the average price per prescription increased while the number of prescriptions per individual remained stable. This suggests that a rise in ophthalmic drug prices and greater proportion use of expensive brand-name medications contributed more to the growing expenditures than did greater utilization.3 The high cost of ophthalmic prescription drugs warrants exploration of contributing factors to both generic and branded drug prices.
Drug manufacturers in the United States are able to set their own price for a given product.4 As a result, drug prices are significantly higher when pharmaceutical companies have market exclusivity.5 Previous studies have reported that greater market competition amongst generic drug manufacturers results in lower prices. For example, nearly half of general oral antibiotics with 2 or fewer manufacturers increased in price by at least 90% from 2013 to 2016, but only 7% of general antibiotics with 3 or more manufacturers experienced a similar price increase.6 In dermatology, an inverse relationship was found between the number of generic manufacturers and change in generic dermatologic drug price over time.7 In contrast, competition between 2 or more brand-name manufacturers selling drugs in the same class has not consistently resulted in significant price reductions.8 For example, despite a similar performance profile between 2 patented cholesterol-lowering statins (rosuvastatin (Crestor) and pitavastatin (Livalo)), the price of rosuvastatin increased by 91% between 2007 and 2012.9, 10 In the same time period, atorvastatin, an alternative that was patented until 2011, decreased in price by nearly 80%.11 Due to these ambiguous findings and others described in literature, the connection between market competition and brand-name medications remains unclear.
Although the relationship between market competition and drug pricing has been explored in other specialties, this association has not been defined for ocular medications. If brand-name ophthalmic drugs were substituted by generic and therapeutic equivalents, $882 million in total savings would be generated.2 Furthermore, because ophthalmologists are more likely to prescribe branded drugs,2 it is critical to understand market influences for branded drug prices and the differences between the branded and generic drug markets. In the current study, a national drug pricing benchmark database is used to study the association between price changes over 5 years and the number of distinct FDA-approved manufacturers for the most commonly prescribed generic and branded eye drops.
METHODS
The research adhered to the tenets of the Declaration of Helsinki and Institutional Review Board approval was waived as no patient information was accessed. The Medicare Provider Utilization and Payment Data: Part D Prescriber Public Use File (PUF) for 2017 was used to compile a list of drug names with more than 10 annual claims that had been prescribed by ophthalmologists, defined by the provider type ‘Ophthalmology’, for Medicare beneficiaries. To protect the privacy of Medicare beneficiaries, drug encounters associated with 10 or fewer claims were not reported in Part D Prescriber PUFs.
Using the FDA Orange Book online database, the numbers of FDA-approved manufacturers for generic and branded formulations were identified. Medications that were discontinued, not categorized as eye drops, not found in the Orange Book database or had a non-ophthalmic route of administration were excluded from analysis. Finally, the included drugs (Supplementary Tables 3 and 4) were categorized according to their purpose: glaucoma medications, antimicrobials, anti-inflammatories, mydriatics, and topical anesthetics. The number of manufacturers were also grouped by number: 1-2, 3-4, 5-6, and 6+ manufacturers.
The National Average Drug Acquisition Cost (NADAC) database was used to identify the price per unit for each drug included in the study, using the latest available pricing date in each year. Each year’s price was inflation-adjusted to December 2017. Drug formulations missing any NADAC information or price information between 2013 to 2017 were excluded from price change measurements. This database is the pricing benchmark used by the Centers for Medicare and Medicaid Services and provides the acquisition costs for medications supplied by retail pharmacies without accounting for rebates.
Statistical analysis was performed using Matlab R 2020a (Math Works, MA, USA) software. Data was analyzed according to their descriptive characteristics. The median and interquartile range (IQR) of price changes were recorded. Spearman rank correlation coefficients were calculated for the change in branded and generic drug prices from 2013 to 2017 and the number of manufacturers for total, generic, and branded formulations.
RESULTS
We identified 522 ophthalmologist-prescribed drugs with more than 10 claims within the Part D Prescriber PUF in 2017. Of these medications, we excluded 442 drugs that according to the Orange Book database were not categorized as eye drops, were discontinued, or were not found in the Orange Book database. The remaining 80 unique drugs were then searched through the NADAC database for their generic and brand-name formulations.
Variation in Generic Formulation Drug Prices and Number of Manufacturers
Of the 80 drugs found in the Orange Book database, 37 were excluded for not being found in the NADAC database or for not having a generic formulation. There were 9 drugs that were excluded for not having a price in each year between 2013-2017. The remaining 34 drugs corresponded to 38 unique generic eye drop formulations, which were included in the generic drug price analysis (Supplementary Table 3). Based on claims, the most highly prescribed generic drugs were glaucoma medications (34%), antimicrobials (32%), anti-inflammatories (24%), mydriatics (5%), and topical anesthetics (5%) (Table 1A).
Table 1:
Classification of Highest-Use Medicare Part D Eye Drops
| A. Generic Drugs, No. (%) | B. Branded Drugs, No. (%) | |||||||
|---|---|---|---|---|---|---|---|---|
| Drug Category | Unique Drugs (n=38) | Total Manufacturers (n=153) | Baseline Unit Price 2013, Median (IQR), $ | Median Price Change (IQR) | Unique Drugs (n=38) | Total Manufacturers (n=141) | Baseline Unit Price 2013, Median (IQR), $ | Median Price Change (IQR) |
| Anti-Inflammatory | 9 (24) | 36 (24) | 2.63 (6.78) | −10.3% (28.8%) | 17 (45) | 29 (21) | 29.62 (24.83) | 37.4% (15.9%) |
| Antimicrobial | 12 (32) | 54 (35) | 4.02 (11.92) | −23.2% (32.8%) | 8 (21) | 36 (26) | 28.71 (12.6) | 43.6% (37.8%) |
| Mydriatic | 2 (5) | 5 (3) | 1.82 (1.54) | 144.4% (420.2%) | 0 | 0 | N/A | N/A |
| Glaucoma | 13 (34) | 53 (35) | 3.39 (4.14) | −27% (38.6%) | 12 (32) | 75 (53) | 16.15 (34.18) | 52.1% (25%) |
| Topical Anesthetic | 2 (5) | 5 (3) | 0.61 (0) | 108.4% (233.3%) | 0 | 0 | N/A | N/A |
| Dry Eye | 0 | 0 | N/A | N/A | 1 (3) | 1 (1) | 5.08 (0) | 46.5% (0%) |
The total number of distinct FDA-approved manufacturers was significantly inversely associated with the change in price of the generic formulation (r=−.41, P=.010) (Figure 1). This correlation remained significant when considering only the number of generic manufacturers (r=−.32, P=.0496), as well as when considering only the number of alternative brand drug manufacturers (r=−.57, P=.002). From 2013 to 2017, those with 1 to 2 total manufacturers experienced a median price increase of 4.1% (IQR 8.9%), whereas those with 3 to 4 manufacturers, 5 to 6 manufactures, and greater than 6 manufacturers sustained a median price reduction of 9.3% (IQR 49%), 27% (IQR 7.5%), and 41% (IQR 36%), respectively (Table 2A).
Figure 1:
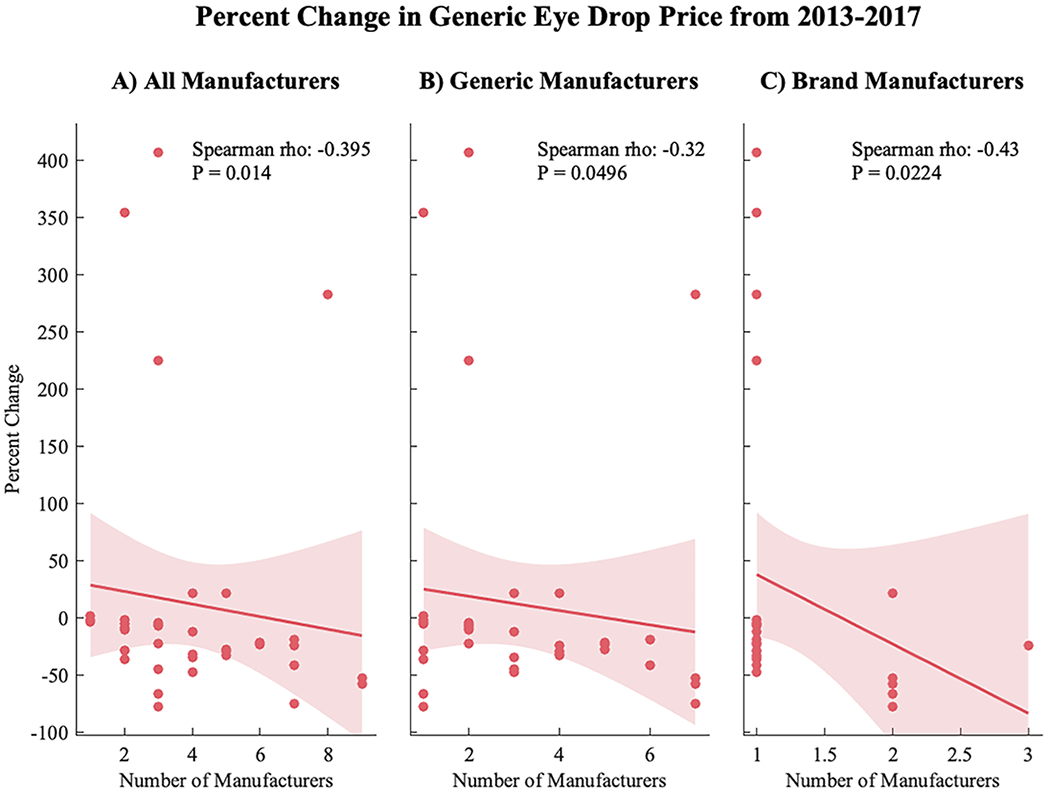
Percent change in generic eye drop price from 2013 to 2017 correlated to the number of (A) total manufacturers (both branded and generic), (B) only generic manufacturers, and (C) only branded drug formulation manufacturers. There was a significant inverse relationship between percent change and the number of total manufacturers (r=−.40, P=.01), generic manufacturers (r=−.32, P=.0496), and brand manufacturers (r=−.43, P=.02).
Table 2:
Trends in Pricing of Eye Drops by Number of Manufacturers
| A. Generic | B. Branded | |||
|---|---|---|---|---|
| Total No. of Manufacturers | Change in Price, Median (IQR), % | Baseline Unit Price 2013, Median (IQR), $ | Change in Price, Median (IQR), % | Baseline Unit Price 2013, Median (IQR), $ |
| 1 - 2 | −4.1 (8.9) | 1.5 (4) | 43.6 (27.3) | 22.6 (15) |
| 3 - 4 | −9.3 (48.5) | 4.8 (7.5) | N/A | N/A |
| 5 - 6 | −27 (7.5) | 2.6 (15.8) | 42.4 (15.2) | 42.1 (17) |
| >6 | −40.9 (35.8) | 1.7 (2.3) | 45.6 (35.3) | 32.8 (33.8) |
| Total | −20 (31.7) | 2.9 (6.8) | 43.8 (28.3) | 25.2 (23.5) |
Variation in Brand-Name Formulation Drug Prices and Number of Manufacturers
Of the 80 drugs in found in the Orange Book database, 35 were excluded for not being found in the NADAC database or for not having a branded formulation. 16 drugs were excluded for not having a price in each year between 2013-2017. The remaining 29 drugs corresponded to 38 unique brand-name drug formulations, which were included in the brand-name drug price analysis (Supplementary Table 4). Based on claims, the most highly prescribed branded drugs were anti-inflammatories (45%), glaucoma medications (32%), antimicrobials (21%) and dry eye medications (3%) (Table 1B).
The total number of all distinct FDA-approved manufacturers was not significantly associated with the change in price of branded formulations (P=.94) (Figure 2). There was also no significant association when considering only the number of manufacturers of generic (P=.98) or only branded formulations (P=.99). From 2013 to 2017, branded formulations with 1 to 2, 5 to 6, and greater than 6 total manufacturers experienced a median percentage increase in price of 44% (IQR 15%), 42% (IQR 35%), and 46% (IQR 28%), respectively (Table 2B).
Figure 2:

Percent change in branded eye drop price from 2013 to 2017 correlated to the number of (A) total manufacturers (both branded and generic), (B) only generic manufacturers, and (C) only branded drug formulation manufacturers. There were no significant associations between percent change and the number of manufacturers.
Comparison between Generic and Branded Drug Prices
Overall, generic eye drops had a median price change of −20% (IQR 32%) compared to a median price change of 44% (IQR 28%) in branded eye drops (P<.001).
Glaucoma Eye Drops Subgroup Analysis
Glaucoma eye drops comprised 13 (34%) of the generic and 12 (32%) of the branded eye drops studied. Generic glaucoma eye drops had a median price change of −27% (IQR 39%) compared to a median price change of 52% (IQR 25%) in branded glaucoma drops (P<.001). There was a significant inverse relationship between percentage price change and number of manufacturers for generic glaucoma drops (r=−.58, P=.039), but no significant association for branded glaucoma drops (r=−.56, P=.059).
Anti-Inflammatory Eye Drops Subgroup Analysis
Anti-inflammatory eye drops comprised 9 (24%) of the generic and 17 (45%) of the branded eye drops studied. Generic anti-inflammatory eye drops had a median price change of −10% (IQR 29%) compared to a median price change of 37% (IQR 16%) in brand-name anti-inflammatory drops (P=.007). There was a significant inverse relationship between percentage price change and number of manufacturers for generic anti-inflammatory drops (r=−.69, P=.047), but no significant association for branded anti-inflammatory drops (r=−.04, P=.89).
Antimicrobial Eye Drops Subgroup Analysis
Antimicrobial eye drops comprised 12 (32%) of the generic and 8 (21%) of the branded eye drops studied. Generic antimicrobial eye drops had a median price change of −23% (IQR 33%) compared to a median price change of 44% (IQR 38%) in branded antimicrobial eye drops (P=.004). There was no significant association between percentage price change and number of manufacturers for both generic (r=.21, P=.51) and branded (r=.23, P=.58) antimicrobial eye drops.
Outliers
Four generic eye drops sustained price escalations above 100% from 2013 to 2017: Ketorolac 0.4% (407% price increase), Atropine 1% (354%), Ofloxacin 0.3% (282%), and Proparacaine 0.5% (225%). Amongst the brand-name eye drops, Prolensa 0.07% (bromfenac, Bausch and Lomb, Quebec, CA) decreased in price by 38%, the only branded drug to experience a price reduction.
DISCUSSION
While national expenditures for ophthalmic medications continue to increase each year,3 we demonstrate that between 2013 to 2017 the price of generic eye drops decreased, while the price of branded eye drops increased. In a recent study, eye care providers held the highest proportion of brand-name drug claims when compared to other provider types.2 It was also reported that the number of prescriptions per person remained stable over time.2 Therefore, our findings further suggest that the rise in ophthalmic drug expenses may be explained by increasing branded drug prices. These results highlight a pharmacoeconomic imbalance that may impact consumers in various ways, not only financially. For example, price increases may lead to medication non-adherence, particularly in those within lower socioeconomic classes and the underinsured.12 Over time, this can be devastating to patients and public health, as the sight-threatening consequences of non-adherence to ophthalmic medications can place serious strain on the health care system.13
In the current study, most generic eye drop prices remained stable or reduced. An inverse association was identified between generic eye drop price changes and the number of FDA-approved manufacturers, with generic formulations with more than 6 manufacturers experiencing the largest price cuts. These findings are consistent with previous studies reporting associations between pharmaceutical producers and generic drug price. For example, systemic generic antibiotics with higher levels of market competition had significant price reductions over 5 years, whereas those under monopolies had significant price escalations.14 Similarly, an inverse association was reported between generic dermatologic medication price changes and the number of generic manufacturers.7 The FDA also demonstrated that the addition of a second, third, and fourth manufacturer reduced the generic price by approximately 50%, 44%, and 39% of the brand drug’s price, respectively.15
On the other hand, during the current study period, the vast majority of branded eye drops experienced a positive price change, and there was no apparent association between price change of branded eye drops and number of manufacturers. These findings match previous reports that the branded and generic markets seem to run differently, a phenomenon also known as the ‘Generic Competition Paradox’.3, 10, 16–18 According to this model, physicians can be divided into two groups: brand ‘loyal’ prescribers and brand ‘disloyal’ prescribers. The ‘disloyal’ group will change their demand from branded to generic drugs when cheaper alternate medications are available. The majority of ophthalmologists, however, for a number of reasons, are brand ‘loyalists’ as they predominantly prescribe brand eye drops despite their higher price.2 One explanation could be due to concerns about the clinical efficacy of generic ophthalmic medications. For topical generic drugs, the FDA only requires pharmaceutical equivalence, not bioequivalence, to the parent drug since demonstrating topical bioequivalence is difficult.19 This policy was introduced to mitigate regulatory burden and facilitate generic ophthalmic drug development. As a result, eye care providers may be wary of generic eye drop performance and thus stay ‘loyal’ to brand medications. This higher demand combined with the comfort of holding market dominance, as evidenced by ophthalmologists’ brand-over-generic preference, allows branded drug manufacturers to drive up the price of their eye drops. Moreover, to offset the loss from the abandonment of their ‘disloyal’ consumers, branded drug manufacturers may raise their prices.3, 16, 17 In contrast, the greater competition amongst generic manufacturers from their expedited development process coupled with the lower demand for generic eye drops more often results in price suppression over time, as evidenced in our study. This explanation is also supported by the finding that the number of manufacturers of branded formulations had a stronger inverse correlation to generic price change than did generic manufacturers numbers, as the addition of new brand manufacturers may place disproportionate financial stress on generic counterparts.
Notably, select generic eye drops of different classes sustained extreme price escalations, despite each having multiple FDA-approved manufacturers. While the exact causes of these price escalations were unclear, this price volatility affirms that the generic price setpoint is multi-factorial and cannot be explained through market competition or drug class alone. One possible explanation is due to a substantial loss in drug supply, a phenomenon that has become more common in recent years.20 According to a US Senate subcommittee investigation, some generic drug prices increased substantially after the exit of manufacturers without unregistering their drug. This potentially resulted in price spikes from unaccountable drops in competition or the incapability of the remaining manufacturers to match supply with a greater demand. Another consideration is the potential effect of financial intermediaries and incentives between drug manufacturers, the retail pharmacy market, and beneficiaries. For example, pharmaceutical benefit managers play an integral role in setting retail prices and negotiating rebates from manufacturers. The Centers for Medicare and Medicaid Services found that while pharmaceutical benefit managers have indeed helped lower drug prices in recent years, they may also have incentives to favor higher priced drugs.21 Unfortunately, there is a lack of transparency regarding the complex flow of funds through intermediaries, and this may ultimately reflect on point-of-sale prices.22 Furthermore, anticompetitive manufacturer practices may lead to higher prices. For example, in 2016 there were 20 states that accused multiple generic manufacturers of price collusion on doxycycline and glyburide resulting in higher prices.23 Accordingly, solutions to stabilize the ophthalmic medication market are needed in order to prevent price volatility. One option is to encourage long-term purchasing contracts to help avoid rapid price fluctuations and ensure a greater predictability in the wholesale supply and demand.20, 24 On the other hand, if the standard of care evolves, then the distributor bears the financial burden of its unused inventory.20 Therefore, further in-depth studies are needed to identify causes of and solutions to drug price volatility.
Medications for glaucoma, ocular inflammation, and ocular infections comprised the majority of the cost attributable to eye care providers.2 In the current study, price changes in generic, but not branded, glaucoma and anti-inflammatory eye drops were inversely associated with the total number of manufacturers, and there was no significant association for generic or branded antimicrobial eye drops, even after excluding outliers. These findings suggest that certain classes of eye drops may be affected by manufacturing numbers more so than others. More studies are needed to explore the physician-consumer and market factors affecting price changes of various eye drop classes.
There are several limitations to this study. First, the NADAC pricing database is generated according to national surveys. As a result, it is subject to potential selection bias or may not fully represent the retail pharmacy market. Additionally, this study calculated price change according to the only available overlapping beginning and endpoint between the NADAC and Medicare Part D PUF. Future studies over a longer period may benefit from a more detailed trend analysis for each medication. Given the necessity with the study methodology for overlap between the NADAC database and the Orange Book database, only 34 generic and 29 branded medications were included for analysis. Furthermore, although the FDA Orange Book reports all FDA-approved manufacturers, not all approved manufacturers may be producing the medication for various reasons. This could result in a potential overestimation of manufacturer numbers. This study also does not take into account changes in manufacturer numbers during the time period studied, which may have affected prices of some drugs. Finally, the Medicare claims database is limited to claims by Medicare beneficiaries and does not account for prescriptions that may have been written by providers but never filled.
In conclusion, the present study identifies an inverse association between generic eye drop price changes and the number of generic manufacturers. This study also highlights price escalations in branded medications, independent of the number of manufacturers, and reveals that the influence of market competition may be different between eye drop classes. In order to combat the rising prices of brand-name eye drops, more comparative effectiveness trials between generic and branded eye drops should be considered to try to address any doubts of generic drug performance. Additionally, increased physician awareness to utilize generic substitutions when available and appropriate may also help reduce healthcare costs. Further study is needed to define the complex relationships between market competition and the varying price of commonly used topical ophthalmic medications.
Supplementary Material
Acknowledgements:
Funding: Bascom Palmer Eye Institute received funding from the NIH Core Grant P30EY014801, Department of Defense Grant #W81XWH-13-1-0048, and a Research to Prevent Blindness Unrestricted Grant. The sponsors or funding organizations had no role in the design or conduct of this research.
Footnotes
Financial Interests: Dr. Sridhar is a consultant for Alcon, Oxurion, and Regeneron. Dr. Yannuzzi is a consultant for Alimera Science, Genentech, and Novartis.
Previous Presentations: N/A
References:
- 1.Kesselheim AS, Avorn J, Sarpatwari A. The High Cost of Prescription Drugs in the United States: Origins and Prospects for Reform. JAMA. 2016;316(8):858–871. [DOI] [PubMed] [Google Scholar]
- 2.Newman-Casey PA, Woodward MA, Niziol LM, et al. Brand Medications and Medicare Part D: How Eye Care Providers’ Prescribing Patterns Influence Costs. Ophthalmology. 2018;125(3):332–339. [DOI] [PMC free article] [PubMed] [Google Scholar]
- 3.Chen EM, Kombo N, Teng CC, et al. Ophthalmic Medication Expenditures and Out-of-pocket Spending: An analysis of US prescriptions from 2007–2016. Ophthalmology. 2020. [DOI] [PMC free article] [PubMed] [Google Scholar]
- 4.Kanavos P, Ferrario A, Vandoros S, et al. Higher US branded drug prices and spending compared to other countries may stem partly from quick uptake of new drugs. Health affairs. 2013;32(4):753–761. [DOI] [PubMed] [Google Scholar]
- 5.Generic Pharmaceutical A. Generic drug savings in the US. 4th annual ed Generic Pharmaceutical Association, Washington, DC: http://www.ahipcoverage.com/wp-content/uploads/2012/08/2012-GPHA-IMS-GENERIC-SAVINGS-STUDY.pdf. 2012. [Google Scholar]
- 6.Alpern JD, Zhang L, Stauffer WM, et al. Trends in Pricing and Generic Competition Within the Oral Antibiotic Drug Market in the United States. Clin Infect Dis. 2017;65(11):1848–1852. [DOI] [PMC free article] [PubMed] [Google Scholar]
- 7.Li DG, Joyce C, Mostaghimi A. Association Between Market Competition and Prices of Generic Topical Dermatology Drugs. JAMA Dermatol. 2018;154(12):1441–1446. [DOI] [PMC free article] [PubMed] [Google Scholar]
- 8.Ramsey SD. How state and federal policies as well as advances in genome science contribute to the high cost of cancer drugs. Health Aff (Millwood). 2015;34(4):571–575. [DOI] [PubMed] [Google Scholar]
- 9.Saku K, Zhang B, Noda K, et al. Randomized head-to-head comparison of pitavastatin, atorvastatin, and rosuvastatin for safety and efficacy (quantity and quality of LDL): the PATROL trial. Circ J. 2011;75(6):1493–1505. [DOI] [PubMed] [Google Scholar]
- 10.Consumer Reports. Knowing when prescription prices are high and how to avoid overspending. Available: https://www.consumerreports.org/cro/2012/11/where-high-drug-costs-hide/index.htm. Accessed May 13, 2020.
- 11.Reinke T Managed Care. Free Statins Disrupt Pharmacy Benefit Plans. Accessed May 13, 2020. [PubMed] [Google Scholar]
- 12.Slota C, Sayner R, Vitko M, et al. Glaucoma patient expression of medication problems and nonadherence. Optom Vis Sci. 2015;92(5):537–543. [DOI] [PMC free article] [PubMed] [Google Scholar]
- 13.Newman-Casey PA, Salman M, Lee PP, et al. Cost-Utility Analysis of Glaucoma Medication Adherence. Ophthalmology. 2020;127(5):589–598. [DOI] [PMC free article] [PubMed] [Google Scholar]
- 14.Dave CV, Kesselheim AS, Fox ER, et al. High Generic Drug Prices and Market Competition: A Retrospective Cohort Study. Ann Intern Med. 2017;167(3):145–151. [DOI] [PubMed] [Google Scholar]
- 15. New Evidence Linking Greater Generic Competition and Lower Generic Drug Prices. Available: https://www.fda.gov/about-fda/center-drug-evaluation-and-research-cder/generic-competition-and-drug-prices. [Google Scholar]
- 16.Frank RG, Salkever DS. Generic entry and the pricing of pharmaceuticals. J Econ Manage Strat. 1997;6(1):75–90. [Google Scholar]
- 17.Grabowski HG, Vernon JM. Brand Loyalty, Entry, and Price-Competition in Pharmaceuticals after the 1984 Drug-Act. J Law Econ. 1992;35(2):331–350. [Google Scholar]
- 18.The Express Scripts Lab. The Express Scripts 2014 Drug Trend Report. March 2015. [Google Scholar]
- 19.Cantor LB. Ophthalmic generic drug approval process: implications for efficacy and safety. J Glaucoma. 1997;6(5):344–349. [DOI] [PubMed] [Google Scholar]
- 20.Wiske CP, Ogbechie OA, Schulman KA. Options to Promote Competitive Generics Markets in the United States. JAMA. 2015;314(20):2129–2130. [DOI] [PubMed] [Google Scholar]
- 21.Dusetzina SB, Conti RM, Yu NL, et al. Association of Prescription Drug Price Rebates in Medicare Part D With Patient Out-of-Pocket and Federal Spending. JAMA Intern Med. 2017;177(8):1185–1188. [DOI] [PMC free article] [PubMed] [Google Scholar]
- 22.Schulman KA, Dabora M. The relationship between pharmacy benefit managers (PBMs) and the cost of therapies in the US pharmaceutical market: A policy primer for clinicians. Am Heart J. 2018;206:113–122. [DOI] [PubMed] [Google Scholar]
- 23.The New York Times. 20 States Accuse Generic Drug Companies of Price Fixing. Available: https://www.nytimes.com/2016/12/15/business/generic-drug-price-lawsuit-teva-mylan.html. Accessed May 19, 2020.
- 24.Strategies to sustain success in childhood immunizations. The National Vaccine Advisory Committee. JAMA. 1999;282(4):363–370. [DOI] [PubMed] [Google Scholar]
Associated Data
This section collects any data citations, data availability statements, or supplementary materials included in this article.