

Abstract
Given the non-linearity of many protein properties with a short range of concentration which cannot be predicted a priori, and due to the lack of references in the food industry, we proceeded to analyze the foaming ones. The existing bibliography belongs to other fields of research but it is scarcely found for this area. For the food industry, ultrasound is considered one of the most environment-friendly processing. In addition, heating combination would alter their results considerably by synergistic or additive phenomena. Native soy protein isolate was obtained in our laboratory to use it as starting material; ultrasound with temperature was applied at 2, 4 and 6%w/w protein concentrations. Therefore, the objective of this paper was to determine the effect of ultrasound+temperature (50 or 90 °C) simultaneously applied, on the foamability by relating with the relative viscoelasticity, aggregates particle size distribution and their surface charge by zeta potential. The results indicated that treatments promoted changes on the functional parameters depending on the protein concentration. The analysis showed that at 4%wt/wt was adequate to improve foam formation and stability at same time. Dynamic rheology of continuous phase was relation with foamability showing the higher relative viscoelasticity at 4% of concentration after the combined treatment. Light scattering studies could partially explain this observation, taking into account both, the bulk viscosity and the low number of large particles formed after treating. Surface charge was increased for all concentrations equally leading to the aggregates formation of greater colloidal stability for all concentration and treatment conditions investigated.
Supplementary Information
The online version contains supplementary material available at (10.1007/s13197-020-04954-w).
Keywords: Soy proteins, Concentration, Ultrasound, Heat, Foamability
Introduction
Usually the protein concentration in a short range related with their corresponding properties is not considered even when it known that determines the particular performance of general proteins functionality.
A few works exist related to the protein concentration in this short rage, but are scarce referring to the foaming properties. Wang et al. (2020) studied the effects of preheating or ultrasound treatment of soy proteins at different concentrations (1–10%) on the gelation behavior. They deduced that the induced aggregation and gelation behaviors of pretreated proteins were strongly related to the concentration used. At lower protein concentrations a weaker gelling ability were presented after reheat treatment, but, protein samples preheated at the highest concentration showed improved gelling ability. However, all concentrations studied were improved after ultrasound treatment, showing greater gelling ability.
A study on foaming properties related to the soy protein concentration, using ultrasound technology, would provide valuable knowledge, not very documented in this industry. Most of the novel techniques are studied at any particular concentration but there is no overview of the properties dependent on these conditions. They mostly belongs to the field of physics and pharmaceuticals (Woldeyes et al. 2019; Barnett et al. 2015; Neergaard et al. 2013; Ibrahim et al. 2019; de Souza et al. 2015).
High intensity ultrasound (HIUS) corresponds to the application of high frequency sound waves (between 20 and 100 kHz) and large amplitudes (10–100 Wcm−2). A part of the energy of the waves is absorbed and converted into mechanical and thermal energy that changes the properties of the food system (McClements 1995). The HIUS have been successfully used to homogenize emulsions, mix suspensions, aid in extraction processes (Villamiel and Jong 2000). For the food industry, this technology is considered as ‘‘green chemistry” performing chemical reactions using environmentally gentle solvents and reactants (Weiss et al. 2011).
Additionally, heating combined process would alter their results considerably by synergistic or additive phenomena. Previous studies on this soy protein at 2%wt/wt showed a synergistic effect between HIUS and temperature (70, 80 and 85 °C) when were applied simultaneously. The foaming capacity increased to 240% at all temperature studied that were higher than those obtained by HIUS at room temperature (202%) (Morales et al. 2015). However, we do not know the trend to other concentrations used in the food industry.
Therefore, the objective of this work was to determine the effect of ultrasound + temperature combination on the foaming properties for native soy protein isolate correlating with the relative viscoelasticity of their continuous phase, the aggregates particle size distributions and the surface charge at 2, 4 and 6%w/w protein concentrations.
Materials and methods
Native soy protein isolation, characterization and solutions preparation
Native soy protein isolate (NSPI) was obtained from soybean defatted flour (Sanbra S.A., Brazil) as was described elsewhere (Morales et al. 2015). Briefly, it was obtained from flour extraction at pH 8.0 with NaOH, precipitation at pH 4.5 and neutralization at pH 7.0. The protein content was 90.5% by Kjeldahl analysis (Kjeltec Auto Analyzer 1030, Tecator, Sweden).
The NSPI solutions with the power resulted from the freeze-drying process after the isolate extraction, were prepared in distilled water at 2, 4 and 6%w/w, with a magnetic stirrer overnight. The viscosity at room temperature measured by a Brookfield viscometer at 20 °C, with an angle of 0.8°, at increasing shear rates in the range 90–150 S−1 with a cone and plate S40 DV-LVT were: 1.5, 1.8 and 2.3 cp respectively.
The NSPI solubility through soluble solids measurement described elsewhere (Martinez et al. 2009) was 19%w/w.
Combination of High-intensity ultrasound (HIUS) and heat treatment
NSPI solutions at different protein concentrations were sonicated for 20 min using an ultrasonic processor Vibra Cell Sonics, model VCX as was described elsewhere (Martinez et al. 2009). The treatment time was selected in a basis of previous study (Morales et al. 2015) on native soy proteins. In brief, the frequency and amplitude were constant at 20 kHz and 20% respectively. A tapered microtip of 3 mm was used to sonicate 10 ml of the solutions. Samples contained into glass test tubes were immersed into a glycerine-jacketed at 0.5 °C to dissipate most of the heat produced during sonication treatments (Polystat, Cole-Parmer). On the other hand, the same HIUS treatments were done simultaneously with different temperatures, settled in the glycerine-jacketed at 50 or 90 °C respectively.
Thermal treatment
To evaluate the effect of temperature alone, a dry bath from Thermo Fisher Scientific, Thermoline Dri-Bath was used (Massachusetts, USA). For that, 20 ml of each NSPI solution was placed in the corresponding grass test tubes at different temperatures, 50 and 90 °C for 20 min.
Foaming properties
Foam formation
30 mL of solutions at 2, 4 and 6%wt/wt of NSPI was foamed at 25 °C in a graduated tube (3 cm diameter) for 3 min with Griffin and George stirrer at 2500 rpm. Overrun was calculated as:
| 1 |
The data reported are means of at least five replicates. The error was less than 10%.
Foam stability: drainage velocity
The volume of liquid drained to the bottom of the graduated tubes was recorded over time. The following empirical mathematical model was applied to fit drainage over time (Carp et al. 1997):
| 2 |
where: v(t) is the drained volume at time t; V is the maximum drained volume; n is a constant related to the sigmoid shape of the curves; and c a constant related to drainage half time by c1/n.
The rate constant for drainage (Kdr) was calculated as:
| 3 |
The data reported are means of at least five replicates. The relative error in Kdr was less than 10%.
ζ potential and dynamic light scattering (DLS)
Particle size distribution and its derived parameter, main peaks, and ζ potential measurements were carried out at 25 °C conforming described Ochnio et al. (2018). It was used a Zetasizer Nano-Zs particle analyzer (Malvern Instruments, Worcestershire, UK). isposable capillary cells were used to perform ζ potential experiments (DTS1060, Malvern Instruments, Worcestershire, UK). All measured samples were previously filtered by 0.22 and 0.45 μm filter.
Dynamic rheology
Dynamic rheological properties of NSPI continuous phase were determined with a Paar Physica MCR 300 (Gaz, Austria), equipped with parallel plate of 30 mm geometry as was indicated in Martinez and Pilosof (2012). The temperature at the bottom plate was controlled with a Peltier System Viscotherm VT2, Paar Physica (Gaz, Austria). Approximately 0.7 ml of sample was placed between the plates, which allowed to completely fill the space between them.
The heating was carried out at a speed of 10 °C/min up to the desired temperature from 25 to 90 °C. It remained 90 °C for 15 min and then the temperature was lowered with the same speed ramp to 25 °C. The relative viscoelasticity (tan δ) reached at the end of the cooling period were evaluated from the dynamic measurements. These values reported are means of at least five replicates and the error was less of 10%. It was recorded using a strain of 0.01% and a frequency of 1 Hz. These conditions were previously evaluated as the zone of linear viscoelasticity of the systems.
Statistical analysis
Significant differences between the studies were determined by analysis of variance (one-way ANOVA) using the Statgraphics Centurion XV program, Version 15.2.06, with a confidence level of 95%.
Results and discussion
Foaming properties: foam capacity and drainage
In the Table 1 it can be seen the foaming capacity (FC) for NSPI at every treatment assayed with all concentration used.
Table 1.
Foaming capacity (FC (%)) for NSPI at all treatments applied
| Treatment/(%wt/wt) | 2 | 4 | 6 |
|---|---|---|---|
| RT | 36.3 ± 0.0bA | 150 ± 0.0bB | 220 ± 6.6bC |
| HIUS | 68.0 ± 3.3cA | 250 ± 3.3cB | 250 ± 6.6cB |
| 50 °C | 33.3 ± 0.0bA | 160 ± 3.3bB | 220 ± 0.0bC |
| HIUS+50 °C | 62.0 ± 3.3cA | 220 ± 3.3cB | 260 ± 0.0cC |
| 90 °C | 30 ± 6.7aA | 130± 13.3aB | 180 ± 3.3aC |
| HIUS+90 °C | 38 ± 6.7bA | 208± 6.6bB | 200 ± 0.0bB |
Mean ± SD of at least five replicates, independently treated.
Same superscript indicates belonging to the same statistical group in the observed result, a, b, c, d by columns (treatment effect); A, B by rows (concentration effect).
It can be seen a remarkable treatments effects along 2%wt/wt. It was very notable the HIUS effect, that promotes almost a 100% of FC increase respect to the control (RT). Analogous trend (with lower values due to the structural differences of the isolate) were obtained previously (Morales et al. 2015). The HIUS effect increase can be attributed to the breakdown of protein aggregates due to cavitation during sonication improving the absorption rate of protein on the interface; the hydrodynamic volume changes and the decrease of particle size (Arzeni et al. 2012; Shanmugam et al. 2012; Tan et al. 2015).
However, when temperature alone was applied, an unchaged or slightly decreased FC was noted after 50 and 90 °C application respectively. Morales et al. (2015) showed similar results obtained at 2%wt/wt of soy protein. It was stated that heat treatment did not modify significantly the protein structure which would influence the FC.
Ma et al. (2020) studied the heat-induced aggregation of edible proteins for their application in protein-enriched beverages. To assess the thermal stability of preheated soy proteins, the heat-induce aggregation behaviour at a concentration of 1%w/v were investigated. Preheat treatment had no impact on the primary structure of proteins because similar protein compositions were found in all the modified samples and the untreated one, therefore, they further observed the effects of preheating process on the secondary structure of soy proteins using the far-UVCD. This allows to change probably its thermal stability through denaturation and protein aggregations (Morales et al. 2015).
Nevertheless, simultaneous application of HIUS+T, would provoke a intermediate results on this parameter due to ultrasound increase and temperature decrease foamability trend on 2% showing an additive phenomena.
At 4 and 6% the same foamability trend was observed with smaller differences between treatments as the concentration was higher. At 6% small variation between treatments were observed as a consequence of the higher viscosity (2.3 cP) by comparing with 1.5 cP for 2% of concentration (Carp et al. 2004). Even though protein solubility tends to decrease with increasing concentration (Britten and Lavoie 1992), it is very unlikely through this small range, being the viscosity the mean property affecting these results.
While, 4% with 1.8 Cp of viscosity, allows to incorporate higher air amount during whipping and more protein content were present at same time.
That is to say, at low concentrations (2%), treatments have a greater influence on FC, but the amount of protein is the limiting factor for a greater increase in the property. Whereas, at higher concentrations (6%), the amount of protein is not limiting, but the high bulk viscosity prevents further air incorporation, so that, the effects of the treatment are not appreciated. In the Supplementary Figure 1a it can be seen graphically these described differences for clarity.
Drainage velocity results are shown in the Table 2. At 2% of protein concentration, minimal changes were seen as a result of the treatments. Probably, at this concentration in addition to low viscosity of the continuous phase, the minimal amount of protein diffused to the interface, forming the foam, does not allow an adequate film interfacial formation and it does not supports the structure with time (Martinez et al. 2007).
Table 2.
Drainage stability Kdren (ml.min)-1 for NSPI at all treatments applied
| Treatment/(%wt/wt) | 2 | 4 | 6 |
|---|---|---|---|
| RT | (12.0 ± 0.9)10−3aA | (3.0 ± 1.2)10−3aC | (10.2 ± 0.7)10−4aD |
| HIUS | (9.2 ± 0.7)10−3bA | (15.2 ± 1.5)10−4bD | (9.2 ± 1.3)10−4aD |
| 50 °C | (11.4 ± 0.8)10−3aA | (6.0 ± 0.8)10−3aB | (11.2 ± 0.7)10−4aD |
| HIUS+50 °C | (10.4 ± 0.5)10−3abA | (18.2 ± 0.7)10−4bD | (12.4 ± 0.5)10−4aD |
| 90 °C | (12.4 ± 0.5)10−3aA | (16.2 ± 2.1)10−4bD | (12.3 ± 0.8)10−4aD |
| HIUS+90 °C | (9.4 ± 0.8)10−3bA | (17.2 ± 0.9)10−4bD | (10.4 ± 1.5)10−4aD |
Mean ± SD of at least five replicates, independently treated.
Same superscript indicates belonging to the same statistical group in the observed result, a, b, c, by columns (treatment effect); A, B, C by rows (concentrations effect).
However, it can be observed a slight increase of drainage stability (velocity drainage decrease) after HIUS and HIUS+90 °C treatments. The changes at protein structure after HIUS application, causes also a solubility increase and higher protein flexibility, improving the molecules absorption for foam formation with further better stabilization at same concentration (Bouaouina et al. 2006).
At 4% greater differences are observed, being able to highlight the effects of all HIUS and temperature combined treatments with the exception of heat treatment at 50 °C. In this case, greater amount of protein will contribute highly to the formation of a cohesive viscoelastic film via intermolecular interactions giving better foam stability (Dickinson et al. 1995, chap 3).
While, at 6% no differences were obtained for treatments effects (see Supplementary Figure1b). Apparently, the viscosity was so height that it did not allow to see further effects.
Therefore, the concentration at which the different treatments had the best results was 4% as was observed for foam parameters.
Dynamic light scattering measurements (DLS)
The NSPI particle size distribution was carried out by dynamic light scattering for the HIUS+T treatments for the concentrations studied.
Based on the results provided by the software, we proceeded to analyze the Volume (%). This is a quantitative indicator of the population, describes the representative percentage of the particle size distribution and, although other sizes are present, the majority fraction determines the functional properties (Arzeni et al. 2012; Morales et al. 2015). For this reason, it was decided to analyze the effect of the treatments by describing the peak/s majority/s in the particle size distribution shown as Volume (%).
Figure 1a–c shows the NSPI particle size distributions for all applied treatments at 2, 4 and 6% respectively. The results show a majority peak at 10 nm in diameter of the particle size distribution for the no treated and HIUS NSPI treated (Fig. 1a). The peak value obtained for NSPI is consistent with previous studies on denatured soy protein (Arzeni et al. 2012; Jambrak 2009; Morales et al. 2015).
Fig. 1.
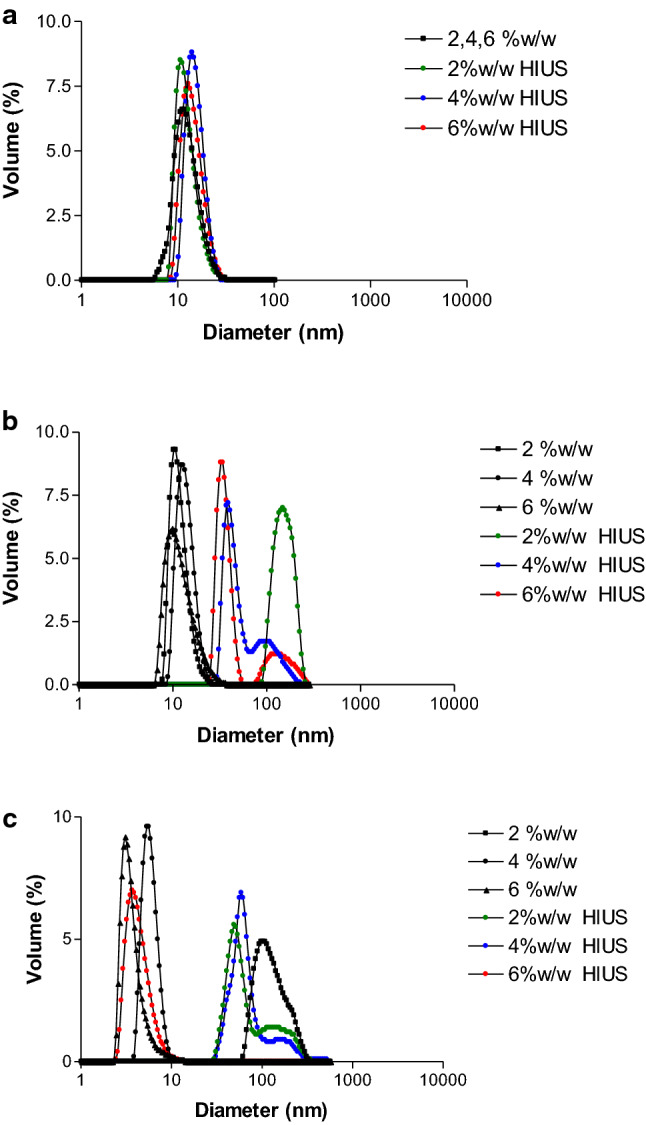
Particle size distribution in hydrodynamic diameter for the studied NSPI concentrations: a HIUS at room temperature (RT); b HIUS+50 °C, c HIUS+90 °C
However, difference was not observed for NSPI after HIUS, at any of the concentrations studied. Contrary results were showed in similar conditions on soy and other proteins (Morales et al. 2015), where HIUS was correlated to the decrease in particle size at room temperature due to aggregates rupture. Contrary, others protein sources at similar concentrations showed an increment of particle size associated with thermal aggregation during the ultrasound treatment solely (Arzeni et al. 2012). Thus, HIUS could provoke different type of interactions (electrostatic, hydrophobic, hydrogen bridge) depend on the protein conformation causing the breakdown or association of protein aggregates during the process.
Nonetheless, the HIUS+T combination, generated particle distributions with peaks greater than 10 nm (Fig. 1b–c). These peaks were larger when lower the protein concentration was used, suggesting than the greater effects was at lower viscosities, related to mayor penetration effect of the HIUS (Villamiel and Jong 2000), together with temperature aggregation effects.
Nevertheless, these distributions would not explain completely the results obtained in the foaming properties (a decrease of foamability for 6% after 90 °C treatment), unless we analyze the distribution as Intensity (%). In this distribution (corresponding to whole range obtained), it can be observed a large polydispersity increment only when 90 °C for 4 and 6% or HIUS+90 °C treatments for 6% were applied (Fig. 2a, b, c respectively). In these cases the polydispersity values went from 0.2 without treatments to 0.6 and 0.7 for 4 and 6% with treatments respectively. These values are usually between 0.05 for monodisperse and 0.7 for polydisperse proteins solutions (Malvern Instruments, 2001).
Fig. 2.
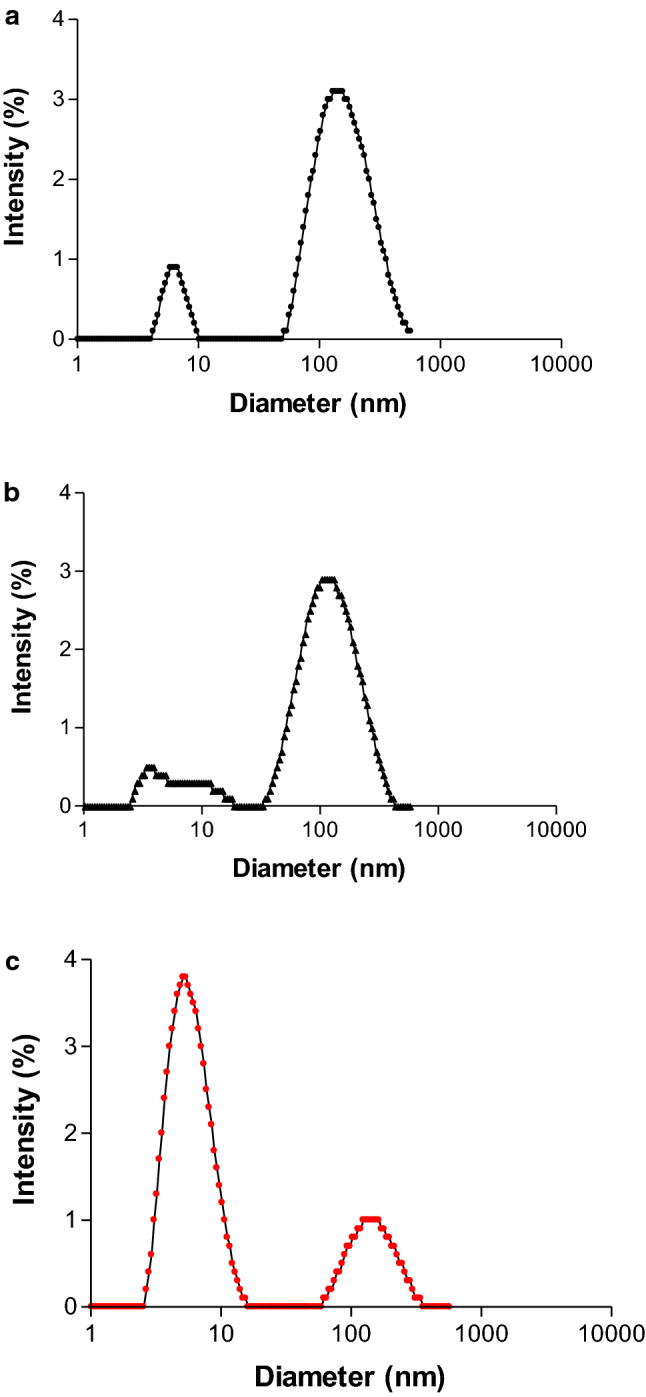
Particle size distribution of NSPI in Intensity (%) for: a 4%wt/wt 90 °C; b 6%wt/wt 90 °C; c 6%w/w after HIUS+90 °C treatement
This means that, although in low proportion, the greater particle size (about 100–200 nm) appeared in the Intensity (%) distribution after 90 °C and their combined treatment application, would provoke effects on foamability, contributing to the final functionality (Morales et al. 2015). Thus, it could be inferred that these aggregates formation after the treatments, could impede higher foaming capacities being also the cause of their decrease, together with higher viscosity of their continuous phase.
ζ potential
Colloidal particles are charged on their surface, which can be expressed as a surface potential. This potential is an important factor in determining the magnitude of colloidal interactions, such as electrostatic repulsion between charged particles (Vanapalli and Coupland 2000; Bouzid et al. 2008).
Table 3 shows the Zeta potential values for NSPI at the different conditions treatments and concentrations.
Table 4.
Relative viscolasticity (tan δ) at ending of cooling phase (25 °C) for every NSPI solution and treatment
| HIUS-T | NSPI (%wt/wt) | Tan δ |
|---|---|---|
| RT | 2 | 0.98f |
| 4 | 0.55e | |
| 6 | 0.60e | |
| HIUS | 2 | 0.88f |
| 4 | 0.23b | |
| 6 | 0.39c | |
| 50 °C | 2 | 0.97f |
| 4 | 0.89f | |
| 6 | 0.92f | |
| HIUS+50 °C | 2 | 0.97f |
| 4 | 0.14a | |
| 6 | 0.28b | |
| 90 °C | 2 | 0.99f |
| 4 | 0.97f | |
| 6 | 0.87f | |
| HIUS+90 °C | 2 | 0.96f |
| 4 | 0.18a | |
| 6 | 0.27b |
Mean ± SD% less of 10% for tan δ of at least five replicates.
Table 3.
Zeta Potential (ζ)* for NSPI at all treatment and concentration studied
| Treatments /NSPI | Zeta Potencial (mV) | ||
|---|---|---|---|
| 2%w/w | 4%w/w | 6%w/w | |
| RT | − 17.1 ± 8.2 a | − 12.5 ± 8.4 a | − 15.5 ± 4.8 a |
| HIUS | − 23.9 ± 5.8 ab | − 26.8 ± 6.0 b | − 23.0 ± 5.5 abc |
| 50 °C | − 24.0 ± 5.0 ab | − 23.0 ±6.0 ab | − 19.0 ±7.0 ab |
| HIUS+50 °C | − 30.3 ± 6.1 b | − 32.0 ± 6.9 b | − 31.8 ± 6.6 c |
| 90 °C | − 30.0 ± 6.0 b | − 27.0± 7.0 b | − 25.0± 6.0 bc |
| HIUS+90 °C | − 30.1 ± 6.5 b | − 29.8 ± 7.8 b | − 12.8 ± 7.2 a |
HIUS conditions: power output: 4.27 ± 0.71W; frequency: 20 kHz; amplitude: 20%; time of treatment: 20 min. A Mean ± SD of at least three replicates, independently treated. RT: room temperature.
Mean ± SD of at least three replicates, independently treated.
Same superscript indicates belonging to the same statistical group in the observed result, a, b, c, by columns (treatment effect).
It can be seen that all the samples examined showed negative values due to the natural pH of the isolate (pH = 7).
Zeta potential increase is obtained when the surface was altered by reducing the size of the aggregates (Sağlam et al. 2013). However, judging by the particle size results (Fig. 2a–c), the Zeta potential increment in this work is due to conformational changes at the surface level. Both, the heat treatment at 90 °C, and HIUS+90 °C cause a greater exposure of negative residues on the surface of aggregates, due to the appearance of new interactions caused by treatments (McClements 1995).
It can be concluded that, residues that previously remained inside the NSPI aggregates were exposed or partially unfolded, altering the surface charge, promoting an increase in its negative value for all concentrations. As a result, this prevents a closer approach which would lead to destabilization (such as flocculation) between the particles in a dispersed system. This fact would allow to obtain particles of greater stability, since it would inhibit an additional aggregation in a system like this (Jiang et al. 2014).
Dynamic rheology: relative viscoelasticity
The relative viscoelasticity (tanδ) reached at the end of the cooling period were evaluated from the dynamic measurements for NSPI. Taking into account that a reduction of tan δ means an increase in the relative viscoelasticity, we can infer a stronger structure with this increase occurs (Haque et al. 1994). Thus, a higher relative viscoelasticity could be indicated a better structure formation after treatments for the studied systems, improving their continuous phase stability in foams or emulsions (Kinsella 1981).
In the Table 4 it can be seen tan δ at 25 °C for every NSPI solution and treatment.
Tan δ at the end of cooling phase of rheological measurements (temperature where also foams were made in the current work) exhibit a range from 0.14 to 0.99. As was explain before, as lower results this parameter, as higher relative viscoelasticity of continuous phase were considered. It can be seen that these parameters showed the highest values (or lowest tan δ) for 4% of protein concentration after HIUS+T combined treatment were applied. Since the relative viscoelsticity is a quotient between G´´(elastic component) and G´(viscous component), higher viscoelasticity implies a more elastic proportion of their structure and consequently explains the greater stability found in foamed systems after HIUS+T application. In other hand, in the rest of results presented a very high tan δ value, presenting also low values of elastic module. In the corresponding dynamic rheological diagrams obtained, it was observed a large oscillation of G″ (viscous component) values and consequently, of tan δ. Previous results showed that the elastic module reduction during same measurements could relation with unfavorable effects on foam stability of protein-polysaccharides mixed systems (Martinez and Pilosof 2013). Those results showed that the polysaccharides interactions conduced to velocity drainage and foam collapse increases for foams studies.
Thus, the relative viscoelasticity obtained after treatments from the dynamic rheological behavior of continuous phase of NSPI, could explain the foam stability at these conditions
Conclusions
From a balance between bulk viscosity and protein availability for both, formation and stabilization of foams, 4%wt/wt was the best concentration to obtain capacity and stability properties improving results after HIUS+T applications.
Relative viscoelasticity values of continuous phase from the dynamic rheological behavior for NSPI, could explain the foam stability after treatments applications. A higher viscoelasticity parameter for 4% of protein concentration after the ultrasound and the combined treatment were obtained.
Light scattering studies could also partially explain this observation. At 2% of protein concentration, the results would be more influenced by the treatments due to low bulk viscosity. While, at 6%, a greater aggregates size formation in a low proportion would domain the protein functionality after treatments; in addition to the general higher bulk viscosity of this concentration.
In the other hand, surface charge was increased for all NSPI concentrations and treatments, by exposing or partially residues unfolding leading to the aggregates formation of greater colloidal stability for all concentration and treatment conditions.
Supplementary Information
Acknowledgements
This research was supported by Consejo Nacional de Investigaciones Científicas y Técnicas de la República Argentina (CONICET) and Universidad de Buenos Aires.
Compliance with ethical standards
Conflicts of interest
The authors declare no conflict of interest.
Footnotes
Publisher's Note
Springer Nature remains neutral with regard to jurisdictional claims in published maps and institutional affiliations.
References
- Arzeni C, Martinez K, Zema P, et al. Comparative study of intensity ultrasound effects on food proteins functionality. J Food Eng. 2012;108:463–472. doi: 10.1016/j.jfoodeng.2011.08.018. [DOI] [Google Scholar]
- Barnett GV, Qi W, Amin S, et al. Aggregate structure, morphology and the effect of aggregation mechanisms on viscosity at elevated protein concentrations. Biophys Chem. 2015;207:21–29. doi: 10.1016/j.bpc.2015.07.002. [DOI] [PubMed] [Google Scholar]
- Bouaouina H, Desrumaux A, Loisel C, et al. Functional properties of whey proteins as affected by dynamic high-pressure treatment. Int Dairy J. 2006;16(4):275–284. doi: 10.1016/j.idairyj.2005.05.004. [DOI] [Google Scholar]
- Bouzid H, Rabiller-Baurdy M, Paugam L, et al. Impact of zeta potential and size of caseins as precursors of fouling deposition limiting and critical fluxes in spiral ultrafiltration of modified skim milks. J Membr Sci. 2008;314(1):67–75. doi: 10.1016/j.memsci.2008.01.028. [DOI] [Google Scholar]
- Britten M, Lavoie L. Foaming properties of proteins as afected by concentration. J Food Sci. 1992;57(5):1219–1222. doi: 10.1111/j.1365-2621.1992.tb11303.x. [DOI] [Google Scholar]
- Carp DJ, Wagner GB, Bartholomai GB, et al. Rheological method for kinetics of drainage and disproportionation of soy proteins foams. J Food Sci. 1997;62:1105–1109. doi: 10.1111/j.1365-2621.1997.tb12223.x. [DOI] [Google Scholar]
- Carp DJ, Baeza RI, Bartholomai GB, et al. Impact of proteinek-carrageenan interactions on foam properties. Lebensm Wissen-schaft und-Technol. 2004;37:573–580. doi: 10.1016/j.lwt.2003.11.007. [DOI] [Google Scholar]
- de Souza AB, Costa LCG, Jr, Stephani R, et al. Evaluation of the viscosity profile obtained for dispersions containing different proportions of milk protein concentrate/whey protein concentrate during simulated conditions of thermal processing. LWT-Food Sci Technol. 2015;64(2):536–539. doi: 10.1016/j.lwt.2015.05.058. [DOI] [Google Scholar]
- Dickinson E, McClements DJ (1995) Protein–polysaccharide interactions. In E. 377
- Haque A, Morris ER, Richardson RK. Polysaccharide substitutes for gluten in non-wheat bread. Carbohydr Polym. 1994;25:377–384. doi: 10.1016/0144-8617(94)90060-4. [DOI] [Google Scholar]
- Ibrahim MG, Hasona WM, ElShekhipy AA. Concentration-dependent viscosity and thermal radiation effects on MHD peristaltic motion of synovial nanofluid: applications to rheumatoid arthritis treatment. Comput Methods Progr Biomed. 2019;170:39–52. doi: 10.1016/j.cmpb.2019.01.001. [DOI] [PubMed] [Google Scholar]
- Jambrak AR. Physical properties of ultrasound treated soy proteins. Journal of Food Engineering. 2009;93(2):386–393. doi: 10.1016/j.jfoodeng.2009.02.001. [DOI] [Google Scholar]
- Jiang L, Wang J, Li Y, Wang Z, et al. Effects of ultrasound on the structure and physical properties of black bean protein isolates. Food Res Int. 2014;62:595–601. doi: 10.1016/j.foodres.2014.04.022. [DOI] [Google Scholar]
- Kinsella JE. Functional properties of proteins: possible relationship between structure and function in foams. Food Chem. 1981;7:273–288. doi: 10.1016/0308-8146(81)90033-9. [DOI] [Google Scholar]
- Ma W, Wang T, Wang J, et al. Enhancing the thermal stability of soy proteins by preheat treatment at lower protein concentration. Food Chem. 2020;306:125593. doi: 10.1016/j.foodchem.2019.125593. [DOI] [PubMed] [Google Scholar]
- Malvern Instruments (2001) Dynamic light scattering; an introduction in 30 min technical note. www.malvern.co.uk.
- Martínez KD, Pilosof AM. Relative viscoelasticity of soy protein hydrolysate and polysaccharides mixtures at cooling conditions analyzed by response surface methodology. Food hydrocoll. 2012;26(1):318–322. doi: 10.1016/j.foodhyd.2011.04.019. [DOI] [Google Scholar]
- Martínez KD, Pilosof AM. Rheology and thermal transitions of enzymatically modified soy protein and polysaccharides mixtures, of potential use as foaming agent determined by response surface methodology. Food Biosci. 2013;3:19–28. doi: 10.1016/j.fbio.2013.04.008. [DOI] [Google Scholar]
- Martínez KD, Sanchez CC, Ruíz-Henestrosa VP, et al. Effect of limited hydrolysis of soy protein on the interactions with polysaccharides at the air–water interface. Food Hydrocoll. 2007;21(5–6):813–822. doi: 10.1016/j.foodhyd.2006.09.008. [DOI] [Google Scholar]
- Martínez KD, Carrera Sánchez C, Rodríguez Patino JM, et al. Interfacial and foaming properties of soy protein and their hydrolysates. Food Hydrocoll. 2009;23(8):2149–2157. doi: 10.1016/j.foodhyd.2009.03.015. [DOI] [Google Scholar]
- McClements DJ. Advances in the application of ultrasound in food analysis and processing. Trends Food Sci Technol. 1995;6(9):293–299. doi: 10.1016/S0924-2244(00)89139-6. [DOI] [Google Scholar]
- Morales R, Martínez KD, Pizones Ruiz-Henestrosa VM, et al. Modification of foaming properties of soy protein isolate by high ultrasound intensity: particle size effect. Ultrason Sonochem. 2015;26:48–55. doi: 10.1016/j.ultsonch.2015.01.011. [DOI] [PubMed] [Google Scholar]
- Neergaard MS, Kalonia DS, Parshad, , et al. Viscosity of high concentration protein formulations of monoclonal antibodies of the IgG1 and IgG4 subclass–Prediction of viscosity through protein–protein interaction measurements. Eur J Pharm Sci. 2013;49(3):400–410. doi: 10.1016/j.ejps.2013.04.019. [DOI] [PubMed] [Google Scholar]
- Ochnio M, Martínez J, Allievi M, et al. Proteins as nano-carriers for bioactive compounds. The case of 7S and 11S soy globulins and folic acid complexation. Polymers. 2018;10(2):149. doi: 10.3390/polym10020149. [DOI] [PMC free article] [PubMed] [Google Scholar]
- Sağlam D, Venema P, de Vries R, et al. Concentrated whey protein particle dispersions: heat stability and rheological properties. Food Hydrocoll. 2013;30(1):100–109. doi: 10.1016/j.foodhyd.2012.05.005. [DOI] [Google Scholar]
- Shanmugam A, Chandrapala J, Ashokkumar M. The effect of ultrasound on the physical and functional properties of skim milk. Innov Food Sci Emerg Technol. 2012;16:251–258. doi: 10.1016/j.ifset.2012.06.005. [DOI] [Google Scholar]
- Tan MC, Chin NL, Yusof YA, et al. Characterisation of improved foam aeration and rheological properties of ultrasonically treated whey protein suspension. Int Dairy J. 2015;43:7–14. doi: 10.1016/j.idairyj.2014.09.013. [DOI] [Google Scholar]
- Vanapalli S, Coupland JN. Characterization of food colloids by phase analysis light scattering. Food Hydrocoll. 2000;14(4):315–317. doi: 10.1016/S0268-005X(00)00006-0. [DOI] [Google Scholar]
- Villamiel M, Jong P. Influence of high-intensity ultrasound and heat treatment in continuous flow on fat proteins, and native enzymes of milk. J Agric Food Chem. 2000;48:472–478. doi: 10.1021/jf990181s. [DOI] [PubMed] [Google Scholar]
- Wang J, Na X, Navicha WB, et al. Concentration-dependent improvement of gelling ability of soy proteins by preheating or ultrasound treatment. LWT. 2020;134:110170. doi: 10.1016/j.lwt.2020.110170. [DOI] [Google Scholar]
- Weiss J, Kristbergsson K, Kjartansson GT. Engineering food ingredients with high-intensity ultrasound. In: Feng H, Barbosa-Cánovas GV, Weiss J, editors. Ultrasound technologies for food and bioprocessing. New York: Springer Science+Business Media; 2011. pp. 239–285. [Google Scholar]
- Woldeyes MA, Qi W, Razinkov VI, et al. How well do low-and high-concentration protein interactions predict solution viscosities of monoclonal antibodies? J Pharm Sci. 2019;108(1):142–154. doi: 10.1016/j.xphs.2018.07.007. [DOI] [PubMed] [Google Scholar]
Associated Data
This section collects any data citations, data availability statements, or supplementary materials included in this article.