

Abstract
Abstract
The widely used methodology to quantify polyphenols—the Folin-Ciocalteu (FC) method—cannot be applied indiscriminately since different matrices may impair the assay’s accuracy. Thus, this study aimed to adapt the FC method for the açaí seed extract, a tannin-rich extract with potential applications for various therapies. Firstly, a pre-method standardization was established to determine parameters such as reading wavelength (765 nm), reaction time (30 min), and the reference substance (pyrogallol). In the validation step, the adapted method responded linearly to the analyte (R2 = 0.9910), ensuring its selectivity (linearity and selectivity curves statistically parallel) and accuracy (99.18–101.43%). Furthermore, the method proved to be precise (RSD ≤ 2.63%) at the two levels assessed (repeatability and intermediate precision) and robust (RSD ≤ 4.45%) concerning variation on the Na2CO3 concentration and the reaction time. The limits of detection and quantification were also calculated (9.9 µg/mL and 33.1 µg/mL, respectively). An additional step for tannins quantification based on its reported selective precipitation by complexing agents was also evaluated; however, unspecific precipitation was observed, reducing the results’ accuracy. Our work successfully adapted and validated a method for total phenolics quantification of açaí seed extract, resulting in 38 g of pyrogallol equivalent/100 g of extract.
Graphic abstract

Keywords: Euterpe oleracea, Açaí seeds, Total polyphenols, Tannins, Folin-Ciocalteu method, Method validation
Introduction
Polyphenols are secondary metabolites widely distributed in the plant kingdom, divided into several classes, i.e., phenolic acids, flavonoids (flavonols, flavones, flavanols, flavanones, isoflavones, proanthocyanidins), stilbenes, and lignans (Pandey and Rizvi 2009). This group of molecules is industrially applied as natural colorants, preservatives, and natural sources of antioxidants, which avert oxidative stress-related diseases (Gülçin 2012).
When it comes to quantification of these substances, the choice of the methodology is very significant. Within each polyphenols group, there are hundreds to thousands of structurally distinct compounds, and several of them are unavailable as analytical standards for quantification by traditional methods, such as HPLC-DAD or GC-FID. Therefore, simple UV-VIS spectrophotometric analyses of colorimetric reactions are often used to monitor the total polyphenols (TP) content in plant extracts since they are quicker and easier to perform, besides their low cost (Blainski et al. 2013).
Created in 1927 by Otto Folin and Vintila Ciocalteu to quantify tyrosine and tryptophan in proteins (Folin and Ciocalteu 1927), the Folin-Ciocalteu (FC) method has been widely reported in the literature as a standard protocol for TP quantification in plant tissues and food from plant origin (Wootton-Beard et al. 2011; Chen et al. 2014; Musci and Yao 2017). In this assay, the FC reagent (a mixture of phosphotungstic and phosphomolybdic acids) is reduced, in alkaline medium, to blue tungsten and molybdenum oxides, which display light absorption around 760 nm (Ainsworth and Gillespie 2007). Gallic acid is the most common reference molecule used to express the results into quantitative data, usually displayed in gallic acid equivalents (GAE) per unit sample. This method can also be classified as an electron transfer based assay, as it measures the reduction capacity of a substance against an oxidant agent, which changes color when reduced. This category includes Trolox equivalent antioxidant capacity (TEAC), 2,2-diphenyl-1-picrylhydrazyl (DPPH), ferric reducing antioxidant power (FRAP), and many others (Cömert and Gökmen 2018).
The original FC assay and its adaptation from Singleton and Rossi (1965) are the most reported TP quantification methodologies. As this reaction’s exact chemical nature is still unknown, many modifications can be found in the literature. The most common alterations are related to the assay volume (solutions of µL up to 100 mL) or FC reagent amount (200 µL up to 2 mL per sample), the order of addition of the reagents, the sodium carbonate concentration (7.5 up to 29%), the reading wavelength (from 615 up to 765 nm), the analytical standard reference for quantification (usually gallic acid, but also pyrogallol, catechin, chlorogenic acid, to name a few), and the reaction time (30–120 min) (Waterhouse 2003; Cicco et al. 2009; Sánchez-Rangel et al. 2013; Berker et al. 2013; Blainski et al. 2013; Musci and Yao 2017). Moreover, some authors point out that this methodology is highly dependent on each matrix’s composition, which can differ regarding the content of phenolic types and amounts of specific compounds (Appel et al. 2001; Sánchez-Rangel et al. 2013). In addition to that, some compounds in the analyzed sample, such as ascorbic acid or reducing sugars, may hamper the accuracy of FC assay (Ainsworth and Gillespie 2007; Sánchez-Rangel et al. 2013). Furthermore, gallic acid may not be a reference compound that best represents the sample’s absorption profile under analysis, although its use has been reported in most works since it is easily found in high purity, stable, and as an inexpensive substance (Singleton and Rossi 1965). Pyrogallol, a commercially available water-soluble solid, has been used as an alternative with a higher specific absorptivity, giving a more accurate TP content (Bueno et al. 2012; Blainski et al. 2013; DiCiaula et al. 2014). Thus, developing validated methods for specific samples, instead of using a general one, is of utmost importance to obtain accurate and reliable results.
In this context, this study aimed to develop and validate a specific analytical procedure to determine TP content in condensed tannins-rich crude extracts from açaí (Euterpe oleracea) seeds and to evaluate a methodology for tannins selective precipitation by complexing agents and its quantification. These non-edible seeds account for 85–95% of the fruit weight, representing an enormous amount of residue estimated at ~ 1.3 million tons accumulating yearly in the Amazon region (Pompeu et al. 2009; Monteiro et al. 2019). This extract has already been reported as containing critical biological activities, including antihypertensive, antidiabetic, and antinociceptive effects, to mention a few (Cordeiro et al. 2015; Sudo et al. 2015; de Bem et al. 2018). Additionally, previous studies that engaged in the characterization of those reported that polyphenols from the class of condensed tannins are the predominant compounds of açaí seed extracts (Melo et al. 2016; Martins et al. 2020). The total tannin content can be estimated by the FC method by calculating the difference between the sample absorbance before and after the condensed tannin precipitation using a complexing agent (skin powder, casein, polyvinylpyrrolidone). As there is a tiny number of commercially available standards for this type of polyphenols, a reliable and validated methodology of the FC method for quantification of extracts rich in condensed tannins is of utmost importance.
Materials and methods
Standards, chemicals, and açaí seed samples
Analytical grade methanol and anhydrous Na2CO3 used were from TEDIA (Rio de Janeiro, Brazil) and Merck KGaA (Darmstadt, Germany). Folin-Ciocalteu reagent, casein, polyvinylpolypyrrolidone (PVPP), (+)-catechin hydrate, gallic acid, tannic acid, and pyrogallol were purchased from Sigma-Aldrich (St. Louis, MO, USA). The açaí seed samples were donated by Açaí Amazonas Ltd (Óbidos, Pará, Brazil). Distilled water was used in all assays, which were carried out at room temperature in the presence of light.
Sample preparation and extraction procedures
E. oleracea seeds were ground in a knife mill through a 2-mm screen (Universal cutting mill PULVERISETTE 19®, Fritsch, Idar-Oberstein, Germany). Samples (1.00 g) were extracted in triplicate following a published protocol with MeOH (1:10 w/v), for 1 h, at 40 °C under orbital agitation at 120 rpm (Martins et al. 2020). The extract was vacuum filtered, and the solvent evaporated in a rotavapor under reduced pressure. The crude extract was stocked in a dry state at -20 °C and resuspended in distilled water before use.
Pre-method standardization for determination of total polyphenols (TP)
A pre-method standardization was performed to evaluate the FC assay’s parameters as reaction time, wavelength, and the reference substance for the calibration curve. All UV-Vis analysis occurred in a Thermo Scientific Evolution 201 Spectrophotometer. First, 50 µg/mL solutions of gallic acid, pyrogallol, catechin, tannic acid, and 150 µg/mL of E. oleracea crude extract solution were prepared. In triplicate, 400 μL of each sample was mixed with 2 mL of distilled water, 200 μL of FC reagent, and 2.4 mL of 10.75% (w/v) anhydrous sodium carbonate in test tubes (12 mL). The tubes were vortexed for 10 s, and, after 30 min, the maximum absorption wavelength was chosen from 400 to 800 nm scanning spectra. The reaction time was evaluated in triplicate by kinetic curves for the selected standard (35 µg/mL) and E. oleracea crude extract (100 µg/mL) in 1, 2, 3, 5, 8, 10, 12, 15, 20, 30, 40, 50 and 60 min.
Analytical method validation
The guidelines established by the ICH (International Conference on the Harmonization of Technical Requirements for the Registration of Pharmaceuticals for Human Use) and by the RE Nº 899/2003 from the National Health Surveillance Agency (ANVISA) of Brazil were employed for validation of the methodology developed.
Calibration curve of selected standard
Stock solutions (1 mg/mL) were prepared in triplicate. Aliquots were diluted for the final concentrations of 25, 35, 50, 60, 75, 100, 125, 150 μg/mL, and a calibration curve was determined, selecting five points out of the mentioned range.
E. oleracea seed methanolic extracts solutions for linearity determination
The stock solutions (1 mg/mL) were prepared, in triplicate, using a methanolic extract from E. oleracea seeds. Aliquots were diluted for the final concentrations of 25, 50, 75, 100, 125, 150, 175, 200, 250 and 500 μg/mL. After reading the 10 concentration points’ absorbance, the five points closest to the maximum absorption between 0.4 and 0.8 A.U were chosen.
Selectivity
Selectivity was determined by a statistical comparison between the slopes of the linearity and selectivity curves, which were obtained after adding the selected standard to a final concentration of 15 μg/mL to the linearity curve of crude extract. Analysis of variance (ANOVA) was used to assess the linearity and the selectivity.
Limits of detection and quantification
The limits of detection (LOD) and quantification (LOQ) were calculated based on the resolution nº 899/2003 from ANVISA, a Brazilian regulatory institution. Those parameters were stipulated for the calibration curve of the selected standard, for the linearity and selectivity of the extract, according to Eqs. (1) and (2).
| 1 |
| 2 |
where “S” is the standard deviation of the y-intercept, and “I” is the mean of the angular coefficients obtained for the analytical curves.
Precision
The precision of the method was evaluated in sextuplicate. A sample of açaí seed extract (150 μg/mL) was assessed by repeatability (intra-day) and intermediate precision (inter-day), considering the standard deviation and the relative standard deviation (RSD) of six repetitions. The absorbance values were converted to the percentage of phenolics in the extract (%) and an RSD over 5% was considered unacceptable.
Accuracy
A recovery test was performed to assess the method’s accuracy by adding the selected standard at three different concentrations (low, medium, and high) to the E. oleracea extract. In this assay, 150 μg/mL solutions of E. oleracea seed extract were prepared and solutions of the selected reference substance were prepared in triplicate at 15, 30, and 60 μg/mL. The recovery was calculated using Eq. (3).
| 3 |
where: C1 is the experimental concentration of the mixture, C2 and C3 are the theoretical concentrations of the sample and the reference compound, respectively.
Robustness
The solution’s stability was assessed in three levels: pH, by using 14.05 and 7.5% (w/v) of anhydrous sodium carbonate; and time, by using 45 min as reaction time.
Statistical analyses
The statistical analyses were performed using Prism® 7.00 software (GraphPad Software, Inc). Results were expressed as mean ± SD [RSD (%)] and analyzed using ANOVA. Linear and residual analyses were carried out by simple linear regression, and any R2 < 0.99 was considered unacceptable.
Total tannins quantification using complexing agents
To determine the influence of complexing agents in the total tannin content, first, different amounts of PVPP and casein (1, 2, 4, 6, 8, and 10% w/v) were added to açaí seeds extract (1 mg/mL of dry methanolic extracts resuspended in distilled water). So, 2.0 mL of extract solution was added to the complexing agent in a 15 mL Erlenmeyer and subjected to agitation (in an orbital shaker) for 60 min at 200 rpm at 25 °C. Distilled water was used as a blank solution. After, the sample was centrifuged at 5000 rpm for 5 min. The supernatant was analyzed by the FC method and HPLC. The HPLC conditions used were described by Martins et al. 2020. All analyses used a Symmetry C18 column (250 × 4.6 mm, 5 µm, Waters, Ireland) with a protection column of the same material. The samples were filtered with a 0.45 μm microfilter. The oven temperature was 30° C, flow 1.0 mL/min, injection volume was 20 μL (1 mg/mL) and λ = 280 nm. The mobile phase used was: A-ultrapure water with 0.1% (v/v) formic acid and B-82% acetonitrile with 18% solvent A. The elution profile was 0% to 15% B in 15 min, 15% to 16% B in 25 min, 16% to 17% B in 5 min, 17% to 43% B in 3 min, 43% to 52% B in 1 min, 52% B in 7 min, 52% to 43% B in 1 min, 43% to 17% B in 1 min, 17% to 0% B in 2 min. Catechin (0–100 mg/L) was used as an internal standard.
Results
Pre-method standardization
Previous publications have systematically shown that an appropriate working absorbance range in the spectrophotometer analysis for the TP quantification by the FC method would be between 0.4 and 0.8 A.U. Also, it has been reported that the assay is robust enough to withstand light, making amber glassware unnecessary and that 10.75% (w/v) anhydrous sodium carbonate is the minimal concentration sufficient to guarantee a pH equal to 11 for the reaction (Verza et al. 2007; Bueno et al. 2012; Blainski et al. 2013; Galvão et al. 2018). However, other basic parameters are reported with significant divergence in literature, such as the reaction time (30-120 min), the adequate wavelength for the analysis (615–765 nm), and the chosen reference compound for quantification (gallic acid, catechin, tannic acid, and pyrogallol), as those parameters should be customized for a given sample. Thus, our study evaluated these variables in the pre-method standardization.
As the wavelengths of 690, 715, 760, 765, and 800 nm are the most reported for the FC assay, we initially evaluated the assay response at those wavelengths in a fixed reaction time of 30 min. The reference substances concentration was set in 50 µg/mL and the crude extract concentration was settled in 150 µg/mL, which provides absorbance in the range (0.4–0.8 A.U.) of the standards for comparison. The analyzed compounds showed a similar absorbance profile, displayed in Fig. 1a, with a maximum value between 760 and 765 nm and a decrease after that—except for the gallic acid profile, which dropped at 715 nm before reaching maximum absorption at 765 nm. Therefore, 765 nm was chosen as the absorption wavelength for the analytical method validation.
Fig. 1.

a Absorption profile of reference compounds (50 µg/mL) and E. oleracea crude extract (150 µg/mL) in 690, 715, 760, 765, and 800 nm and 30 min reaction time, and b effect of the reaction time on FC assay response when using pyrogallol (35 µg/mL) and E. oleracea crude extract (100 µg/mL) as samples
FC assay shows a quantitative proportional response to the phenolic groups, hence by the Lambert-Beer Law it is possible to determine the more appropriate reference substance by its ability to absorb light as expressed in specific absorptivity in Table 1. Pyrogallol, catechin, and tannic acid had similar profiles to the E. oleracea crude extract, as shown in Fig. 1a. However, out of the standards tested, pyrogallol had the highest specific absorptivity, resulting in a reduced error and increased reliability. Therefore, we selected pyrogallol as the reference compound to continue the study.
Table 1.
Comparison of specific absorptivities of the reference compounds evaluated as analytical standards and TP content of E. oleracea crude extract calculated based on each standard curve
| Compound | Specific absorptivity (A1 %) | TP in E.oleracea crude extract (%) |
|---|---|---|
| Tannic acid | 75.2 | 47.3 |
| Catechin | 80.4 | 47.7 |
| Gallic acid | 96.2 | 46.8 |
| Pyrogallol | 122.6 | 38.4 |
After determining the wavelength and the reference compound to be used as an analytical standard, the reaction time effect on the assay response was evaluated for 60 min. Since concentration affects the reaction rate, both samples (pyrogallol and crude extract) were diluted enough to provide absorbance values in the lower range of the working spectrum (~ 0.4 A.U.), where the reaction kinetics is slower. So, as shown in Fig. 1b, pyrogallol (35 µg/mL) and E. oleracea crude extract (100 µg/mL) exhibited the same profile, reaching an absorbance plateau between 20 and 30 min. Therefore, 30 min was the reaction time chosen for the validation step.
After this pre-method standardization step for the FC assay, all other experiments were performed by (1) setting the wavelength at 765 nm for analysis; (2) using pyrogallol as the reference compound to be used as the analytical standard for TP quantification; and (3) setting the reaction time in 30 min.
Analytical method validation
Pyrogallol calibration curve and linearity of E. oleracea crude extract
The calibration equation obtained for pyrogallol presented a linear response for the analyzed concentration range with RSD lower than 1.5% for all points (Fig. 3a). Also, the coefficient of determination “R2” (> 0.99) satisfies the requirement of RE nº899, which stipulates that the R2 has to be greater than 0.99.
Fig. 3.
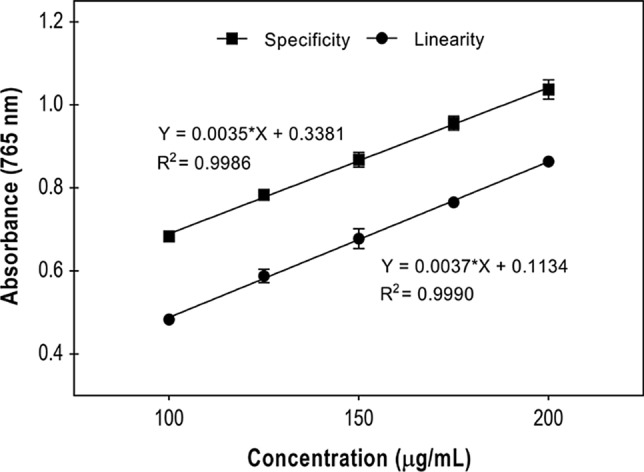
Comparison between analytical curves of linearity (curve of E. oleracea seed extract) and selectivity (E. oleracea seed extract+pyrogallol 15 μg/mL)
Linearity is the characteristic of an analytical methodology to demonstrate that the results obtained are directly proportional to the analyte concentration in the sample within a specified range. Thus, to determine the linearity, aliquots of the stock solution (1 mg/mL of E. oleracea crude extract) were diluted to the final concentrations of 25, 50, 75, 100, 125, 150, 175, 200, 250, and 500 μg/mL. The linearity curve, shown in Fig. 2b, was plotted with five consecutive concentration points (100, 125, 150, 175, and 200 μg/mL) chosen for resulting in an absorption range between 0.4 and 0.8 A.U. The value of R2 (0.9910) assures the linearity of the adapted method for the evaluated range of concentrations.
Fig. 2.

a Calibration curve obtained with the pyrogallol standard for the analysis of TP and b linearity curve of E. oleracea seed extract
Selectivity, limits of detection (LOD) and quantification (LOQ)
Selectivity is the method’s ability to measure a specific compound in the presence of other substances such as impurities, degradation products, and matrix components. Since plant extracts have a complex matrix, hindering the separation of analytes from the crude matrix, its effects can be tested by comparing the linearity and selectivity curves. If they are parallel, the method can be affirmed as selective (Bueno et al. 2012; Blainski et al. 2013; Galvão et al. 2018). Figure 3 shows both curves.
ANOVA performed on the analytical curves (linearity and selectivity) revealed that the curves’ slopes are statistically equal (about 3.3% of difference), ensuring statistical significance and the method’s selectivity.
The limit of detection (LOD) is the smallest amount of the analyte present in a sample that can be detected but not necessarily quantified under the established experimental conditions. On the other hand, the limit of quantification (LOQ) is the sample’s minimal concentration determined with acceptable precision and accuracy. Both of them were calculated based on the analytical curves obtained using Eqs. (1) and (2), as shown in Table 2.
Table 2.
Regression analysis, LOD, and LOQ of calibration, selectivity, and linearity curves
| Regression analysis | Calibration curve | Selectivity curve | Linearity curve |
|---|---|---|---|
| R2 | 0.9987 | 0.9986 | 0.9910 |
| Inclination | 0.0112 ± 0.0002 | 0.0035 ± 7.5 × 10⁻⁵ | 0.0036 ± 0.0002 |
| Intersection | 0.0378 ± 0.0155 | 0.3381 ± 0.0116 | 0.1265 ± 0.0308 |
| CLa Inclination | 0.0104 to 0.0119 | 0.0033 to 0.0038 | 0.0030 to 0.0042 |
| CL Intersection | − 0.0117 to 0.0872 | 0.3012 to 0.3751 | 0.0284 to 0.2245 |
| LOD in μg/mL (ABSb) | 1.06 (0.050) | 21.97 (0.415) | 9.93 (0.163) |
| LOQ in μg/mL (ABS) | 3.53 (0.077) | 73.25 (0.596) | 33.09 (0.247) |
| Fcritical (Fvalue) | 1.9 × 10⁻⁵ (2377) | 2.2 × 10⁻⁵ (2183) | 3.6 × 10⁻⁴ (331.1) |
aCL = Confidence Level; bABS = Absorbance
The analyses of the curves obtained for pyrogallol (y = 0.0112x + 0.0378, R = 0.9993), selectivity (y = 0.003517x + 0.3381, R = 0.9993) and linearity (y = 0.003637x + 0.1265, R = 0.9955) show that the developed method is linear in the tested concentrations, in addition to having an appropriate correlation coefficient (R ≥ 0.99), as determined by ANVISA RE nº 899.
Precision
Precision evaluates the proximity of the results obtained in a series of measurements from multiple sampling of the same sample. This parameter was assessed at two levels: repeatability (intra-day) and intermediate precision (inter-day). The results, expressed in percentage of phenolics in the extract (± SD [RSD(%)]), were 38.75 ± 0.96 [2.48] and 37.99 ± 0.99 [2.58] for repeatability and intermediate precision, respectively. These values were tested and found statistically equal since the obtained F value (1.95) is lower than the F critical (4.96).
Accuracy
An analytical method’s accuracy can be understood as the proximity between the value obtained and the one accepted as true. A methodology is considered accurate if the recovery percentages are between 85% and 115%, according to ANVISA RE nº 899. Our recovery results varied from 98.18 to 101.43%, with an RSD below 1.89, showing that the adapted method is accurate for determining TP in E. oleracea seed extract.
Robustness
The robustness of an analytical method is the measurement of its ability to withstand small and deliberate variations in analytical parameters and indicates how reliable it is during regular use. In this study, the robustness test, evaluated at three different levels, showed very similar TP percentages in the extract (± SD [RSD(%)]), with an RSD under 5%, as shown in Table 3.
Table 3.
Evaluation of the robustness for FC assay at three different levels of variations: Na2CO3 concentrations of 7.5% and 14.05% (w/v) and 45-min reaction time
| Levels | Conditions | TP content (%) |
|---|---|---|
| Standard method | 30 min, Na2CO3 10.75% (w/v) | 38.39 ± 1.46 [3.81] |
| Na2CO3 7.50% (w/v) | 30 min, Na2CO3 7.5% (w/v) | 38.94 ± 0.16 [0.42] |
| Na2CO3 14.05% (w/v) | 30 min, Na2CO3 14.05% (w/v) | 38.98 ± 1.73 [4.45] |
| 45-min Reaction time | 45 min, Na2CO3 10.75% (w/v) | 39.34 ± 0.94 [2.41] |
The evaluated concentrations of anhydrous sodium carbonate for the analysis of robustness were 7.5%, 10.75%, and 14.05%, based on previous publications (Verza et al. 2007; Bueno et al. 2012; Blainski et al. 2013; Galvão et al. 2018). The final solutions presented a pH of ≥ 10.0 for all three levels, ensuring sodium carbonate’s catalytic role.
Also, the extended reaction time did not significantly affect the outcome, which gives the analyst at least 15 more minutes to take the absorbance readings on the spectrophotometer and still obtain reliable results. The TP content in açaí seeds methanolic extract was 38.4 ± 0.4 [1.1] g/100 g of extract (in pyrogallol equivalents), a value within the range of 28–61 g (in gallic acid equivalent)/100 g of extract for E. oleracea seed extract, accounted by Folin-Ciocalteu assay, reported by previous studies (Silva et al. 2014; Soares et al. 2017). The adapted method succeeded in all figures of merit assessed during the validation process, which ensures its reliability and reproducibility for analyzing this specific extract.
Total tannins quantification by complexing agents
The FC method can also be applied to determine the total tannins content by calculating the reduction in TP concentration after adding a precipitating agent (usually skin powder) and measuring the non-adsorbed supernatant. However, the behavior observed using skin powder strongly suggests a lack of specificity; thus, some recent publications used casein or polyvinylpyrrolidone (PVPP) instead (Verza et al. 2007; Galvão et al. 2018). Since the açaí seed extract is rich in condensed tannins, we evaluated whether an adapted method, associated with a precipitating agent (casein or PVPP), would provide a more specific quantification of the condensed tannins percentage. HPLC-DAD was used to monitor the assay, and both compounds were complexed with condensed tannin polymers. The FC assay results using casein suggest that tannin polymers were equivalent to 92.1% (w/w pyrogallol equivalent/g of extract) of the TP content in the açaí crude extract. On the other hand, we also observed a decline in catechin concentration (about 82%), used as an internal standard to analyze the precipitation agent specificity. This result indicated that polymers and monomeric units had unspecific precipitation with casein and PVPP, impairing total tannins content’s accurate determination.
Discussion
The FC method is based on an oxidation-reduction reaction in alkaline conditions, where the phenolate ion is oxidized while the FC reagent is reduced, producing the blue color. Although the FC assay is considered an antioxidant method, it is still widely used for TP quantification in plant extracts due to its advantages over other colorimetric methods. It is reproducible, with a wavelength absorption in a small interference region with samples’ matrices (> 700 nm), and uses commercially available reagents. Besides that, the adaptation obtained in this work also had improvements in cost and environmental aspects compared to previously published protocols (Verza et al. 2007; Bueno et al. 2012; Blainski et al. 2013; de Oliveira et al. 2015; Soares et al. 2017; Galvão et al. 2018). During the method development, concerns such as sodium carbonate and FC reagent concentrations, assay volume, and amber glass usage were evaluated to produce less waste and generate lower reagent and material cost without jeopardizing the reliability of the experiment. Taking FC reagent volume as an example, the previous publications used up to 1.0 mL of FC reagent per replicate, while we were able to obtain linear results up to 1.5 A.U. in absorbance using only 200 µL.
Another critical factor in this reaction is the alcohol concentration in the final mixture. The presence of methanol reduces inorganic salts’ solubility, decreasing the ions’ solvation and dissociation of salts (Cicco et al. 2009). Therefore, sodium carbonate may precipitate and affect the reproducibility of the FC assay. Although our study used a methanol-free extract, one may want to skip the drying and water resuspension steps and directly use the methanolic extract for measurement. For this reason, the sample’s dilution factor becomes an important parameter to be verified. Previous studies focused on the dilution factor of hydroalcoholic extracts to avoid the carbonate precipitation, finding that 1–6% of methanol in the final solution is compatible with the assay, not causing precipitate formation (Cicco et al. 2009; Cicco and Lattanzio 2011). Thus, in this methodology, considering that the sample represents 8% of the final volume, it might be necessary to dilute an alcoholic extract to ensure that the assay’s final alcohol concentration is below 6%.
A high R2 is used as evidence in standard and sample curves to secure a method’s performance and provide consistent quantifications of a sample, relating the absorbance to a concentration of a known standard. Determining a reference standard is a decisive stage of the process as it directly impacts quantitative results. Since the report of Singleton and Rossi (1965), analytical standard selection has been associated with its molar or specific absorptivity, which was associated with their different structures instead of how strongly a chemical species absorbs light at a given wavelength, resulting in the use of a reference standard curve that does not reflect sample concentrations. In this study, the reference compounds analyzed have different structures, and pyrogallol presented the highest specific absorptivity and also showed reaction kinetics similar to E. oleracea crude extract, so it was considered the most appropriate reference amongst the evaluated substances. However, most articles report their results in gallic acid equivalents (GAE) without evaluating the adequacy of the results for their samples. As we have shown, different standards result in different TP values, so the indiscriminate use of gallic acid as a reference for extracts from different sources provides an inaccurate value of their TP content.
Plant extracts have different content of phenolic compounds. Depending on the composition, the sample’s response to the FC method will not be the same. Besides that, FC reagent displays low specificity because it also detects extractable proteins (tyrosine and tryptophan quantification)—the method’s original purpose—and other interfering compounds such as ascorbic acid and reducing polysaccharides. All of it justifies approaches like validation to improve the method’s specificity.
As already mentioned, the TP content of E. oleracea seed extract has been evaluated by previous publications. However, none of those studies validated the methodology for this specific extract. A range from 26.5 g/100 g up to 61.6 ± 0.8 g/100 g of extract has been reported in gallic acid equivalents (Silva et al. 2014; Melo et al. 2016; Soares et al. 2017; Martinez et al. 2018). This divergence in the results can be explained by the different solvents and methodologies used in the extraction process, directly influencing the concentration of polyphenols obtained. However, the FC assay limitations discussed above could also be primarily responsible for the discrepancy between the results, reiterating the validation step’s importance before the actual quantification.
The validated method has been assessed and approved in terms of linearity, selectivity, limits of detection and quantification, precision, accuracy, and robustness according to the ICH guidelines and by ANVISA’s RE Nº 899/2003. Its application provides more reliable results, being a potential tool in optimization procedures, further activity studies, promoting advancements with technological implications. Nevertheless, since condensed tannins are the primary polyphenols in açaí seed extract, a more selective method that uses particular structural properties of this class of compounds should be used for this analysis. There are a plethora of analytical techniques to determine total tannin concentration, like the precipitation-based ones—that exploits the ability of tannin to complex and precipitate with polysaccharides and proteins—and the reaction-based ones, like the acid butanol assay, the dimethylaminocinnamaldehyde (DMACA) assay, and the vanillin assay. Therefore, it would be essential to address a more specific tannin quantification method in future works.
Conclusion
Açaí is the principal commercial crop of the Brazilian Amazon region. Its production has a growing demand, which results in the accumulation of more than 1 million tons of seeds. In this work, the determination of the TP content of E. oleracea (açaí) seeds extract was carried out after developing and validating the proposed methodology, which was adapted for the condensed tannin-rich extract. Also, the adjusted method successfully fulfilled the validation requirements determined by the RE Nº 899 ANVISA. Applying a validated methodology with a suitable reference substance (pyrogallol) provides more reliable results, closer to the sample’s chemical characteristics. Besides that, an appropriate quantification method is also a potential tool in optimization procedures and further activity studies. Those advancements in chemical analyses increase data reliability that helps draw attention to this residue’s value and its practical utilization, boosting the potential, opportunities, and challenges related to territorial development.
Acknowledgements
This work was financed by the Serrapilheira Institute (Serra-1708-15009) and the Coordination for the Improvement of Higher Education Personnel (CAPES-AUXPE 0415/2016). The Brazilian National Council for Technological Development (CNPq) is thanked for granting scholarships for Dr. Gabriel R. Martins (PCI/INT/MCTI), and Mr. Felipe R. L. do Amaral (PIBITI/INT/CNPq). Açaí Amazonas Ltd. is thanked for providing açaí seeds. The authors thank Mr. Ronaldo Rodrigues de Sousa for designing the graphical abstract. Mr. Alvaro F. Monteiro and Dr. Gabriel R. Martins thank the Serrapilheira Institute for their granted internship and current scholarship, respectively.
Authors’ contributions
GRM conceived and supervised the experimental analysis, interpret the data and draft the manuscript. AFM and FRLA were responsible for the formal analysis, collected the experimental data, and drafted the manuscript. ASS acquired funds, supervised all experiments in the study, drafted and edited the manuscript. All authors reviewed and approved the manuscript.
Compliance with ethical standards
Conflicts of interest
The authors declare having no conflict or competing interests.
Ethical standards
Not applicable.
Footnotes
Publisher's Note
Springer Nature remains neutral with regard to jurisdictional claims in published maps and institutional affiliations.
Contributor Information
Gabriel Rocha Martins, Email: gabriel.rocha@int.gov.br.
Alvaro Ferreira Monteiro, Email: alvaro.ferreira@int.gov.br.
Felipe Rafael Lopes do Amaral, Email: felipe.amaral@int.gov.br.
Ayla Sant’Ana da Silva, Email: ayla.santana@int.gov.br.
References
- Ainsworth EA, Gillespie KM. Estimation of total phenolic content and other oxidation substrates in plant tissues using Folin-Ciocalteu reagent. Nat Protoc. 2007;2:875–877. doi: 10.1038/nprot.2007.102. [DOI] [PubMed] [Google Scholar]
- Appel HM, Govenor HL, D’ascenzo M, et al. Limitations of Folin assays of foliar phenolics in ecological studies. J Chem Ecol. 2001;27:761–778. doi: 10.1023/A:1010306103643. [DOI] [PubMed] [Google Scholar]
- Berker KI, Ozdemir Olgun FA, Ozyurt D, et al. Modified folin-ciocalteu antioxidant capacity assay for measuring lipophilic antioxidants. J Agric Food Chem. 2013;61:4783–4791. doi: 10.1021/jf400249k. [DOI] [PubMed] [Google Scholar]
- Blainski A, Lopes G, de Mello J. Application and analysis of the folin ciocalteu method for the determination of the total phenolic content from Limonium Brasiliense L. Molecules. 2013;18:6852–6865. doi: 10.3390/molecules18066852. [DOI] [PMC free article] [PubMed] [Google Scholar]
- Bueno FG, Machareth MAD, Panizzon GP, et al. Development of a UV/Vis spectrophotometric method for analysis of total polyphenols from Caesalpinia peltophoroides Benth. Quim Nova. 2012;35:822–826. doi: 10.1590/S0100-40422012000400031. [DOI] [Google Scholar]
- Chen GL, Chen SG, Zhao YY, et al. Total phenolic contents of 33 fruits and their antioxidant capacities before and after in vitro digestion. Ind Crops Prod. 2014;57:150–157. doi: 10.1016/j.indcrop.2014.03.018. [DOI] [Google Scholar]
- Cicco N, Lattanzio V. The influence of initial carbonate concentration on the Folin-Ciocalteu micro-method for the determination of phenolics with low concentration in the presence of methanol: a comparative study of real-time monitored reactions. Am J Anal Chem. 2011;2:840–848. doi: 10.4236/ajac.2011.27096. [DOI] [Google Scholar]
- Cicco N, Lanorte MT, Paraggio M, et al. A reproducible, rapid and inexpensive Folin-Ciocalteu micro-method in determining phenolics of plant methanol extracts. Microchem J. 2009;91:107–110. doi: 10.1016/j.microc.2008.08.011. [DOI] [Google Scholar]
- Cömert ED, Gökmen V. Evolution of food antioxidants as a core topic of food science for a century. Food Res Int. 2018;105:76–93. doi: 10.1016/j.foodres.2017.10.056. [DOI] [PubMed] [Google Scholar]
- Cordeiro VSC, Carvalho LCRM, De Bem GF, et al. Euterpe oleracea Mart. extract prevents vascular remodeling and endothelial dysfunction in spontaneously hypertensive rats. Int J Appl Res Nat Prod. 2015;8:6–16. [Google Scholar]
- de Bem GF, Costa CA, Santos IB, et al. Antidiabetic effect of Euterpe oleracea Mart (açaí) extract and exercise training on high-fat diet and streptozotocin-induced diabetic rats: a positive interaction. PLoS ONE. 2018;13:e0199207. doi: 10.1371/journal.pone.0199207. [DOI] [PMC free article] [PubMed] [Google Scholar]
- de Oliveira PRB, da Costa CA, de Bem GF, et al. Euterpe oleracea mart-derived polyphenols protect mice from diet-induced obesity and fatty liver by regulating hepatic lipogenesis and cholesterol excretion. PLoS ONE. 2015;10:e0143721. doi: 10.1371/journal.pone.0143721. [DOI] [PMC free article] [PubMed] [Google Scholar]
- DiCiaula MC, Lopes GC, Scarminio IS, De Mello JCP. Optimization of solvent mixtures for extraction from bark of schinus terebinthifolius by a statistical mixture-design technique and development of a uv-vis spectrophotometric method for analysis of total polyphenols in the extract. Quim Nova. 2014;37:158–163. doi: 10.1590/S0100-40422014000100026. [DOI] [Google Scholar]
- Folin O, Ciocalteau V. Tyrosine and tryptophane in proteins. J Biol Chem. 1927;73:627–648. doi: 10.1016/S0021-9258(18)84277-6. [DOI] [Google Scholar]
- Galvão MAM, de Arruda AO, Bezerra ICF, et al. Evaluation of the folin-ciocalteu method and quantification of total tannins in stem barks and pods from libidibia ferrea (Mart. ex Tul) L. P. Queiroz. Brazilian Arch Biol Technol. 2018 doi: 10.1590/1678-4324-2018170586. [DOI] [Google Scholar]
- Gülçin İ. Antioxidant activity of food constituents: an overview. Arch Toxicol. 2012;86:345–391. doi: 10.1007/s00204-011-0774-2. [DOI] [PubMed] [Google Scholar]
- Martinez RM, Guimarães DAB, Berniz CR, et al. Açai (Euterpe oleracea Mart.) seed extract induces cell cycle arrest and apoptosis in human lung carcinoma cells. Foods. 2018;7:1–9. doi: 10.3390/foods7110178. [DOI] [PMC free article] [PubMed] [Google Scholar]
- Martins GR, do Amaral FRL, Brum FL, et al. Chemical characterization, antioxidant and antimicrobial activities of açaí seed (Euterpe oleracea Mart) extracts containing A-and B-type procyanidins. LWT. 2020;109830:1. doi: 10.1016/j.lwt.2020.109830. [DOI] [Google Scholar]
- Melo PS, de Arrivetti L, de Alencar SM, Skibsted LH. Antioxidative and prooxidative effects in food lipids and synergism with α-tocopherol of açaí seed extracts and grape rachis extracts. Food Chem. 2016;213:440–449. doi: 10.1016/j.foodchem.2016.06.101. [DOI] [PubMed] [Google Scholar]
- Monteiro AF, Miguez IS, Silva JPRB, da Silva AS. High concentration and yield production of mannose from açaí (Euterpe oleracea Mart.) seeds via mannanase-catalyzed hydrolysis. Sci Rep. 2019;9:10939. doi: 10.1038/s41598-019-47401-3. [DOI] [PMC free article] [PubMed] [Google Scholar]
- Musci M, Yao S. Optimization and validation of Folin-Ciocalteu method for the determination of total polyphenol content of Pu-erh tea. Int J Food Sci Nutr. 2017;68:913–918. doi: 10.1080/09637486.2017.1311844. [DOI] [PubMed] [Google Scholar]
- Pandey KB, Rizvi SI. Plant polyphenols as dietary antioxidants in human health and disease. Oxid Med Cell Longev. 2009;2:270–278. doi: 10.4161/oxim.2.5.9498. [DOI] [PMC free article] [PubMed] [Google Scholar]
- Pompeu DR, Silva EM, Rogez H. Optimisation of the solvent extraction of phenolic antioxidants from fruits of Euterpe oleracea using response surface methodology. Bioresour Technol. 2009;100:6076–6082. doi: 10.1016/j.biortech.2009.03.083. [DOI] [PubMed] [Google Scholar]
- Sánchez-Rangel JC, Benavides J, Heredia JB, et al. The Folin-Ciocalteu assay revisited: improvement of its specificity for total phenolic content determination. Anal Methods. 2013;5:5990. doi: 10.1039/c3ay41125g. [DOI] [Google Scholar]
- Silva DF, Vidal FCB, Santos D, et al. Cytotoxic effects of Euterpe Oleracea Mart in malignant cell lines. BMC Complement Altern Med. 2014;14:175. doi: 10.1186/1472-6882-14-175. [DOI] [PMC free article] [PubMed] [Google Scholar]
- Singleton VL, Rossi JAJ. Colorimetry of total phenolics with phosphomolybdic-phosphotungstic acid reagents. Am J Enol Vitic. 1965;16:144–158. [Google Scholar]
- Soares ER, Monteiro EB, de Bem GF, et al. Up-regulation of Nrf2-antioxidant signaling by Açaí (Euterpe oleracea Mart.) extract prevents oxidative stress in human endothelial cells. J Funct Foods. 2017;37:107–115. doi: 10.1016/j.jff.2017.07.035. [DOI] [Google Scholar]
- Sudo RT, Neto ML, Monteiro CES, et al. Antinociceptive effects of hydroalcoholic extract from Euterpe oleracea Mart (Açaí) in a rodent model of acute and neuropathic pain. BMC Complement Altern Med. 2015;15:208. doi: 10.1186/s12906-015-0724-2. [DOI] [PMC free article] [PubMed] [Google Scholar]
- Verza SG, Kreinecker MT, Reis V, et al. Avaliação das variáveis analíticas do método de Folin-Ciocalteu para determinação do teor de taninos totais utilizando como modelo o extrato aquoso de folhas de Psidium guajava L. Quim Nova. 2007;30:815–820. doi: 10.1590/S0100-40422007000400011. [DOI] [Google Scholar]
- Waterhouse AL. Current protocols in food analytical chemistry. Hoboken: Wiley; 2003. Determination of total phenolics; pp. 130–143. [Google Scholar]
- Wootton-Beard PC, Moran A, Ryan L. Stability of the total antioxidant capacity and total polyphenol content of 23 commercially available vegetable juices before and after in vitro digestion measured by FRAP, DPPH, ABTS and Folin-Ciocalteu methods. Food Res Int. 2011;44:217–224. doi: 10.1016/j.foodres.2010.10.033. [DOI] [Google Scholar]