Abstract
Purpose
This study aimed to propose a fully automatic landmark identification model based on a deep learning algorithm using real clinical data and to verify its accuracy considering inter-examiner variability.
Materials and Methods
In total, 950 lateral cephalometric images from Yonsei Dental Hospital were used. Two calibrated examiners manually identified the 13 most important landmarks to set as references. The proposed deep learning model has a 2-step structure—a region of interest machine and a detection machine—each consisting of 8 convolution layers, 5 pooling layers, and 2 fully connected layers. The distance errors of detection between 2 examiners were used as a clinically acceptable range for performance evaluation.
Results
The 13 landmarks were automatically detected using the proposed model. Inter-examiner agreement for all landmarks indicated excellent reliability based on the 95% confidence interval. The average clinically acceptable range for all 13 landmarks was 1.24 mm. The mean radial error between the reference values assigned by 1 expert and the proposed model was 1.84 mm, exhibiting a successful detection rate of 36.1%. The A-point, the incisal tip of the maxillary and mandibular incisors, and ANS showed lower mean radial error than the calibrated expert variability.
Conclusion
This experiment demonstrated that the proposed deep learning model can perform fully automatic identification of cephalometric landmarks and achieve better results than examiners for some landmarks. It is meaningful to consider between-examiner variability for clinical applicability when evaluating the performance of deep learning methods in cephalometric landmark identification.
Keywords: Anatomic Landmarks, Artificial Intelligence, Dental Digital Radiography, Deep Learning, Neural Network Models
Introduction
Cephalometric analysis, which has been established as a gold standard for orthodontic diagnoses, has involved measurements of multiple linear and angular parameters using lateral cephalograms since Broadbent introduced the method in 1931.1,2 Each parameter is calculated based on clinically important landmarks and provides clinicians with useful information to facilitate diagnosis, growth assessment, orthodontic treatment planning, orthognathic surgery, and treatment outcome assessment.3,4 Although landmark identification is an indispensable part of the diagnostic process in orthodontics, image-related errors5,6 and expert bias7,8,9,10,11 can cause variability in landmark detection.3,8
Since the 1990s, various approaches have been tried to identify cephalometric landmarks automatically. In the early stages, pixel intensity and knowledge-based methods were used.12,13,14,15 However, the results showed sensitive fluctuations depending on the image quality and were difficult to apply in clinical settings. Template matching16,17 and mathematical model12,18 approaches have also been attempted, and multiple methods have been combined to overcome the disadvantages of each method.4,19,20 In recent years, deep learning algorithms have been widely introduced to detect landmarks automatically on lateral cephalograms.21,22,23 Despite the wide variety of approaches, it remains challenging to automatically detect all landmarks that are essential for diagnosis and achieve clinically acceptable performance.
Previous researchers evaluated performance in terms of how many landmarks are identified within a precision range of about 2 to 4 mm.3,20,21,24,25 However, there has been no official consensus approved by an academic society specializing in orthodontics regarding the clinically acceptable precision range for landmark identification. Due to the complexity of lateral cephalograms, some landmarks are more difficult to identify than others, even for experts.24
In this study, a fully automatic landmark identification model was developed using deep learning and its performance was evaluated in terms of a clinically acceptable range determined based on the inter-examiner reliability of experts.
Materials and Methods
Ethics approval
Every image was anonymized to avoid identification of the patients, and ethical approval (IRB No. 2-2017-0054) was obtained from the research ethics committee of the Institutional Review Board (IRB) of Yonsei University Dental Hospital. All experiments were performed in accordance with relevant guidelines and ethical regulations, and the requirement for patient consent was waived by the IRB of Yonsei University Dental Hospital due to the retrospective nature of this study.
Data preparation
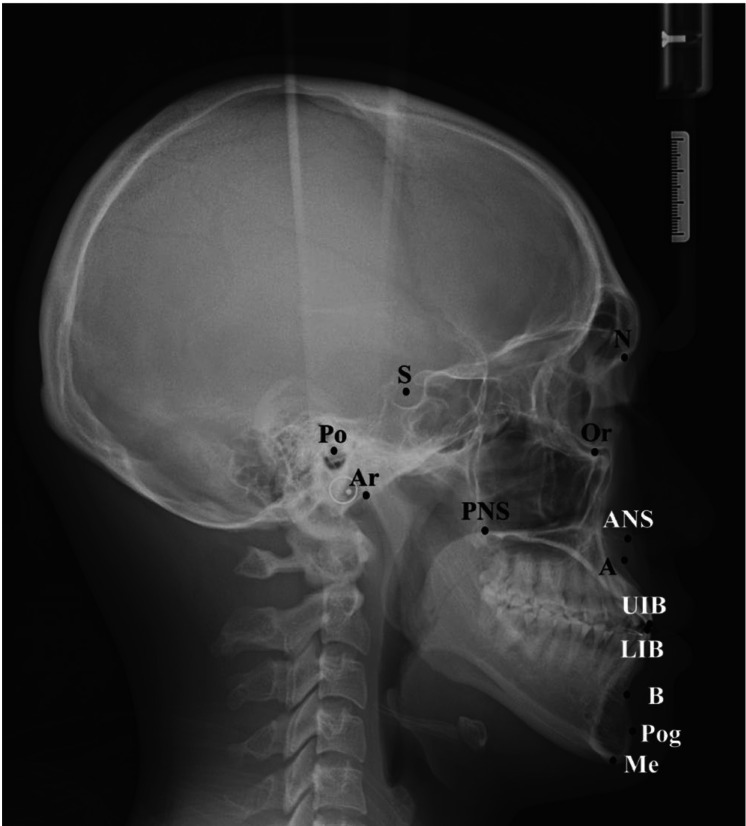
A total of 950 lateral cephalometric images were used. The images were taken by a Rayscan (Ray Co. Ltd., Hwaseong, Korea) at the Department of Oral and Maxillofacial Radiology and extracted from the picture archiving and communication system of Yonsei University Dental Hospital. The 950 radiographic images were randomly divided into 800 training images, 100 validation images, and 50 test images without overlapping. Thirteen cephalometric landmarks, which are clinically important and based on the hard tissue, were selected in this study. The landmarks included the sella (Se), nasion (N), orbitale (Or), porion (Po), A-point(A), B-point(B), pogonion (Pog), menton (Me), upper incisor border (UIB), lower incisor border (LIB), posterior nasal spine (PNS), anterior nasal spine (ANS), and articulare (Ar) (Fig. 1). Two calibrated orthodontists manually annotated these 13 landmarks using OrthoVision software (Ewoosoft Co. Ltd., Hwaseong, Korea). They were trained in the same orthodontic department and had 15 and 5 years of clinical experience, respectively. To improve inter-examiner reliability, they had 3 training sessions before identifying the landmarks for this study. The landmark data obtained from an expert with 15 years of experience were regarded as the reference landmarks and the distance error of detection between the 2 experts (expert variability) was used to establish a clinically acceptable range for each landmark. To verify inter-examiner reproducibility, 50 cephalometric images were randomly selected and landmarks were annotated manually by 2 experts.
Fig. 1. Cephalometric identification of the 13 landmarks used in this study. S: sella, N: nasion, Or: orbitale, Po: porion, A: A-point, B: B-point, Pog: pogonion, Me: menton, UIB: upper incisor border, LIB: lower incisor border, PNS: posterior nasal spine, ANS: anterior nasal spine, Ar: articulare.
Convolutional neural network model for landmark detection
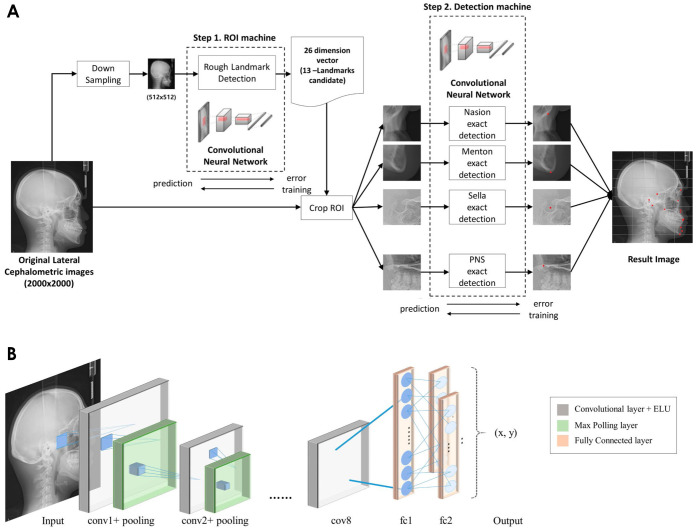
Figure 2 shows the proposed fully automatic landmark detection model using a convolutional neural network (CNN). The proposed deep learning model has a 2-step structure, comprising a region of interest (ROI) machine and a detection machine (Fig. 2A). Each CNN consisted of 8 convolution layers, 5 pooling layers, and 2 fully connected layers(Fig. 2B).
Fig. 2. The structure of the proposed fully automatic landmark detection model using a convolutional neural network (CNN). A. The overall workflow of the 2-step machines of the proposed model. B. The structure of the CNN model. ROI: region of interest; PNS: posterior nasal spine; ELU: exponential linear units.
The convolution layer had a filter size of 3×3 and the exponential linear units (ELU) function was used for activation. The original images were 1,956×2,238 pixels with a pixel spacing of 0.12 mm. Before being input into the deep learning model, the original images were resized to 512×512 pixels for efficient and fast detection of the 13 landmarks. The first step, the ROI machine, was designed to crop 13 target areas, each of which contained 1 landmark. Once the resized image was input, the convolution layers found the local features of the image, and then the fully connected layers combined the associations of these features to predict the coordinates for the 13 landmarks. Since each of the landmarks has 2-dimensional coordinates (x and y), the predicted landmarks were represented by a 26-dimensional vector, and based on this result, the ROI was cropped in the input image. The second step, the detection machine, was designed to identify the 13 landmarks from each ROI. Once the 13 cropped images were input into 13 CNN models, respectively, the models predicted the coordinates of the landmarks. To optimize the hyper-parameter, the distance errors between the results predicted by the detection machine and the expert-annotated results were used. After the automatic detection of the landmarks was completed, the cropped images were merged into the original position and output as a single image that contained the 13 identified landmarks in 1,956×2,238 pixels. The model was performed on a Linux server running Ubuntu 18.04 with 128 GB of memory and 12 GB of GPU memory (NVIDIA Titan Xp; NVIDIA Corporation, Santa Clara, CA, USA).
Statistical evaluation
The intra-class coefficient correlation (ICC) was calculated to confirm the degree of reliability of the 2 experts. The mean radial error (MRE) and standard deviation (SD) for 13 landmarks between the 2 examiners were calculated to establish the clinically acceptable range. The radial error and MRE are defined in equations(1) and (2), where Δx and Δy denote the absolute distance in the coordinates in the x- and y-directions, respectively, between the predicted and reference landmarks.
| (eq. 1) |
| (eq. 2) |
The similarity of the detected landmarks consisting of coordinates (x, y) was obtained by calculating the pixel distance using Euclidean distance and multiplying by the pixel space value (0.12 mm).
Two types of the successful detection rate (SDR)—the general SDR and the expert variability SDR—were also calculated to assess the performance of the proposed model. The general SDR was calculated as the ratio at which the difference between the predicted and reference landmarks was within a given distance, such as 2.0 mm, 2.5 mm, 3.0 mm, and 4.0 mm. The expert variability SDR was calculated by evaluating whether the difference between the reference and the predicted landmarks was within the inter-expert difference values.
Results
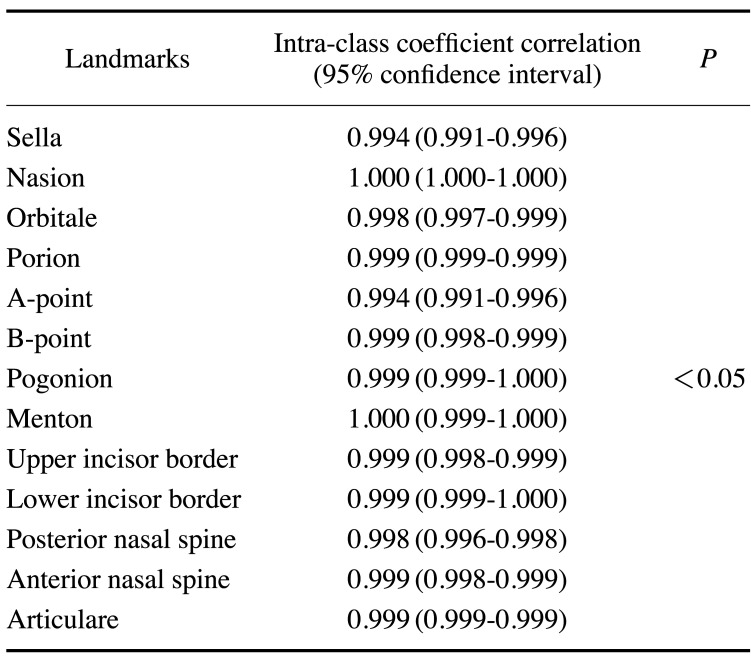
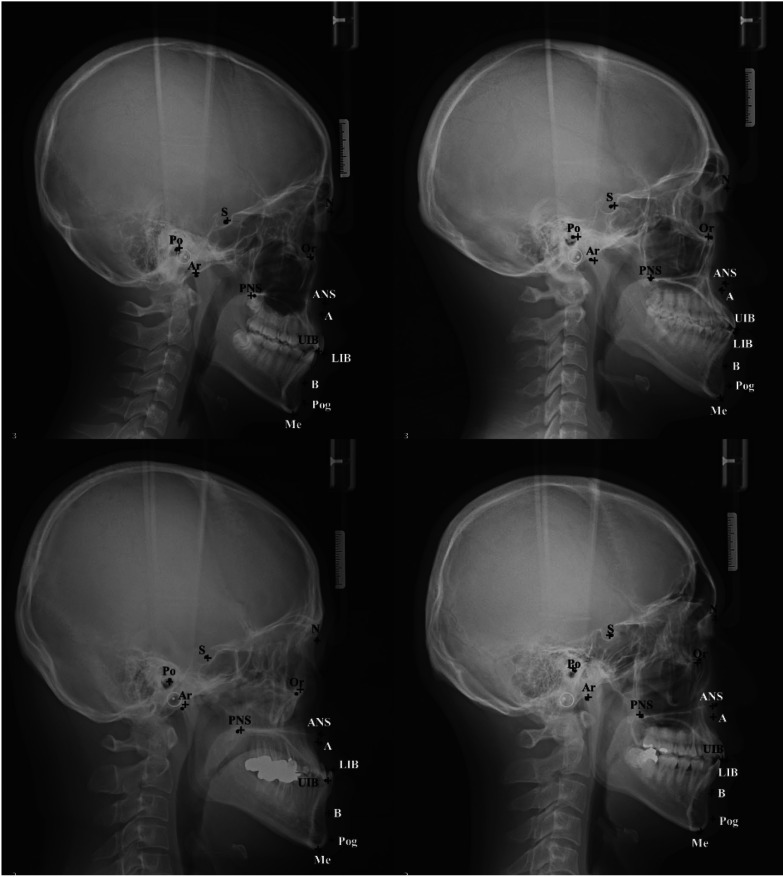
The ICCs of the 2 examiners were above 0.99 for all landmarks, including the lower bounds of the 95% confidence intervals (Table 1). Since the ICC values were more than 0.7, which is generally used as the criterion for high agreement, the reliability of the 2 examiners showed almost perfect agreement. Figure 3 presents 4 images of the predicted results by the proposed CNN model compared with the reference landmarks.
Table 1. Reliability of manually annotated landmarks by 2 examiners.
Fig. 3. Comparison of the predicted (cross line) and reference (dot) locations of 13 landmarks. S: sella, N: nasion, Or: orbitale, Po: porion, A: A-point, B: B-point, Pog: pogonion, Me: menton, UIB: upper incisor border, LIB: lower incisor border, PNS: posterior nasal spine, ANS: anterior nasal spine, Ar: articulare.
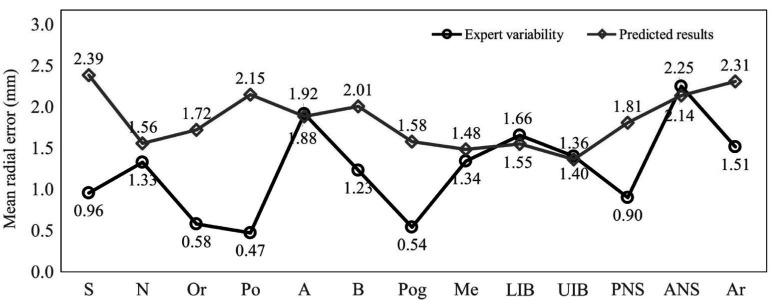
Figure 4 displays the MREs of expert variability and the predicted results for all landmarks. From the results for expert variability, ANS showed the highest MRE with 2.25 mm, while Po had the lowest with 0.47 mm. Five landmarks (S, Or, Po, Pog, and PNS) presented less than 1.00 mm of MRE. The MRE of the predicted results for the A-point, UIB, LIB, and ANS were 1.89 mm, 1.55 mm, 1.37 mm, and 2.14 mm, which were lower than the corresponding expert variability values of 1.97 mm, 1.66 mm, 1.40 mm, and 2.25 mm, respectively. S, Po, B, ANS, and Ar had MREs of more than 2.00 mm. UIB showed the lowest MRE (1.37 mm).
Fig. 4. Comparison of the mean radial errors of expert variability and predicted results. S: sella, N: nasion, Or: orbitale, Po: porion, A: A-point, B: B-point, Pog: pogonion, Me: menton, UIB: upper incisor border, LIB: lower incisor border, PNS: posterior nasal spine, ANS: anterior nasal spine, Ar: articulare.
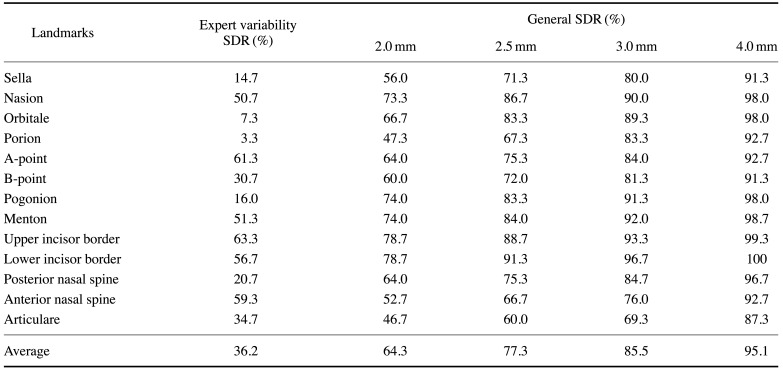
Table 2 presents the performance of the proposed algorithm in terms of the general SDR and expert variability SDR. Six landmarks(N, A, Me, LIB, UIB, and ANS) had SDRs over 50% according to expert variability. Although Po and Or showed SDRs of 47.3% and 66.7%, respectively, when calculated with a general precision range of 2.0 mm, the 2 landmarks showed expert variability SDRs of 3.3% and 7.3%.
Table 2. The success detection rate (SDR) of landmark identification using the proposed algorithm.
Discussion
In orthodontic procedures, cephalometric landmark detection is essential for accurate diagnosis and proper assessment of treatment progress, although it is a time-consuming, bothersome, and error-proven task for dentists.12 To overcome these drawbacks, grand challenges at the International Symposium on Biomedical Imaging were held, and the participants proposed various methods to automatically identify landmarks using cephalometric images.26 Researchers have been trying to achieve more accurate performance using the state-of-the-art methods.1,23,27
This study proposed a fully automatic deep learning method for landmark identification in cephalometric images. Similar to previous researchers,21,27 we designed an ROI machine that detects small areas, including target landmarks, from the entire image using a CNN model. In the model proposed in this study, based on the detected ROI, an individual CNN model is applied for the 13 landmarks that need to be identified. This architecture may allow each CNN model to extract feature maps for only 1 target landmark, resulting in faster and more accurate results.
In previous studies, however, these distances were not evaluated considering a clinically acceptable range. Because expert variability in landmark detection might often happen, it may be difficult to detect exactly the same position.5,12,28 The clinically acceptable error range in landmark identification is still debatable.7
In this study, the general SDR was based on general precision ranges (2.0, 2.5, 3.0, and 4.0 mm), and expert variability SDR was based on the difference between 2 examiners for each of the 13 landmarks for a clinically acceptable evaluation. Two trained orthodontists annotated the 13 landmarks using randomly selected cephalometric images. Despite the different experience of the 2 examiners, the inter-examiner agreement for all landmarks indicated excellent reliability.29 This may be due to the fact that the 2 examiners had sufficient agreement and training sessions in advance. Thus, the differences(in terms of the Euclidean distance) between the location of the landmarks identified by the trained experts were considered as the clinically acceptable precision ranges.
Expert variability SDR ranged from 3.3% to 63.3%, and the rate was higher when calculated on the basis of the general precision range. For example, Or and Po exhibited SDRs of 66.67% and 47.33%, respectively, with 2.0 mm of precision, but 7.33% and 3.33%, respectively, with the expert variability SDR. This means that even though the identified landmarks showed high SDR values based on general precision ranges, they may still be clinically unacceptable. Furthermore, the A-point, LIB, UIB, and ANS showed lower MRE values when detected automatically by the proposed model than the variability between trained experts, indicating excellent detection performance for those landmarks.
Some researchers10,30,31 reported that landmarks located anatomically on curves, such as the A-point, are prone to identification errors. The precision of landmark identification can be affected by various factors such as the level of examiner's knowledge,7 individual understanding of landmark definitions,32,33 and the quality of cephalometric images.33 The reason why the proposed CNN model showed lower errors than experts in some landmarks may be due to the reduced human-induced variability due to the above-mentioned factors.
The proposed algorithm was developed for fully automatic landmark detection using real clinical data, and expert variability was considered for the evaluation of 13 detected landmarks. This can be useful when evaluating the clinical applicability of the developed model.
Footnotes
This work was supported by a National Research Foundation of Korea (NRF) grant funded by the Korean government(MSIT) (No. 2019R1A2C1007508).
Conflicts of Interest: None
References
- 1.Wang S, Li H, Li J, Zhang Y, Zou B. Automatic analysis of lateral cephalograms based on multiresolution decision tree regression voting. J Healthc Eng. 2018;2018:1797502. doi: 10.1155/2018/1797502. [DOI] [PMC free article] [PubMed] [Google Scholar]
- 2.Broadbent BH. A new x-ray technique and its application to orthodontia. Angle Orthod. 1931;1:45–66. [Google Scholar]
- 3.Lindner C, Wang CW, Huang CT, Li CH, Chang SW, Cootes TF. Fully automatic system for accurate localisation and analysis of cephalometric landmarks in lateral cephalograms. Sci Rep. 2016;6:33581. doi: 10.1038/srep33581. [DOI] [PMC free article] [PubMed] [Google Scholar]
- 4.Yang J, Ling X, Lu Y, Wei M, Ding G. Cephalometric image analysis and measurement for orthognathic surgery. Med Biol Eng Comput. 2001;39:279–284. doi: 10.1007/BF02345280. [DOI] [PubMed] [Google Scholar]
- 5.Houston WJ. The analysis of errors in orthodontic measurements. Am J Orthod. 1983;83:382–390. doi: 10.1016/0002-9416(83)90322-6. [DOI] [PubMed] [Google Scholar]
- 6.Chien PC, Parks ET, Eraso F, Hartsfield JK, Roberts WE, Ofner S. Comparison of reliability in anatomical landmark identification using two-dimensional digital cephalometrics and three-dimensional cone beam computed tomography in vivo. Dentomaxillofac Radiol. 2009;38:262–273. doi: 10.1259/dmfr/81889955. [DOI] [PubMed] [Google Scholar]
- 7.Durão AP, Morosolli A, Pittayapat P, Bolstad N, Ferreira AP, Jacobs R. Cephalometric landmark variability among orthodontists and dentomaxillofacial radiologists: a comparative study. Imaging Sci Dent. 2015;45:213–220. doi: 10.5624/isd.2015.45.4.213. [DOI] [PMC free article] [PubMed] [Google Scholar]
- 8.Trpkova B, Major P, Prasad N, Nebbe B. Cephalometric landmarks identification and reproducibility: a meta analysis. Am J Orthod Dentofacial Orthop. 1997;112:165–170. doi: 10.1016/s0889-5406(97)70242-7. [DOI] [PubMed] [Google Scholar]
- 9.Sekiguchi T, Savara BS. Variability of cephalometric landmarks used for face growth studies. Am J Orthod. 1972;61:603–618. doi: 10.1016/0002-9416(72)90109-1. [DOI] [PubMed] [Google Scholar]
- 10.Houston WJ, Maher RE, McElroy D, Sherriff M. Sources of error in measurements from cephalometric radiographs. Eur J Orthod. 1986;8:149–151. doi: 10.1093/ejo/8.3.149. [DOI] [PubMed] [Google Scholar]
- 11.Midtgård J, Björk G, Linder-Aronson S. Reproducibility of cephalometric landmarks and errors of measurements of cephalometric cranial distances. Angle Orthod. 1974;44:56–61. doi: 10.1043/0003-3219(1974)044<0056:ROCLAE>2.0.CO;2. [DOI] [PubMed] [Google Scholar]
- 12.Rueda S, Alcañiz M. An approach for the automatic cephalometric landmark detection using mathematical morphology and active appearance models. Med Image Comput Comput Assist Interv. 2006;9:159–166. doi: 10.1007/11866565_20. [DOI] [PubMed] [Google Scholar]
- 13.Lévy-Mandel AD, Venetsanopoulos AN, Tsotsos JK. Knowledge-based landmarking of cephalograms. Comput Biomed Res. 1986;19:282–309. doi: 10.1016/0010-4809(86)90023-6. [DOI] [PubMed] [Google Scholar]
- 14.Parthasarathy S, Nugent ST, Gregson PG, Fay DF. Automatic landmarking of cephalograms. Comput Biomed Res. 1989;22:248–269. doi: 10.1016/0010-4809(89)90005-0. [DOI] [PubMed] [Google Scholar]
- 15.Houston WJ. The analysis of errors in orthodontic measurements. Am J Orthod. 1983;83:382–390. doi: 10.1016/0002-9416(83)90322-6. [DOI] [PubMed] [Google Scholar]
- 16.Cardillo J, Sid-Ahmed MA. An image processing system for locating craniofacial landmarks. IEEE Trans Med Imaging. 1994;13:275–289. doi: 10.1109/42.293920. [DOI] [PubMed] [Google Scholar]
- 17.Grau V, Alcaniz M, Juan MC, Monserrat C, Knoll C. Automatic localization of cephalometric landmarks. J Biomed Inform. 2001;34:146–156. doi: 10.1006/jbin.2001.1014. [DOI] [PubMed] [Google Scholar]
- 18.Hutton TJ, Cunningham S, Hammond P. An evaluation of active shape models for the automatic identification of cephalometric landmarks. Eur J Orthod. 2000;22:499–508. doi: 10.1093/ejo/22.5.499. [DOI] [PubMed] [Google Scholar]
- 19.Montúfar J, Romero M, Scougall-Vilchis RJ. Hybrid approach for automatic cephalometric landmark annotation on conebeam computed tomography volumes. Am J Orthod Dentofacial Orthop. 2018;154:140–150. doi: 10.1016/j.ajodo.2017.08.028. [DOI] [PubMed] [Google Scholar]
- 20.Yue W, Yin D, Li C, Wang G, Xu T. Automated 2-D cephalometric analysis on X-ray images by a model-based approach. IEEE Trans Biomed Eng. 2006;53:1615–1623. doi: 10.1109/TBME.2006.876638. [DOI] [PubMed] [Google Scholar]
- 21.Arik SÖ, Ibragimov B, Xing L. Fully automated quantitative cephalometry using convolutional neural networks. J Med Imaging (Bellingham) 2017;4:014501. doi: 10.1117/1.JMI.4.1.014501. [DOI] [PMC free article] [PubMed] [Google Scholar]
- 22.Innes A, Ciesielski V, Mamutil J, John S. In: Arabnia H, Mun Y, editors. Landmark detection for cephalometric radiology images using pulse coupled neural networks; Proceedings of the International Conference on Artificial Intelligence (ICAI'02); 2002 June 24–27; Las Vegas, Nevada, USA: CSREA; 2002. pp. 511–517. [Google Scholar]
- 23.Lee H, Park M, Kim J. Cephalometric landmark detection in dental X-ray images using convolutional neural networks; Proceedings Medical Imaging 2017: Computer-Aided Diagnosis; 2017 Feb 11–16; Orlando, Florida, United States: SPIE; 2017. p. 101341W. [Google Scholar]
- 24.Wang CW, Huang CT, Hsieh MC, Li CH, Chang SW, Li WC, et al. Evaluation and comparison of anatomical landmark detection methods for cephalometric X-ray images: a grand challenge. IEEE Trans Med Imaging. 2015;34:1890–1900. doi: 10.1109/TMI.2015.2412951. [DOI] [PubMed] [Google Scholar]
- 25.Shahidi S, Oshagh M, Gozin F, Salehi P, Danaei SM. Accuracy of computerized automatic identification of cephalometric landmarks by a designed software. Dentomaxillofac Radiol. 2013;42:20110187. doi: 10.1259/dmfr.20110187. [DOI] [PMC free article] [PubMed] [Google Scholar]
- 26.Wang CW, Huang CT, Lee JH, Li CH, Chang SW, Siao MJ, et al. A benchmark for comparison of dental radiography analysis algorithms. Med Image Anal. 2016;31:63–76. doi: 10.1016/j.media.2016.02.004. [DOI] [PubMed] [Google Scholar]
- 27.Song Y, Qiao X, Iwamoto Y, Chen YW. Automatic cephalometric landmark detection on X-ray images using a deep-learning method. Appl Sci. 2020;10:2547 [Google Scholar]
- 28.Delamare EL, Liedke GS, Vizzotto MB, da Silveira HL, Ribeiro JL, Silveira HE. Influence of a programme of professional calibration in the variability of landmark identification using cone beam computed tomography-synthesized and conventional radiographic cephalograms. Dentomaxillofac Radiol. 2010;39:414–423. doi: 10.1259/dmfr/31924248. [DOI] [PMC free article] [PubMed] [Google Scholar]
- 29.Koo TK, Li MY. A guideline of selecting and reporting intraclass correlation coefficients for reliability research. J Chiropr Med. 2016;15:155–163. doi: 10.1016/j.jcm.2016.02.012. [DOI] [PMC free article] [PubMed] [Google Scholar]
- 30.Durão AR, Pittayapat P, Rockenbach MI, Olszewski R, Ng S, Ferreira AP, et al. Validity of 2D lateral cephalometry in orthodontics: a systematic review. Prog Orthod. 2013;14:31. doi: 10.1186/2196-1042-14-31. [DOI] [PMC free article] [PubMed] [Google Scholar]
- 31.Tng TT, Chan TC, Hägg U, Cooke MS. Validity of cephalometric landmarks. An experimental study on human skulls. Eur J Orthod. 1994;16:110–120. doi: 10.1093/ejo/16.2.110. [DOI] [PubMed] [Google Scholar]
- 32.Lau PY, Cooke MS, Hägg U. Effect of training and experience on cephalometric measurement errors on surgical patients. Int J Adult Orthodon Orthognath Surg. 1997;12:204–213. [PubMed] [Google Scholar]
- 33.Gravely JF, Benzies PM. The clinical significance of tracing error in cephalometry. Br J Orthod. 1974;1:95–101. doi: 10.1179/bjo.1.3.95. [DOI] [PubMed] [Google Scholar]


