

Abstract
Background
Although deformation and fracture of the vertebral endplate have been implicated in spinal conditions such as vertebral fracture and disc degeneration, few biomechanical studies of this structure are available. The goal of this study was to quantify the mechanical behavior of the vertebral endplate.
Methods
Eight‐five rectangular specimens were dissected from the superior and/or inferior central endplates of human lumbar spine segments L1 to L4. Micro‐computed tomography (μCT) imaging, four‐point‐bend testing, and ashing were performed to quantify the apparent elastic modulus and yield stress (modulus and yield stress, respectively, of the porous vertebral endplate), tissue yield stress (yield stress of the tissue of the vertebral endplate, excluding pores), ultimate strain, fracture strain, bone volume fraction (BV/TV), bone mineral density (BMD), and various measures of tissue density and composition (tissue mineral density, ash fraction, and ash density). Regression was used to assess the dependence of mechanical properties on density and composition.
Results
Wide variations in elastic and failure properties, and in density and tissue composition, were observed. BMD and BV/TV were good predictors of many of the apparent‐level mechanical properties, including modulus, yield stress, and in the case of the inferior vertebral endplate, failure strains. Similar values of the mechanical properties were noted between superior and inferior vertebral endplates. In contrast to the dependence of apparent stiffness and strength on BMD and BV/TV, none of the mechanical properties depended on any of the tissue‐level density measurements.
Conclusion
The dependence of many of the mechanical properties of the vertebral endplate on BV/TV and BMD suggests possibilities for noninvasive assessment of how this region of the spine behaves during habitual and injurious loading. Further study of the nonmineral components of the endplate tissue is required to understand how the composition of this tissue may influence the overall mechanical behavior of the vertebral endplate.
Keywords: bending, density, fracture, micro‐computed tomography, vertebral endplate
Because the vertebral endplate is critical in affecting the spinal disease, it is necessary to quantify its mechanical properties and link those properties with its structure. We found large variations in mechanical properties of vertebral endplate from elastic deformation to fracture. Those variations could partly be explained by bone volume fraction and BMD. Explorations of properties of nonmineral components in vertebral endplate should be further analyzed.

1. INTRODUCTION
The vertebral endplate, a thin, porous structure at the interface between the intervertebral disc and the trabecular centrum of the vertebral body, has been implicated in the etiology of two common causes of back pain, disc degeneration, and vertebral fracture.1, 2 The vertebral endplate mediates fluid transport and load transfer between the disc and centrum of vertebral body, thereby serving an important structural and biochemical role in the spine.3 Vertebral fractures, which affect at least 12% to 20% of men and women over the age of 50,4, 5, 6 frequently occur at or near the vertebral endplate.7, 8, 9 Moreover, breakage of the vertebral endplate during vertebral fracture may lead to worsening of the fracture over time10 and degeneration of the adjacent intervertebral disc.11, 12, 13 Thus, study of the mechanical behavior of the vertebral endplate and the dependence of this behavior on structure and composition can aid in understanding the development and consequences of vertebral fracture.
A limited amount of data is available on the mechanical properties of the tissue in the vertebral endplate (“tissue‐level properties”14), and less is known about the mechanical behavior of the vertebral endplate as a structure (“apparent‐level properties”). Previous studies have carried out micro‐indentation tests on tissue from the vertebral endplate, vertebral trabecular bone, and the cortical shell, and have found similar elastic moduli among these three types of tissue.15, 16 However, given that the vertebral endplate has a preponderance of microscale pores, mechanical characterization at larger length scales is still needed. Several studies have used much larger indenters (3 and 1.5 mm) to indent across the superior and/or inferior endplate surface of the vertebra. These studies have generally found that the ring apophysis is stronger and stiffer than the central region,17, 18, 19, 20, 21 although the opposite was found when the cartilage endplate was left attached to the vertebral endplate.22 It is important to note that these macro‐level indentation tests do not measure the properties of the vertebral endplate alone but rather those of the vertebral endplate together with some fraction of the rest of the vertebra. The indentation strength and stiffness measured in these types of macroscale tests are lower upon removal of the vertebral endplate,23 which adds to the evidence of the mechanical importance of the vertebral endplate but does not provide direct quantification of its properties.
Despite the paucity of mechanical data on the vertebral endplate, data on its microstructure and composition suggest that its mechanical behavior may vary greatly. Porosity and thickness tend to be higher and lower, respectively, in the superior (relative to the vertebra) vertebral endplate compared to the inferior one,24, 25 which is consistent with clinical observations of a higher incidence of fractures in the superior half of the vertebral body.26 Among individuals, variations in the bone mineral density (BMD) of the vertebral endplate are nearly as large as those in the BMD of the entire vertebral body and in the BMD of vertebral trabecular bone.27 Some of this variation could be due to changes in porosity; for example, both Rodriguez et al and Zehra et al found that vertebral endplate porosity increases approximately two‐fold over the course of disc degeneration.28, 29 However, conflicting reports exist as to whether porosity and BMD change with age,30 and the implications of the inter‐ and intraindividual variations in microstructure and composition for mechanical behavior are not yet known.
As such, the overall goal of this project was to characterize the mechanical behavior of the vertebral endplate. Rectangular specimens of the vertebral endplate were subjected to four‐point bend tests and underwent microstructural and compositional analyses. Our specific objectives were: (a) to quantify the elastic, yield and fracture properties of superior and inferior vertebral endplates; and (b) to determine the dependence of these properties on measures of structure and composition.
2. MATERIALS AND METHODS
2.1. Specimen preparation
L1 to L4 vertebrae were obtained from 39 fresh frozen cadavers (24 males, 15 females) of mean age 77.7 years (SD = 6.5 years, range: 25‐91 years; Figure 1). The vertebral bodies were separated into superior and inferior halves with an autopsy saw, and on each half the cartilage endplate was removed with a scalpel to expose the vertebral endplate. The halves of the vertebral bodies were further trimmed using a diamond wafering blade (IsoMet 4000; Buehler, Lake Bluff, Illinois) to produce a rectangular test specimen of the vertebral endplate with approximate dimensions 30 mm × 13 mm × 1.5 mm (Figure 2A). Due to the irregular thickness and surface topography of the vertebral endplate, the test specimens contained some struts of subchondral trabecular bone (Figure 2B). Five of the vertebral endplates produced two test specimens each, while the remaining 75 produced only one test specimen each.
FIGURE 1.
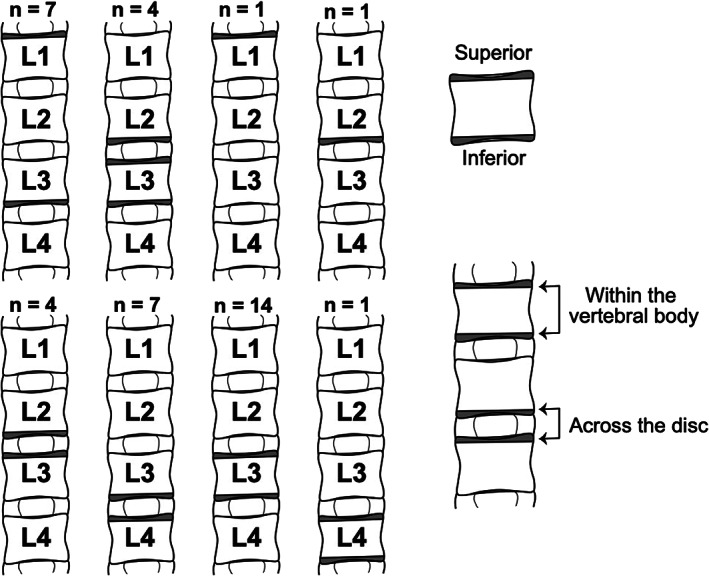
Origin of the vertebral endplate specimens used in this study with respect to the 39 L1 to L4 spine segments. Gray shading indicates where the specimens were harvested from. n is the number of spine segments in each dissection scenario. Superior and inferior endplates collected from the same spine can be paired within the same vertebral body or across the same disc
FIGURE 2.
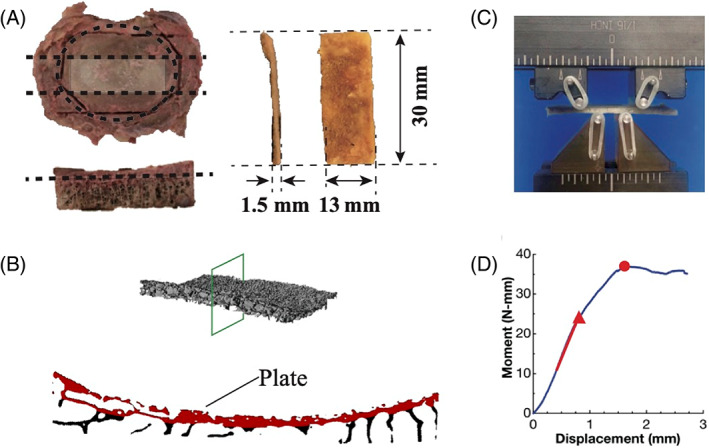
(A) Specimen preparation (dotted lines represent cuts): The ring apophysis of the superior or inferior half of the vertebra was first trimmed off using bone saw followed by a transverse cut to reduce the thickness to 5 mm. Then two sagittal cuts were made to dissect the central 13 mm region. The last cut further reduced the thickness to 1.5 mm. (B) A μCT cross‐section of the vertebral endplate. The plate itself is false‐colored red. (C) Four‐point‐bend test set‐up. The bottom two pins are loading pins with inner span of 8 mm. The top two pins are supporting pins with outer span of 16 mm. (D) Representative moment‐displacement curve. The red line, red triangle, and red dot mark the slope used to compute the elastic modulus, yield point, and ultimate point, respectively
2.2. Micro‐computed tomography scanning
Each test specimen was submerged in PBS solution and imaged in a micro‐computed tomography (μCT) scanner (μCT 40; Scanco Medical, Brüttisellen, Switzerland, 16 μm/voxel, 70 kV, 114 μA). A threshold of 510 mg HA/cm3 (215 per‐mille), determined from an adaptive, iterative technique (Scanco Medical), was used to binarize those μCT images. Bone volume fraction (BV/TV), BMD, and tissue mineral density (TMD) were quantified for the central 16 mm of the specimens; this region corresponds to the flexural span in the bend tests. BMD was defined as the average density of all voxels in the 16 mm span and is akin to apparent density, whereas TMD was defined as the average density of only the voxels within the 16 mm span whose mineral density was above the threshold. Plate thickness (Figure 2B) was measured using the three dimensional thickness measurement algorithm in BoneJ,31 which computes local values of thickness throughout the structure and then averages these. Although some of the local thicknesses corresponded to the trabecular struts, their effect on the resulting average was small due to the small percentage of struts present.
2.3. Mechanical testing
Following μCT scanning, each specimen was placed on the support pins of a four‐point‐bend test fixture (inner span = 8 mm, outer span = 16 mm) in an electromechanical test frame (model 5565; Instron, Norwood, Massachusetts; Figure 2C). Specimens were oriented such that the surface of the vertebral endplate was placed in compression during the bend test, to mimic the type of concavity that develops in most clinical vertebral fractures in the elderly. After 15 cycles of preconditioning to 0.75 mm, each specimen was loaded to failure at a rate of 0.21 mm/seconds.8 Force and displacement were measured with a 1 kN load cell and the test frame's LVDT, respectively; the measured displacement was that of the outer pins. The test was stopped when either failure of specimen occurred (defined as the force dropping to zero) or when the displacement limit of the test was reached (defined as the onset of pinching of the specimen between the upper pins and the sides of the bottom fixture, Figure 3A).
FIGURE 3.
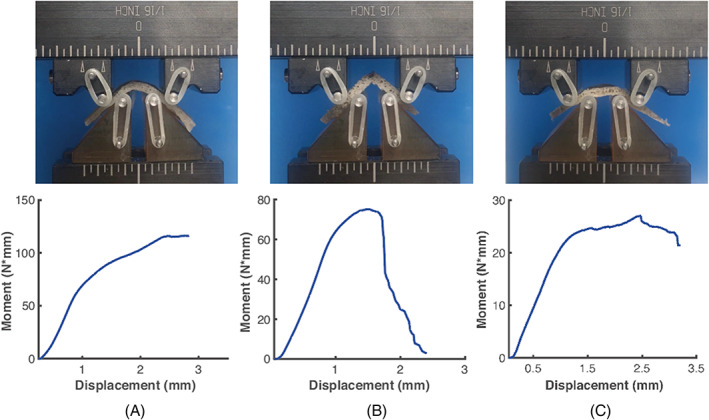
Vertebral endplates exhibited different modes of deformation and failure: (A) Uniform curvature across the bending span; (B) Breakage; and (C) Nonuniform curvature across the bending span. All images correspond to the end of the test. The image in A illustrates the displacement limit of the test, as further applied displacement would result in pinching of the specimen between the upper pins and bottom fixture. The moment‐displacement curves in A and B are only show the data before pinching
The apparent modulus and apparent yield stress were computed using linear elastic beam theory:
| (1) |
| (2) |
where k is the maximum slope of the moment‐displacement curve prior to any local maximum in the curve (red line in Figure 2D), is the moment just after this region of maximum slope (red triangle in Figure), L = 16 mm, , and b and h are the width and thickness of the central 16 mm of the specimen. The tissue‐level yield stress () was calculated at the apparent yield point, using , where is the minimum section modulus and was computed according to published methods32, 33 by considering all bone voxels (voxels above the threshold) within the 16 mm span in the μCT image.
Video taken of the mechanical tests was synchronized to the loading curve and used to compute ultimate and fracture strains. In the still frame corresponding to the ultimate point, the curvatures of upper and lower boundaries of the 16 mm span of the specimen were determined using edge detection and best‐fit circles (MATLAB) and then averaged. Ultimate strain (εu) was calculated as the distance between two edges divided by the average of the two circles' radii. For 25 specimens, the fracture strain (εf) was calculated using the same method for calculating the εu, except at the point in the test when an audible cracking noise occurred at the same time as a sudden drop bending moment. For some specimens, the fracture point coincided with the ultimate point, whereas for others, it occurred after the ultimate point. Due to the displacement limit of the test, the ultimate strain and fracture strain were not obtainable for all the specimens.
2.4. Measurements of tissue and ash densities
After mechanical testing, each specimen was gently cleaned with a water jet to remove the bone marrow and then weighed (Mettler AT 200; Mettler Toledo, Columbus, Ohio) in air and again in degassed water in order to calculate the tissue density (𝜌tissue) using Archimedes' principle. Specimens were then defatted in acetone for 12 hours and cut in half, and one half was retained for measurement of ash density. The tissue volume of this half was also calculated using Archimedes' principle and was then dried in a muffle furnace (Thermolyne Furnace 47900, Thermo Fisher Scientific, Waltham, Massachusetts) at 110°C for 2 hours to obtain the dry weight. The dried specimen was then put back to the furnace for another 14 hours under 650°C to obtain the ash weight. Ash fraction (p) and ash density (𝜌ash) were computed as the ratio of ash weight to dry weight and ash weight to tissue volume, respectively. Finally, the ash weight, water weight and organic weight were each computed as a percentage of the tissue weight.
2.5. Statistical analyses
In cases where two specimens were obtained from the same half vertebral body, the mean value over the two specimens was used in the statistical analyses. All properties except TMD, p, εu, and εf were log‐transformed to follow the normal distribution assumption of statistical models. Linear regression (JMP, SAS Institute) analysis was used to determine the dependence of: (a) mechanical properties on density and mineral content and (b) properties on age. In accordance with Hernandez et al,34 multiple regression analysis was also performed to test the dependence of apparent modulus and strength on both BV/TV and ash fraction. Pearson correlation analysis was used to describe the association between mechanical properties. Since properties of the vertebral endplates that come from the same donor cannot be assumed to be independent from each other, all of the above statistical analyses were performed separately for superior and inferior vertebral endplates separately. Subsequently, paired t‐tests were used to identify differences in properties between locations (ie, superior vs inferior). These comparisons were performed for endplates spanning the same intervertebral disc (ie, L3 superior vs L2 inferior)29 and, separately, for endplates spanning the same vertebral centrum (ie, L3 superior vs L3 inferior)24, 25 (Figure 1). For more general comparison of the difference between locations, Wilcoxon tests were used (and with no log transformation). Wilcoxon tests were also used to assess differences in vertebral endplate properties between sexes. For mechanical properties that were found by linear regression to depend on one or more measures of composition or structure, analysis of covariance (ANCOVA) was used to test whether the dependence differed between sexes. A significance level of 5% was used in all analyses. All data were examined for outliers, defined as more than 150% of the interquartile range either above the third quartile or below the first quartile. Outliers were checked to see if they were overly influential, meaning whether the results of any of the above statistical tests changed when the outlier was excluded.
3. RESULTS
Wide variations in vertebral endplate mechanical behavior were observed among specimens. For most of the mechanical properties, values ranged more than 10‐fold (Table 1). These large ranges were observed for specimens from both superior and inferior endplates, and few differences in properties between these two locations were found (Table 1). Different modes of deformation were also observed (Figure 3). Some specimens remained intact, with no visible fractures at the end of the test (Figure 3A,C), while others broke into two parts before reaching the displacement limit (Figure 3B). Different deformation scenarios were detected among the specimens in the former category: whereas some exhibited uniform curvatures across the 16 mm loading span (Figure 3A) others did not (Figure 3C).
TABLE 1.
Properties of superior and inferior vertebral endplate specimens tested in this study
| Location | ||
|---|---|---|
| Superior | Inferior | |
| Plate thickness (mm)a , b | 0.225 ± 0.073 (0.138, 0.457) | 0.265 ± 0.092 (0.134, 0.509) |
| 𝜌tissue (g/cm3) | 1.519 ± 0.107 (1.291, 1.753) | 1.498 ± 0.107 (1.265, 1.696) |
| BV/TV (−)a , b | 0.246 ± 0.070 (0.133, 0.432) | 0.296 ± 0.109 (0.118, 0.629) |
| BMD (g HA/cm3)a , b | 0.286 ± 0.074 (0.168, 0.484) | 0.337 ± 0.114 (0.132, 0.641) |
| TMD (g HA/cm3) | 0.998 ± 0.029 (0.925, 1.072) | 1.002 ± 0.028 (0.937, 1.058) |
| p(−) | 0.595 ± 0.084 (0.364, 0.779) | 0.607 ± 0.097 (0.369, 0.847) |
| 𝜌ash (g/cm3) | 0.780 ± 0.174 (0.413, 1.156) | 0.823 ± 0.171 (0.525, 1.354) |
| (MPa) | 178 ± 158 (46.0, 713) | 208 ± 177 (15.5, 879) |
| (MPa) | 3.48 ± 2.51 (0.94, 11.8) | 4.40 ± 3.45 (0.60, 14.3) |
| εu (−) | 0.065 ± 0.028 (0.016, 0.134) | 0.061 ± 0.027 (0.013, 0.116) |
| εf (−) | 0.079 ± 0.033 (0.020, 0.133) | 0.080 ± 0.019 (0.055, 0.121) |
| (MPa)c | 27.49 ± 11.60 (10.05, 56.42) | 38.26 ± 19.28 (6.359, 75.47) |
| Organic% | 36.1% ± 8.5% (19.2%, 57.3%) | 35.3% ± 9.7% (14.3%, 61.5%) |
| Mineral% | 52.7% ± 8.1% (31.8%, 67.9%) | 54.2% ± 8.8% (36.0%, 79.2%) |
| Water% | 11.2% ± 7.6% (0.9%, 36.2%) | 10.6% ± 6.2% (2.2%, 29.7%) |
Note: Data are presented as mean ± SD (minimum, maximum). 𝜌tissue, tissue density; BV/TV, bone volume fraction; BMD, bone mineral density; TMD, tissue mineral density; p, ash fraction; 𝜌ash, ash density; , apparent modulus; , apparent yield stress; εu, ultimate strain; εf, failure strain; , tissue yield stress.
P <.05 for superior vs inferior vertebral endplates, according to an unpaired comparison (Wilcoxon test).
P <.05 for superior vs inferior endplates when compared across the disc.
P <.05 for superior vs inferior endplates when compared within the same vertebral body.
Much of the variation in apparent mechanical properties could be explained by variations in BMD and BV/TV (Table 2). Both the apparent modulus and apparent yield stress increased with increasing BMD (Figure 4A,B). The ultimate strain and fracture strain decreased with increasing BMD for inferior specimens while no dependence was seen for superior specimens (Figure 4C). Similar results were found when these four mechanical properties were regressed against BV/TV rather than BMD (Table 2). Consistent with these relationships between mechanical properties and both BMD and BV/TV, apparent modulus was positively correlated with apparent yield stress and, for inferior specimens, negatively correlated with fracture strain (r = −.67, P = .02; Figure 5). None of the apparent mechanical properties were correlated with ultimate strain (Table 3) or depended on age (Table 2). Additionally, none of the relationships between mechanical properties and measures of structure or composition depended on sex, though inferior VEPs from male exhibited higher BV/TV, BMD, apparent modulus, and apparent yield stress (Table S1).
TABLE 2.
Coefficient of determination for univariate linear regressions of mechanical properties against age and measures of structure and composition
| Age | (MPa) | (MPa) | εu (−) | εf (−) | (MPa) | |
|---|---|---|---|---|---|---|
| Age |
S:.019 I: .012 |
S: .031 I: .029 |
S: .243* I: .060 |
S: .027 I: .023 |
S: .042 I: .022 |
|
| 𝜌tissue (g/cm3) |
S: .081 I: .048 |
S: .001 I: .005 |
S: .001 I: .002 |
S: .003 I: .098 |
S: .058 I: .110 |
S: .117 I: .008 |
| BV/TV (−) |
S: .019 I: .043 |
S: .501* I: .530* |
S: .406* I: .512* |
S: .089 I: .292* |
S: .284 I: .454* |
— |
| BMD (g HA/cm3) |
S: .023 I: .030 |
S: .517* I: .512* |
S: .495* I: .429* |
S: .126 I: .314* |
S: .278 I: .465* |
— |
| TMD (g HA/cm3) |
S: .017 I: .268* |
S: .043 I: .001 |
S: .011 I: .001 |
S: .021 I: .043 |
S: .009 I: .050 |
S: .027 I: .013 |
| p(−) |
S: .010 I: .022 |
S: .017 I: .005 |
S: .005 I: .002 |
S: .013 I: .021 |
S: .070 I: .137 |
S: .001 I: .001 |
| 𝜌ash (g/cm3) |
S: .022 I: .018 |
S: .018 I: .011 |
S: .014 I: .008 |
S: .016 I: .010 |
S: .034 I: .072 |
S: .013 I: .002 |
Note: Regressions were performed through a general linear model using log transformations of the data. S and I represent the superior and inferior vertebral endplate, respectively. 𝜌tissue, tissue density; BV/TV, bone volume fraction; BMD, bone mineral density; TMD, tissue mineral density; p, ash fraction; 𝜌ash, ash density; , apparent modulus; , apparent yield stress; εu, ultimate strain; εf, failure strain; , tissue yield stress.
P <.05.
FIGURE 4.
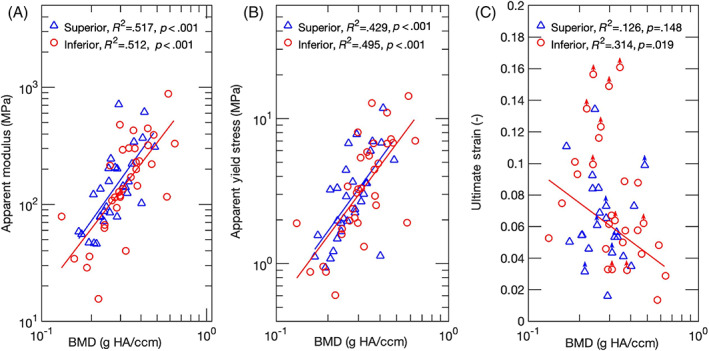
Log‐log plots for A, apparent modulus; and B, apparent yield stress as a function of BMD. Regression lines are shown where applicable. Both the apparent modulus and yield stress increased with increasing BMD, for both superior and inferior endplates. (C) Semi‐log plot for ultimate strain as a function of BMD. An inverse relationship was found for the inferior vertebral endplates only. Points labeled with an arrow correspond to specimens that did not reach their ultimate point before the end of the test. The points are position at the largest strain that was measured in the test. These points were not included in the statistical analyses
FIGURE 5.

(A) Log‐log plots for apparent yield stress against apparent modulus for superior and inferior vertebral endplates. A positive correlation was found for both superior (r = .934) and inferior (r = .965) specimens. (B) Semi‐log plot for fracture strain against apparent modulus. Only fracture strain of inferior vertebral endplate was negatively correlated with apparent modulus. Points labeled with an arrow correspond to specimens that did not reach their fracture point before the end of the test. The points are position at the largest strain that was measured in the test. These points were not included in the statistical analyses
TABLE 3.
Pearson correlation (r) mechanical properties
| (MPa) | (MPa) | εu (−) | |
|---|---|---|---|
| (MPa) |
S: .934* I: .965* |
— | — |
| εu (−) |
S: −.301 I: −.382 |
S: −.282 I: −.305 |
— |
| εf (−) |
S: −.450 I: −.671* |
S: −.278 I: −.719* |
S: .798* I: .900* |
Note: S and I represent the superior and inferior vertebral endplate, respectively. , apparent modulus; , apparent yield stress; εu, ultimate strain; εf, failure strain.
P <.05.
In contrast to the strong dependence of the mechanical properties of the vertebral endplate on BMD and BV/TV, little dependence on measures of tissue‐level density or ash density was found. None of the mechanical properties, including tissue yield stress, depended on any of the tissue‐level density measurements (Table 2). Adding ash fraction to the regression of apparent modulus and strength against BV/TV also did not improve the fit over that obtained with BV/TV alone (P >.091).
4. DISCUSSION
In light of the evidence that the vertebral endplate is a biomechanically critical structure, the goal of this study was to quantify its mechanical behavior. We found that BMD and BV/TV were strong predictors of many of the apparent‐level mechanical properties, including modulus, yield stress, and in the case of the inferior vertebral endplate, failure strains. We also found that both the apparent modulus and apparent yield stress were inversely correlated with the failure strains. Similar values of the mechanical properties were noted between superior and inferior vertebral endplates, despite some small differences in thickness, BMD, and BV/TV. In contrast to the strong dependence of apparent stiffness and strength on BMD and BV/TV, none of the mechanical properties depended on any of the tissue‐level density measurements. These results indicated that amount of bone tissue present, rather than the composition of that tissue, is the most important determinant of the mechanical behavior of the vertebral endplate.
This study has several strengths. Principally, isolating the vertebral endplate from the rest of the vertebra enabled us to measure its properties directly. In prior studies, indentation tests were performed along the superior or inferior surfaces of the vertebral body, and thus those results correspond to the combined mechanical behavior of the endplate and underlying bone tissue.17, 18, 20, 21, 22 Having isolated the vertebral endplate, we could also directly measure the tissue density, ash density, and ash fraction, all of which can influence the mechanical behavior,35, 36, 37, 38 rather than relying on estimates of density from computed tomography scans.24, 25, 27, 28, 29 The mechanical testing method used in this study has some additional advantages are that we used a physiological loading mode, flexion,10 and a length scale on par with that of the endplate deflections and deformities associated with vertebral fracture and disc degeneration.39, 40, 41, 42 Finally, we tested specimens from the central endplate, rather than the ring apophysis, given the high prevalence of vertebral fractures and other types of damage that occur in this region.9, 43, 44
This study also has limitations. First, some subchondral trabecular bone was present in the specimens because of the irregular topography of the boundary between the vertebral endplate and trabecular centrum and because of the difficulty in discerning this boundary during specimen preparation. However, the μCT images revealed very few, if any connections between the short struts of trabeculae that were present, indicating that they would have minimal contribution to the flexural behavior. Second, the definition of the apparent yield stress using a decrease in slope in the moment‐displacement curve involves some subjectivity. To mitigate bias, we also calculated the apparent yield stress using the “fully plastic bending moment” (Appendix). The two yield stresses were highly correlated with one another and exhibited very similar statistical results regarding the dependencies on density measures and correlations with apparent modulus, giving us confidence in the results we reported here. Third, the low flexural rigidity and appreciable ductility of many of the specimens meant that the displacement limit of the testing fixture was reached before these specimens reached their fracture strain or, in some cases, even ultimate strain. The limited number of data points reduced the power to detect differences in failure strains between superior and inferior endplates and to detect associations between the failure strains and other properties. Fourth, the bend tests were carried out at only one loading rate, and as such, the rate dependence of the vertebral endplate's mechanical behavior was not quantified. A final limitation to report is the age of donors was not uniformly distributed. Only two donors of the 39 donors were under age 60. Although the predominance of older donors in our data set makes the results meaningful for aging‐related conditions such as vertebral fracture, whether the results of this study extend to younger spines is unclear.
The lack of dependence of the measured mechanical properties on ash fraction (Table 2) was somewhat unexpected. Prior work has found associations between ash fraction and several mechanical properties, particularly stiffness and strength, of cortical bone, trabecular bone, and several other mineralized tissues.35, 37, 38 Hernandez et al. found that, for femoral cortical bone and vertebral trabecular bone, predictions of both strength and stiffness using BV/TV were improved by also using ash fraction.34 However, in our study, this was generally not the case (Appendix), even though both we and Hernandez et al found that BV/TV explained more of the variation in strength and stiffness than did the ash fraction. This discrepancy between current and previous results may be due to the larger range of BV/TV values examined by Hernandez et al. (range: 0.02∼0.84 vs 0.118∼0.629 in the current study), since they included both trabecular and cortical bone, and to differences in structure and composition between the vertebral endplate and bone in other skeletal sites. As compared to mean values reported for vertebral trabecular bone, trabecular bone in several other anatomic sites and cortical bone in the lower limb, the vertebral endplate exhibits lower tissue density and ash density, and similar ash fraction (Table 4), which altogether suggests higher water content. More detailed examination, using water, mineral, organic weight fractions, reveals a cohort of vertebral endplate specimens with high water fraction (Figure 6), but also a cohort with higher organic fraction than vertebral trabecular tissue, and overall a much larger compositional range than vertebral trabecular tissue. The vertebral endplate specimens also tended to exhibit lower mineral content than has been reported for cortical bone (Figure 6); although a comparison to the vertebral cortical shell in particular would be relevant, no such density measurements are available. These variations in aspects of composition other than ash fraction, as well as properties of the organic phase itself, such as collagen content and cross‐link density,60, 61 may contribute more to the mechanical properties of the vertebral endplate than does ash fraction.
TABLE 4.
Measures of density and ash fraction for the human vertebral endplate, human trabecular bone, and human cortical bone
| Properties | Bone type | Anatomic site | Mean ± SD | Range |
|---|---|---|---|---|
| Tissue density (g/cm3)a | Vertebral endplate | Vertebral body | 1.508 ± 0.107 | 1.265, 1.753 |
|
Trabecular bone |
Vertebral body45 | 1.93 ± 0.068 | NR | |
| Vertebral body46 | 2.01 ± 0.17 | 1.76, 2.41 | ||
| Proximal tibia46 | 2.08 ± 0.05 | 1.88, 2.13 | ||
| Vertebral body47 | 1.79 ± 0.04 | 1.42, 1.94 | ||
| Femoral neck46 | 2.11 ± 0.07 | 1.93, 2.20 | ||
| Greater trochanter46 | 2.09 ± 0.03 | 2.02, 2.15 | ||
| Cortical bone | Femoral diaphysis48 | 1.88 ± 0.05 | NR | |
| Femoral diaphysis49 | 1.84 ± 0.13 | 1.51, 2.00 | ||
| Tibial diaphysis48 | 1.80 ± 0.19 | NR | ||
| Tibial diaphysis50 | 1.86 ± 0.06 | 1.75, 1.95 | ||
| BV/TV (−) | Vertebral endplate | Vertebral body | 0.272 ± 0.096 | 0.118, 0.629 |
| Vertebral body29 | 0.36 ± 0.13 | 0.10, 0.68 | ||
|
Trabecular bone |
Vertebral body47 | 0.13 ± 0.01 | 0.05, 0.27 | |
| Vertebral body51 | 0.18 ± 0.06 | 0.05, 0.27 | ||
| Vertebral body46 | 0.09 ± 0.02 | 0.04, 0.18 | ||
| Proximal tibia46 | 0.11 ± 0.04 | 0.05, 0.20 | ||
| Femoral neck46 | 0.27 ± 0.07 | 0.12, 0.36 | ||
| Greater trochanter46 | 0.11 ± 0.02 | 0.07, 0.14 | ||
| Distal tibia52 | 0.15 ± 0.03 | NR | ||
|
Cortical bone |
Distal tibia52 | 0.88 ± 0.04 | NR | |
| Femoral neck53 | 0.89 ± 0.09 | 0.6, 0.98 | ||
| Femoral neck54 | 0.92 ± 0.03 | 0.84, 0.96 | ||
| Femoral diaphysis55 | 0.83 ± 0.11 | 0.24, 0.98 | ||
| Diaphysis from both tibia and femur56 | 0.83 ± 0.13 | 0.54, 0.97 | ||
| Ash fraction (−) | Vertebral endplate | Vertebral body | 0.601 ± 0.090 | 0.364, 0.847 |
|
Trabecular bone |
Vertebral body47 | 0.64 ± 0.02 | 0.59, 0.69 | |
| Vertebral body36 | 0.61 ± 0.02 | 0.53, 0.66 | ||
|
Cortical bone |
Femoral diaphysis36 | 0.58 ± 0.10 | 0.17, 0.66 | |
| Femoral diaphysis35 | 0.65 ± 0.02 | NR | ||
| Femoral diaphysis48 | 0.64 ± 0.01 | NR | ||
| Tibial diaphysis48 | 0.63 ± 0.02 | NR | ||
| Tibial diaphysis50 | 0.66 ± 0.02 | 0.61, 0.69 | ||
| Ash density (g/cm3) | Vertebral endplate | Vertebral body | 0.802 ± 0.173 | 0.413, 1.354 |
| Trabecular bone | Vertebral body47 | 1.01 ± 0.03 | 0.78, 1.17 | |
|
Cortical bone |
Femoral diaphysis49 | 1.10 ± 0.08 | 0.9, 1.21 | |
| Femoral diaphysis57 | 1.05 ± 0.14 | 0.64, 1.20 | ||
| Diaphysis from both tibia and femur56 | 0.99 ± 0.13 | 0.68, 1.22 | ||
| Children femoral shaft58 | 0.92 ± 0.15 | 0.58, 1.17 | ||
| Adult femoral and tibial shaft58 | 1.15 ± 0.07 | 1.00, 1.29 |
Abbreviation: NR, not reported by the study.
For cortical bone, the specimen volume used to calculate tissue density and ash density included pore space corresponding to vascular porosity as well as lacunar‐canalicular porosity.
FIGURE 6.
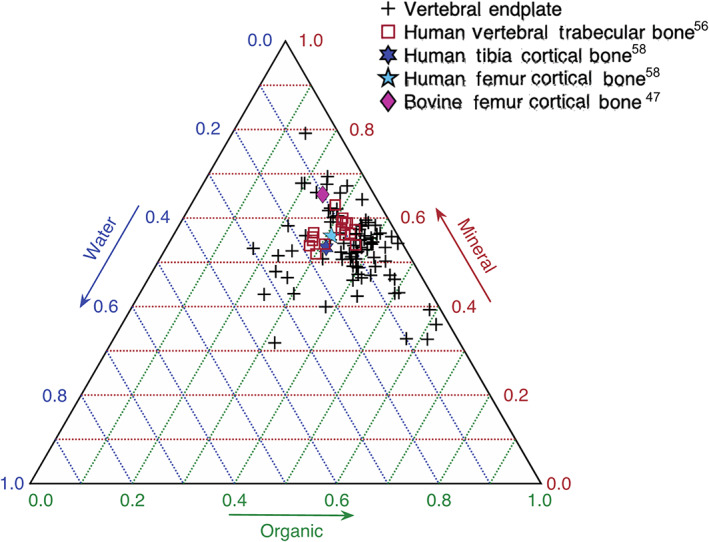
Ternary plot of the mineral, organic, and water weight fractions. +, Vertebral endplate;  , human vertebral trabecular bone47;
  , human tibia cortical bone48;
  , human femur cortical bone48;
  , bovine femur cortical bone59
The inverse trend between fracture strain and each of apparent modulus and yield stress suggests a potential compensatory mechanism in the vertebral endplate. With increased BV/TV and BMD, specimens from the inferior endplates exhibited higher stiffness and strength but lower fracture strain. This tradeoff has been found for cortical bone from different anatomic sites and species,38, 59 and it indicates that specimens that are more compliant and yield at lower stresses also tend to be able to sustain greater deformation before fracturing. This tradeoff may be particularly relevant in the vertebral endplate since it is the structural boundary between the intervertebral disc and the hematopoietic tissues within the vertebral body. Fracture of this boundary has been hypothesized to trigger inflammatory cascades that can hasten degeneration of the disc.11, 12, 13 Interestingly, the inverse trend between fracture strain and stiffness, strength, and density was not found for the superior vertebral endplates, even though the fracture strains of the superior vertebral endplate were as high as those in the inferior vertebral endplates.
Comparisons were made between superior and inferior endplates because of the suggestion that the former are more susceptible to failure.30 Age‐related vertebral fractures occur more frequently in the superior as compared to inferior half of the vertebra,26 though whether this asymmetry is related to differences in the endplate properties themselves has not been established. Our finding of a lack of any differences in mechanical properties between superior and inferior endplates suggests that there may be other causes, such as the properties of the adjacent trabecular bone,30 properties of the adjacent disc, and endplate curvature. Some differences in structural properties—BV/TV, BMD, and thickness—were found between superior and inferior specimens but only when the comparison was made across the disc as opposed to across the vertebral body (Table 1, Figure S2). These results suggest that the structure of the vertebral endplate may be intrinsic to the vertebral body rather than the motion segment or that there may be asymmetry along the superior‐inferior axis in how the vertebral endplate disc interacts with the disc.
Our findings suggest new possibilities for noninvasive assessment of vertebral fracture. Noninvasive estimation of vertebral strength and stiffness from density measurements is well established,62, 63 but thus far this approach has not been applied in a data‐driven manner for the vertebral endplate. Prior work has shown that the density (ie, BV/TV and BMD) of the endplate region is poorly correlated with the average density of the vertebral body, particularly in women.27 Our data suggest that measurement of the density of the vertebral endplate can be useful for a more accurate estimate of its mechanical behavior and, by extension, the mechanisms of vertebral fracture. The wide variation of the properties of the vertebral endplate compared to that seen in trabecular and cortical bone at other anatomic sites further supports this approach. For example, the ranges of BV/TV, apparent modulus and apparent yield stress we have found for the vertebral endplate are larger than those for trabecular bone and cortical bone at single anatomic sites (Table 4).35, 64 Using the mechanical properties obtain in the current study as input into finite element models of the vertebra may also improve the accuracy with which these models predict the where and how the vertebra deforms as it fractures.40, 65
The wide variations in vertebral endplate properties are consistent with the growing understanding that this region of the spine is highly metabolically active. Bone remodeling, mineralization of the cartilage endplate, and inflammatory and repair responses triggered by damage to tissues in the endplate region may all result in changes in composition, density, microstructure, and thickness of the vertebral endplate.29, 66, 67 Bone loss due to aging and changes in the mechanical behavior of the disc due to degeneration may also affect the mechanical environment of the vertebral endplate, which in turn could result in adaptive changes in the properties of this structure. However, despite the complexity of how these myriad factors may affect a variety of physical properties of the vertebral endplate, the findings of this study indicate that only a subset of these, BV/TV and BMD, which largely describe the amount of bone tissue present, are strongly predictive of the mechanical behavior. Further study of how this subset of properties is affected by metabolic and mechanobiological demands, as well as biological variables such as spinal level and sex, will likely lead to improved predictions of the risks and consequences of spine injuries and pathologies.
AUTHOR CONTRIBUTIONS
All contributed to project design. Yuanqiao Wu, Johnfredy Loaiza, Rohin Banerji, and Olivia Blouin all contributed to conduct experiments. Yuanqiao Wu processed data and performed statistical analyses. Yuanqiao Wu and Elise F. Morgan prepared manuscript. All contributed to manuscript revision.
CONFLICT OF INTEREST
The authors have no conflicts of interest to report.
Supporting information
Data S1 Supporting Information
ACKNOWLEDGMENTS
This work was supported with the grant number National Institutes of Health R01‐AR054620 and S10‐RR021072. The authors would also like to thank the Boston University Micro‐Computed Tomography Core Facility.
Because of the subjectivity in determine the end of elastic regime from moment to displacement curve, a second measure of the apparent yield stress was calculated. The tissue of the vertebral endplate was assumed to be perfectly plastic following yield, and the maximum moment was assumed to correspond to the “fully‐plastic bending moment.”68 was calculated as:
where b and h are the width and thickness of the central 16 mm of the specimen.
The mean ± SD of for superior and inferior vertebral endplates were 4.00 ± 2.80 (range: 1.28‐11.2 MPa) and 5.35 ± 3.83 MPa (0.84‐14.2 MPa), respectively. was highly correlated with (r >.950, P <.05) and, like , increased with increasing BV/TV and BMD for both superior and inferior specimens (). Adding ash fraction to the regression of against BV/TV was improved for inferior vertebral endplates only ( increased from .495 to .633 ( Figure S1).
Wu, Y., Loaiza, J., Banerji, R., Blouin, O., & Morgan, E. (2021). Structure‐function relationships of the human vertebral endplate. JOR Spine, 4(3), e1170. 10.1002/jsp2.1170
Funding information National Institutes of Health, Grant/Award Numbers: S10‐RR021072, R01‐AR054620
REFERENCES
- 1.Kerttula LI, Serlo WS, Tervonen OA, Pääkkö EL, Vanharanta HV. Post‐traumatic findings of the spine after earlier vertebral fracture in young patients: clinical and MRI study. Spine. 2000;25(9):1104‐1108. 10.1097/00007632-200005010-00011 [DOI] [PubMed] [Google Scholar]
- 2.Wáng YXJ, Che‐Nordin N, Deng M, et al. Osteoporotic vertebral deformity with endplate/cortex fracture is associated with higher further vertebral fracture risk: the Ms. OS (Hong Kong) study results. Osteoporos Int. 2019;30(4):897‐905. 10.1007/s00198-019-04856-4 [DOI] [PubMed] [Google Scholar]
- 3.Benneker LM, Heini PF, Alini M, Anderson SE, Ito K. 2004 young investigator award winner: vertebral endplate marrow contact channel occlusions and intervertebral disc degeneration. Spine. 2005;30(2):167‐173. 10.1097/01.brs.0000150833.93248.09 [DOI] [PubMed] [Google Scholar]
- 4.Melton LJ, Lane AW, Cooper C, Eastell R, O'Fallon WM, Riggs BL. Prevalence and incidence of vertebral deformities. Osteoporos Int. 1993;3(3):113‐119. 10.1007/BF01623271 [DOI] [PubMed] [Google Scholar]
- 5.O'Neill TW, Felsenbergp D, Varlow J, Kanis JA, Silman AJ. The European Vertebral Osteoporosis Study Group . The prevalence of vertebral deformity in European men and women: the European vertebral osteoporosis study. J Bone Miner Res. 1996;11(7):1010‐1018. 10.1002/jbmr.5650110719 [DOI] [PubMed] [Google Scholar]
- 6.Hasserius R, Redlund‐Johnell I, Mellström D, Johansson C, Nilsson BE, Johnell O. Vertebral deformation in urban Swedish men and women: prevalence based on 797 subjects. Acta Orthopaedica Scandinavica. 2001;72(3):273‐278. 10.1080/00016470152846619 [DOI] [PubMed] [Google Scholar]
- 7.Ortiz AO, Bordia R. Injury to the vertebral endplate‐disk complex associated with osteoporotic vertebral compression fractures. AJNR Am J Neuroradiol. 2011;32(1):115‐120. 10.3174/ajnr.A2223 [DOI] [PMC free article] [PubMed] [Google Scholar]
- 8.Jackman TM, Hussein AI, Adams AM, Makhnejia KK, Morgan EF. Endplate deflection is a defining feature of vertebral fracture and is associated with properties of the underlying trabecular bone. J Orthop Res. 2014;32(7):880‐886. 10.1002/jor.22620 [DOI] [PMC free article] [PubMed] [Google Scholar]
- 9.Jackman TM, Hussein AI, Curtiss C, et al. Quantitative, 3D visualization of the initiation and progression of vertebral fractures under compression and anterior flexion. J Bone Miner Res. 2016;31(4):777‐788. 10.1002/jbmr.2749 [DOI] [PMC free article] [PubMed] [Google Scholar]
- 10.Holmes AD, Hukins DW, Freemont AJ. End‐plate displacement during compression of lumbar vertebra‐disc‐vertebra segments and the mechanism of failure. Spine. 1993;18(1):128‐135. 10.1097/00007632-199301000-00019 [DOI] [PubMed] [Google Scholar]
- 11.Dudli S, Haschtmann D, Ferguson SJ. Fracture of the vertebral endplates, but not equienergetic impact load, promotes disc degeneration in vitro. J Orthop Res. 2012;30(5):809‐816. 10.1002/jor.21573 [DOI] [PubMed] [Google Scholar]
- 12.Dudli S, Ferguson SJ, Haschtmann D. Severity and pattern of post‐traumatic intervertebral disc degeneration depend on the type of injury. Spine. J. 2014;14(7):1256‐1264. 10.1016/j.spinee.2013.07.488 [DOI] [PubMed] [Google Scholar]
- 13.Wang J, Zhou Y, Zhang ZF, Li CQ, Zheng WJ, Liu J. Radiological study on disc degeneration of thoracolumbar burst fractures treated by percutaneous pedicle screw fixation. Eur Spine J. 2013;22(3):489‐494. 10.1007/s00586-012-2462-1 [DOI] [PMC free article] [PubMed] [Google Scholar]
- 14.Keaveny TM, Morgan EF, Niebur GL, Yeh OC. Biomechanics of trabecular bone. Annu Rev Biomed Eng. 2001;3(1):307‐333. 10.1146/annurev.bioeng.3.1.307 [DOI] [PubMed] [Google Scholar]
- 15.Dall'Ara E, Karl C, Mazza G, et al. Tissue properties of the human vertebral body sub‐structures evaluated by means of microindentation. J Mech Behav Biomed Mater. 2013;25:23‐32. 10.1016/j.jmbbm.2013.04.020 [DOI] [PubMed] [Google Scholar]
- 16.Roy ME, Rho JY, Tsui TY, Evans ND, Pharr GM. Mechanical and morphological variation of the human lumbar vertebral cortical and trabecular bone. J Biomed Mater Res. 1999;44(2):191‐197. [DOI] [PubMed] [Google Scholar]
- 17.Grant JP, Oxland TR, Dvorak MF. Mapping the structural properties of the lumbosacral vertebral endplates. Spine. 2001;26(8):889‐896. 10.1097/00007632-200104150-00012 [DOI] [PubMed] [Google Scholar]
- 18.Grant JP, Oxland TR, Dvorak MF, Fisher CG. The effects of bone density and disc degeneration on the structural property distributions in the lower lumbar vertebral endplates. J Orthop Res. 2002;20(5):1115‐1120. 10.1016/S0736-0266(02)00039-6 [DOI] [PubMed] [Google Scholar]
- 19.Hou Y, Yuan W. Influences of disc degeneration and bone mineral density on the structural properties of lumbar end plates. Spine J. 2012;12(3):249‐256. 10.1016/j.spinee.2012.01.021 [DOI] [PubMed] [Google Scholar]
- 20.Ordway NR, Lu YM, Zhang X, Cheng CC, Fang H, Fayyazi AH. Correlation of cervical endplate strength with CT measured subchondral bone density. Eur Spine J. 2007;16(12):2104‐2109. 10.1007/s00586-007-0482-z [DOI] [PMC free article] [PubMed] [Google Scholar]
- 21.Liu J, Hao L, Suyou L, et al. Biomechanical properties of lumbar endplates and their correlation with MRI findings of lumbar degeneration. J Biomech. 2016;49(4):586‐593. 10.1016/j.jbiomech.2016.01.019 [DOI] [PubMed] [Google Scholar]
- 22.Perey O. Fracture of the vertebral end‐plate in the lumbar spine: An experimental biomechanical investigation. Acta Orthopaedica Scandinavica. 1957;28(Sup25):1‐101. 10.3109/ort.1957.28.suppl-25.01 [DOI] [PubMed]
- 23.Oxland TR, Grant JP, Dvorak MF, Fisher CG. Effects of endplate removal on the structural properties of the lower lumbar vertebral bodies. Spine. 2003;28(8):771‐777. 10.1097/00007632-200304150-00008 [DOI] [PubMed] [Google Scholar]
- 24.Hulme PA, Boyd SK, Ferguson SJ. Regional variation in vertebral bone morphology and its contribution to vertebral fracture strength. Bone. 2007;41(6):946‐957. 10.1016/j.bone.2007.08.019 [DOI] [PubMed] [Google Scholar]
- 25.Zhao FD, Pollintine P, Hole BD, Adams MA, Dolan P. Vertebral fractures usually affect the cranial endplate because it is thinner and supported by less‐dense trabecular bone. Bone. 2009;44(2):372‐379. 10.1016/j.bone.2008.10.048 [DOI] [PubMed] [Google Scholar]
- 26.Jelsma RK, Kirsch PT, Rice JF, Jelsma LF. The radiographic description of thoracolumbar fractures. Surg Neurol. 1982;18(4):230‐236. 10.1016/0090-3019(82)90328-7 [DOI] [PubMed] [Google Scholar]
- 27.McKay ML, Jackman TM, Hussein AI, Guermazi A, Liu J, Morgan EF. Association of vertebral endplate microstructure with bone strength in men and women. Bone. 2020;131(2019):115147. 115–147. 10.1016/j.bone.2019.115147 [DOI] [PMC free article] [PubMed] [Google Scholar]
- 28.Rodriguez AG, Rodriguez‐Soto AE, Burghardt AJ, Berven S, Majumdar S, Lotz JC. Morphology of the human vertebral endplate. J Orthop Res. 2012;30(2):280‐287. 10.1002/jor.21513 [DOI] [PMC free article] [PubMed] [Google Scholar]
- 29.Zehra U, Robson‐Brown K, Adams MA, Dolan P. Porosity and thickness of the vertebral endplate depend on local mechanical loading. Spine. 2015;40(15):1173‐1180. 10.1097/BRS.0000000000000925 [DOI] [PubMed] [Google Scholar]
- 30.Wang Y, Battié MC, Boyd SK, Videman T. The osseous endplates in lumbar vertebrae: thickness, bone mineral density and their associations with age and disk degeneration. Bone. 2011;48(4):804‐809. 10.1016/j.bone.2010.12.005 [DOI] [PubMed] [Google Scholar]
- 31.Doube M, Klosowski MM, Arganda‐Carreras I, et al. BoneJ: free and extensible bone image analysis in ImageJ. Bone. 2010;47(6):1076‐1079. 10.1016/j.bone.2010.08.023 [DOI] [PMC free article] [PubMed] [Google Scholar]
- 32.Morgan EF, Mason ZD, Chien KB, et al. Micro‐computed tomography assessment of fracture healing: relationships among callus structure, composition, and mechanical function. Bone. 2009;44(2):335‐344. 10.1016/j.bone.2008.10.039 [DOI] [PMC free article] [PubMed] [Google Scholar]
- 33.Levenston ME, Beaupré GS, van der Meulen MCH. Improved method for analysis of whole bone torsion tests. J Bone Miner Res. 1994;9(9):1459‐1465. 10.1002/jbmr.5650090919 [DOI] [PubMed] [Google Scholar]
- 34.Hernandez CJ, Beaupré GS, Keller TS, Carter DR. The influence of bone volume fraction and ash fraction on bone strength and modulus. Bone. 2001;29(1):74‐78. 10.1016/S8756-3282(01)00467-7 [DOI] [PubMed] [Google Scholar]
- 35.Keller TS, Mao Z, Spengler DM. Young's modulus, bending strength, and tissue physical properties of human compact bone. J Orthop Res. 1990;8(4):592‐603. 10.1002/jor.1100080416 [DOI] [PubMed] [Google Scholar]
- 36.Keller TS. Predicting the compressive mechanical behavior of bone. J Biomech. 1994;27(9):1159‐1168. 10.1016/0021-9290(94)90056-6 [DOI] [PubMed] [Google Scholar]
- 37.Currey JD. The mechanical consequences of variation in the mineral content of bone. J Biomech. 1969;2(1):1‐11. 10.1016/0021-9290(69)90036-0 [DOI] [PubMed] [Google Scholar]
- 38.Currey JD. Effects of differences in mineralization on the mechanical properties of bone. Philos Trans R Soc Lond B Biol Sci. 1984;304(1121):509‐518. 10.1098/rstb.1984.0042 [DOI] [PubMed] [Google Scholar]
- 39.Stefanakis M, Luo J, Pollintine P, Dolan P, Adams MA. ISSLS prize winner: mechanical influences in progressive intervertebral disc degeneration. Spine. 2014;39(17):1365‐1372. 10.1097/BRS.0000000000000389 [DOI] [PubMed] [Google Scholar]
- 40.Jackman TM, DelMonaco AM, Morgan EF. Accuracy of finite element analyses of CT scans in predictions of vertebral failure patterns under axial compression and anterior flexion. J Biomech. 2016;49(2):267‐275. 10.1016/j.jbiomech.2015.12.004 [DOI] [PMC free article] [PubMed] [Google Scholar]
- 41.Wang XR, Xu FR, Huang QL, Wáng YXJ. Radiological features of traumatic vertebral endplate fracture: an analysis of 194 cases with 263 vertebral fractures. Chin Med J (Engl). 2020;133(22):2696‐2702. 10.1097/CM9.0000000000000919 [DOI] [PMC free article] [PubMed] [Google Scholar]
- 42.Choi W, Song S, Chae S, Ko S. Comparison of the extent of degeneration among the normal disc, immobilized disc, and immobilized disc with an endplate fracture. Clin Orthop Surg. 2017;9(2):193‐199. 10.4055/cios.2017.9.2.193 [DOI] [PMC free article] [PubMed] [Google Scholar]
- 43.Berg‐Johansen B, Fields AJ, Liebenberg EC, Li A, Lotz JC. Structure‐function relationships at the human spinal disc‐vertebra interface. J Orthop Res. 2018;36(1):192‐201. 10.1002/jor.23627 [DOI] [PMC free article] [PubMed] [Google Scholar]
- 44.Chen L, Battié MC, Yuan Y, Yang G, Chen Z, Wang Y. Lumbar vertebral endplate defects on magnetic resonance images: prevalence, distribution patterns, and associations with back pain. Spine J. 2020;20(3):352‐360. 10.1016/j.spinee.2019.10.015 [DOI] [PubMed] [Google Scholar]
- 45.Snyder BD, Piazza S, Edwards WT, Hayes WC. Role of trabecular morphology in the etiology of age‐related vertebral fractures. Calci Tissue Int. 1993;53(1):S14‐S22. 10.1007/BF01673396 [DOI] [PubMed] [Google Scholar]
- 46.Morgan EF, Bayraktar HH, Keaveny TM. Trabecular bone modulus‐density relationships depend on anatomic site. J Biomech. 2003;36(7):897‐904. 10.1016/S0021-9290(03)00071-X [DOI] [PubMed] [Google Scholar]
- 47.Galante J, Rostoker W, Ray RD. Physical properties of trabecular bone. Calcif tissue Res. 1970;5(3):236‐246. 10.1007/BF02017552 [DOI] [PubMed] [Google Scholar]
- 48.Yeni YN, Brown CU, Norman TL. Influence of bone composition and apparent density on fracture toughness of the human femur and tibia. Bone. 1998;22(1):79‐84. 10.1016/S8756-3282(97)00227-5 [DOI] [PubMed] [Google Scholar]
- 49.Schileo E, Dall'Ara E, Taddei F, et al. An accurate estimation of bone density improves the accuracy of subject‐specific finite element models. J Biomech. 2008;41(11):2483‐2491. 10.1016/j.jbiomech.2008.05.017 [DOI] [PubMed] [Google Scholar]
- 50.Snyder SM, Schneider E. Estimation of mechanical properties of cortical bone by computed tomography. J Orthop Res. 1991;9(3):422‐431. 10.1002/jor.1100090315 [DOI] [PubMed] [Google Scholar]
- 51.Cendre E, Mitton D, Roux JP, et al. High‐resolution computed tomography for architectural characterization of human lumbar cancellous bone: relationships with histomorphometry and biomechanics. Osteoporos Int. 1999;10(5):353‐360. 10.1007/s001980050240 [DOI] [PubMed] [Google Scholar]
- 52.Ohlsson C, Sundh D, Wallerek A, et al. Cortical bone area predicts incident fractures independently of areal bone mineral density in older men. J Clin Endocrinol Metab. 2017;102(2):516‐524. 10.1210/jc.2016-3177 [DOI] [PubMed] [Google Scholar]
- 53.Boughton OR, Ma S, Cai X, et al. Computed tomography porosity and spherical indentation for determining cortical bone millimetre‐scale mechanical properties. Sci Rep. 2019;9(1):1‐15. 10.1038/s41598-019-43686-6 [DOI] [PMC free article] [PubMed] [Google Scholar]
- 54.Chen H, Zhou X, Shoumura S, Emura S, Bunai Y. Age‐ and gender‐dependent changes in three‐dimensional microstructure of cortical and trabecular bone at the human femoral neck. Osteoporos Int. 2010;21(4):627‐636. 10.1007/s00198-009-0993-z [DOI] [PubMed] [Google Scholar]
- 55.Iori G, Heyer F, Kilappa V, et al. BMD‐based assessment of local porosity in human femoral cortical bone. Bone. 2018;114:50‐61. 10.1016/j.bone.2018.05.028 [DOI] [PubMed] [Google Scholar]
- 56.Tassani S, Öhman C, Baruffaldi F, Baleani M, Viceconti M. Volume to density relation in adult human bone tissue. J Biomech. 2011;44(1):103‐108. 10.1016/j.jbiomech.2010.08.032 [DOI] [PubMed] [Google Scholar]
- 57.Kaneko TS, Pejcic MR, Tehranzadeh J, Keyak JH. Relationships between material properties and CT scan data of cortical bone with and without metastatic lesions. Med Eng Phys. 2003;25(6):445‐454. 10.1016/S1350-4533(03)00030-4 [DOI] [PubMed] [Google Scholar]
- 58.Öhman C, Baleani M, Pani C, et al. Compressive behaviour of child and adult cortical bone. Bone. 2011;49(4):769‐776. 10.1016/j.bone.2011.06.035 [DOI] [PubMed] [Google Scholar]
- 59.Currey JD. The design of mineralised hard tissues for their mechanical functions. J Exp Biol. 1999;202(23):3285‐3294. 10.1242/jeb.202.23.3285 [DOI] [PubMed] [Google Scholar]
- 60.Zhang Y, McNerny EG, Terajima M, et al. Loss of BMP signaling through BMPR1A in osteoblasts leads to greater collagen cross‐link maturation and material‐level mechanical properties in mouse femoral trabecular compartments. Bone. 2016;88:74‐84. 10.1016/j.bone.2016.04.022 [DOI] [PMC free article] [PubMed] [Google Scholar]
- 61.Banse X, Sims TJ, Bailey AJ. Mechanical properties of adult vertebral cancellous bone: correlation with collagen intermolecular cross‐links. J Bone Miner Res. 2002;17(9):1621‐1628. 10.1359/jbmr.2002.17.9.1621 [DOI] [PubMed] [Google Scholar]
- 62.Kanis JA, Johnell O. Requirements for DXA for the management of osteoporosis in Europe. Osteoporos Int. 2005;16(3):229‐238. 10.1007/s00198-004-1811-2 [DOI] [PubMed] [Google Scholar]
- 63.Kopperdahl DL, Morgan EF, Keaveny TM. Quantitative computed tomography estimates of the mechanical properties of human vertebral trabecular bone. J Orthop Res. 2002;20(4):801‐805. 10.1016/S0736-0266(01)00185-1 [DOI] [PubMed] [Google Scholar]
- 64.Morgan EF, Keaveny TM. Dependence of yield strain of human trabecular bone on anatomic site. J Biomech. 2001;34(5):569‐577. 10.1016/S0021-9290(01)00011-2 [DOI] [PubMed] [Google Scholar]
- 65.Pahr DH, Zysset PK. A comparison of enhanced continuum FE with micro FE models of human vertebral bodies. J Biomech. 2009;42(4):455‐462. 10.1016/j.jbiomech.2008.11.028 [DOI] [PubMed] [Google Scholar]
- 66.Bernick S, Cailliet R. Vertebral end‐plate changes with aging of human vertebrae. Spine. 1982;7(2):97‐102. 10.1097/00007632-198203000-00002 [DOI] [PubMed] [Google Scholar]
- 67.Luoma K, Vehmas T, Kerttula L, Grönblad M, Rinne E. Chronic low back pain in relation to Modic changes, bony endplate lesions, and disc degeneration in a prospective MRI study. Eur Spine J. 2016;25(9):2873‐2881. 10.1007/s00586-016-4715-x [DOI] [PubMed] [Google Scholar]
- 68.Gere J, Goodno B. Stresses in Beams. Mechanics of Materials. 7th ed.; 1120 Birchmount Road, Toronto ON M1K 5G4 Canada: Cengage Learning; 2018:504‐510. [Google Scholar]
Associated Data
This section collects any data citations, data availability statements, or supplementary materials included in this article.
Supplementary Materials
Data S1 Supporting Information