

Abstract
Motivation
Facing the increasing gap between high-throughput sequence data and limited functional insights, computational protein function annotation provides a high-throughput alternative to experimental approaches. However, current methods can have limited applicability while relying on protein data besides sequences, or lack generalizability to novel sequences, species and functions.
Results
To overcome aforementioned barriers in applicability and generalizability, we propose a novel deep learning model using only sequence information for proteins, named Transformer-based protein function Annotation through joint sequence–Label Embedding (TALE). For generalizability to novel sequences we use self-attention-based transformers to capture global patterns in sequences. For generalizability to unseen or rarely seen functions (tail labels), we embed protein function labels (hierarchical GO terms on directed graphs) together with inputs/features (1D sequences) in a joint latent space. Combining TALE and a sequence similarity-based method, TALE+ outperformed competing methods when only sequence input is available. It even outperformed a state-of-the-art method using network information besides sequence, in two of the three gene ontologies. Furthermore, TALE and TALE+ showed superior generalizability to proteins of low similarity, new species, or rarely annotated functions compared to training data, revealing deep insights into the protein sequence–function relationship. Ablation studies elucidated contributions of algorithmic components toward the accuracy and the generalizability; and a GO term-centric analysis was also provided.
Availability and implementation
The data, source codes and models are available at https://github.com/Shen-Lab/TALE.
Supplementary information
Supplementary data are available at Bioinformatics online.
1 Introduction
The explosive growth of protein sequence data in the past decade, largely thanks to next-generation sequencing technologies, has provided enormous information and opportunities for biological and pharmaceutical research. In particular, the complex and intricate relationship between sequences, structures and functions of proteins is fascinating. As experimental function annotation of proteins is often outpaced by sequence determination, computational alternatives have become both fundamental in exploring the sequence–function relationship and practical in predicting functions for growing un-annotated sequences (including de novo designs). According to the 2020_01 release of UniProt (UniProtConsortium, 2019), there were around 5.6×10⁵ non-redundant sequences manually annotated in Swiss-Prot but over two orders of magnitude more (around 1.8×10⁸) sequences awaiting full manual annotation in TrEMBL.
Protein functions are usually described based on Gene Ontology (GO), the world’s largest source of systematic representation of gene functions (Ashburner et al., 2000). There are more than 40 000 GO terms across three domains: Molecular Function Ontology (MFO), Biological Process Ontology (BPO) and Cellular Component Ontology (CCO). Within each ontology, GO terms are structured hierarchically as a directed graph with a root node. Each protein can be annotated with more than one GO term on three ontologies (thus a multi-label classification problem). If a protein is annotated with one GO term, then can also be annotated by all corresponding ancestral GO terms. Such a hierarchical constraint is present in many other ontologies as well, such as text ontology (Baker and Korhonen, 2017) and image ontology (Deng et al., 2009).
From the perspective of input type, computational methods for protein function annotation can be classified as sequence- (Fa et al., 2018; Kulmanov and Hoehndorf, 2020; Zhou et al., 2019a), structure- (Yang et al., 2015), network- (Fan et al., 2020; Gligorijević et al., 2018; Kulmanov et al., 2018; You et al., 2019; Zhang et al., 2019) and literature-based (Kahanda and Ben-Hur, 2017; You et al., 2018a), whereas all but sequence-only methods have limited scope of usage due to data availability. Specifically, although structural information is important for understanding protein functions (e.g. Stewart et al., 1998; Wrapp et al., 2020), it is often not readily available: 0.01% of the TrEMBL sequences (UniProt 2020_01) have corresponding structural entries in Protein Data Bank (PDB), and this ratio increases to 1% if considering structural models in SWISS-MODEL Repository (SWR). Similarly, only around 7% of the TrEMBL sequences have interaction entries in STRINGdb (Szklarczyk et al., 2016), not to mention that the network information can be noisy and incomplete. We note that structure, network, and literature data can be especially missing for novel sequences where computational function annotation is needed the most. We therefore focus on sequence-based methods in this study.
Predicting protein function from sequence alone is a challenging problem where each sequence can belong to multiple labels and labels are organized hierarchically. Critical Assessment of protein Function Annotation (CAFA) has provided an enabling platform for method development (Friedberg and Radivojac, 2017; Jiang et al., 2016; Radivojac et al., 2013; Zhou et al., 2019b) and witnessed still-limited power or scope of current methods. Sequence similarity-based methods (Buchfink et al., 2015; Jones et al., 2005) leverage sequence homology, although their success is often limited to homologues and alignments to detect homology can be still costly. Recently, deep learning has emerged as a promising approach to improve the accuracy (Fan et al., 2020; Gligorijević et al., 2018; Kulmanov et al., 2018; Kulmanov and Hoehndorf, 2020; Rifaioglu et al., 2019; Zhang et al., 2019), where sequences are often inputs/features and GO terms are labels. However, as deep learning is a data-hungry technique, these methods often have to get rid of a large number of GO terms (labels) with few annotations, leading to narrow applicability. For instance, DeepGOPlus (Kulmanov and Hoehndorf, 2020) only considered over 5000 GO terms with at least 50 annotated sequences each, which only accounts for less than 12% of all GO terms.
We set out to overcome aforementioned barriers and boost the generalizability to sequences with low similarity as well as unseen or rarely seen functions (also known as tail labels) compared to the training data. To that end, we propose a novel approach named Transformer-based protein function Annotation through joint sequence–Label Embedding (TALE). Our contributions are as follows. First, TALE replaces previously used convolutional neural networks (CNN) with self-attention-based transformers (Vaswani et al., 2017) which have made a major breakthrough in natural language processing and recently in protein sequence embedding (Duong et al., 2020; Elnaggar et al., 2020; Rives et al., 2020). Compared to CNN, transformers can deal with global dependencies within the sequence in just one layer, which helps detect global sequence patterns for function prediction much easier than CNN-based methods do. Second, TALE jointly embeds sequence inputs/features and hierarchical function labels (GO terms) into a latent space. By considering similarities among function labels and sequence features, TALE can easily deal with tail labels. Third, unlike previous methods that only consider GO terms as flat labels and enforce hierarchy ad hoc after training, TALE considers the hierarchy among labels through regularization during training. Last, we propose TALE+, by using an ensemble of top three TALE models and a sequence similarity-based method, DIAMOND (Buchfink et al., 2015), in convex combination (similar to DeepGOPlus) to reach the best of both worlds.
Over the CAFA3 test set, TALE+ outperformed six competing methods including GOLabeler (You et al., 2018b), the top performer in CAFA3 for two of the three ontologies. Over a more recent and complex test set, TALE+ outperformed all other methods including NetGO (You et al., 2019), the upgraded version of GOLabeler (You et al., 2018b) in all three ontologies when only sequence information is used. Importantly, TALE and TALE+ significantly improved against state-of-the-art methods in challenging cases where test proteins are of low similarity (in sequence, species and label) to training examples. The results prove that our model can generalize well to novel sequences, novel species and novel functions.
The rest of the article is organized as follows. We will first discuss in Methods the dataset used in the study. We will then introduce TALE and TALE+ models in details besides baselines and end the section with evaluation metrics. We will start the Results section with overall performance comparison. We will then delve into the analysis of model generalizability in sequence, species and function. Lastly, we will report an ablation study to delineate the major algorithm contributors to TALE’s improved accuracy and improved generalizability; and we will report GO term-centric analysis of TALE+ predictions.
2 Materials and methods
2.1 Datasets
In this study we consider two annotation time-split datasets: the standard CAFA3 dataset (Zhou et al., 2019b) and our curated dataset. The CAFA3 dataset is used for wider comparison with community performance. Our curated dataset, larger and more updated, is used for controlled comparison and in-depth analysis such as generalizability analysis, ablation study and term-centric assessment.
CAFA3 dataset. We download the CAFA3 dataset, which includes a training set and a (no-knowledge) test set with experimental annotations published before September 2016 and between September 2016 and November 2017, respectively. For hyper-parameter tuning we randomly split 10% from the training set to be the validation set (thus training and validation sets are not time-split here). The sequence statistics of the CAFA3 dataset and its splits are provided in Table 1. Ontologies here include the molecular function ontology (MFO), biological process ontology (BPO) and cellular component ontology (CCO).
Table 1.
Statistics of sequences and GO terms in various ontologies and splits
| Dataset | Statistics | MFO | BPO | CCO |
|---|---|---|---|---|
| #Seq in training set | 32 499 | 48 150 | 45 537 | |
| #Seq in validation set | 3611 | 5350 | 5059 | |
| CAFA3 | #Seq in Train. + Val. | 36 110 | 53 500 | 50 596 |
| #Seq in test set | 1137 | 2392 | 1265 | |
| #GO terms | 6239 | 19 462 | 2434 | |
| #Seq in training set | 34 996 | 51 345 | 49 957 | |
| #Seq in validation set | 3327 | 2861 | 2300 | |
| Ours | #Seq in Train. + Val. | 38 323 | 54 206 | 52 257 |
| #Seq in test set | 1916 | 2836 | 2084 | |
| #Seq in test set without net info. | 1140 | 1743 | 1189 | |
| #GO terms | 6381 | 19 939 | 2574 |
Our dataset. We download the UniProtKB/Swiss-Prot dataset release-2015_12 (last modified on January 20, 2016), release-2017_12 (last modified on January 30, 2018) and the latest release-2020_05 (last modified on December 2, 2020). Consistent with CAFA protocols (Zhou et al., 2019b), only sequences with high-quality function annotations are retained, i.e. those with at least one annotation within the following 8 experimental evidence codes: EXP, IDA, IPI, IMP, IGI, IEP, TAS and IC. We use the remaining sequences annotated by January 20, 2016, since January 30, 2018, and between (but not including) the two dates as training, test and validation sets, respectively. And we remove any test sequence that exists in the training or validation set (100% sequence identity). The sequence statistics of our curated dataset and its splits are also provided in Table 1.
For either dataset, we train all models on the corresponding training set and tune their hyperparameters using the validation set. We then retrain models under their optimal hyperparameters, using both the training and the validation sets, and assess them on the corresponding test set.
2.1.1. Hierarchical relationships between GO terms
We download the identities and the hierarchical relationships between function labels (GO terms) from Gene Ontology (Ashburner et al., 2000)—‘go-basic’ release 2016-06-01 and 2020-12-08 for CAFA3 and our dataset, respectively. We consider ‘is a’ and ‘part of’ relationships in all three ontologies: Molecular Function Ontology (MFO), Biological Process Ontology (BPO) and Cellular Component Ontology (CCO); and do not consider cross-ontology relationships for now. In this way we obtain three separate ontologies, each of whose topology is a directed acyclic graph (DAG). For each annotation in each ontology, we additionally propagate annotations all the way from the corresponding GO term to the root node. Finally, those GO terms without a single annotated sequence are removed and not considered in this study. We note that other studies could remove GO terms with less than 10, 50 or even 250 annotated sequences and consider much less GO terms than we do. The statistics of GO terms on the two datasets over three ontologies are shown in Table 1.
2.2 TALE and TALE+
We will describe the details of our methods in this subsection. The overall architecture of TALE is shown in Figure 1. The model has two inputs: a protein sequence and the label matrix (for capturing hierarchical relationships among all GO terms). It is worth mentioning that the label matrix is a constant matrix for a given ontology, thus being fixed during both stages of training and inference. The model itself consists of feature (sequence) embedding, label (function) embedding, joint similarity modules, as well as fully connected and output layers. We will introduce these components in the following subsections.
Fig. 1.
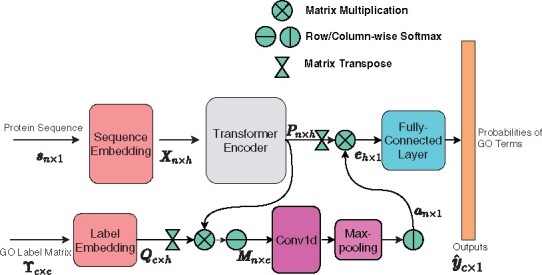
The architecture of TALE. Note that the GO label matrix is fixed for each ontology
Notations. We use upper-case boldfaced letters to denote a matrix (e.g. X), lower-case boldfaced letters to denote a vector (e.g. x) and lower-case letters to denote a scalar (e.g. x). We use subscripts of a matrix to denote a specific row, column or element (e.g. Xi for the ith row of X; for the ith column; and Xi,j for the entry in the ith row and the jth column of X). We also use subscripts to denote scalar components of a vector (e.g. xi for the ith entry of the vector x). We use superscript T on a matrix to represent its transpose.
2.2.1. Sequence embedding
Let denote the set of 20 standard amino acids, 5 non-standard amino acids (‘B’,‘O’,‘U’,‘X’,‘Z’) and the padding symbol. For a given input protein sequence of length n, we embed each character (residue) into an h-dimensional continuous latent space through a trainable lookup matrix and positional embedding, as described in Vaswani et al. (2017). The embedded matrix is fed through a transformer encoder that consists of multiple multi-head attention layers. The advantage of such ‘self-attention’ layers compared to convolution layers is that self-attention can easily and quickly capture long-term dependencies within a whole sequence, whereas convolution can only capture dependencies of residues within neighborhoods determined by convolutional kernels. We denote the output matrix of the transformer encoder with , where h is the aforementioned hidden dimension.
2.2.2. Label embedding
For each GO term (label) i in a given ontology, we embed it into a c-dimensional binary vector ϒi∈{0,1}1×c where c is the total number of labels, and the jth element is only non-zero and 1 when the column GO term j is GO term i or its ancestor. In this way, we embed all GO terms in the ontology with a label matrix ϒ∈{0,1}c×c whose ith row ϒi is the embedding of label i. When ordering column GO terms j, we use depth-first topological sorting for each basic ontology (a DAG) and create a linear order of GO terms (nodes) where a parent node is before its child nodes. In practice, our model’s output (predicted probability vector for all labels i) is invariant to the column order of ϒ [see Supplementary Section S3 of the Supporting Information (SI)].
Similar to the sequence embedding, we use a trainable lookup matrix to encode as , where
| (1) |
Unlike sequence input, the label matrix ϒ is fixed for each ontology and thus not needed to be further encoded using a transformer encoder.
2.2.3. Joint sequence–label similarity
We inspect the contributions of individual amino acids to individual function labels, by calculating the matrix product between P and Q to measure the joint similarity between the sequence and the label:
| (2) |
where the softmax is row-wise. suggests the ‘closeness’ or similarity score between amino acid i and label j. For each amino acid i, we further consider the contributions from other amino acids, by applying a 1D convolutional layer to M (along the row direction with the columns as channels), followed by a max-pooling layer. The output of the max-pooling layer is first normalized, and then used for weighting the sequence encoding matrix P:
| (3) |
where is the output of the max-pooling after column-wise softmax.
2.2.4. Fully connected and output layers
The output of the joint similarity module, , would go through two fully connected (FC) layers, with the sigmoid activation function at the second FC layer. The output of the model is the predicted probabilities for individual GO terms in the ontology, where the ith component is the predicted probability of label i for a given input sequence.
2.2.5. Loss and hierarchical regularization
To train model parameters, we first consider the binary cross-entropy loss:
| (4) |
However, if we only use , trained models may make predictions violating the hierarchical constraint of function annotation. For instance, the predicted score (probability) of a child GO term may be larger than those of its ancestors. To mitigate such hierarchical violation, we additionally introduce an additional, a hierarchical regularization term:
| (5) |
where E is the set of all edges in the ontology graph, and (i, j) is one edge in E where node i and j are the parent and the child, respectively. Therefore, our overall loss function is a weighted sum of both terms: , where λ, the regularization constant to control the balance between the two terms, is treated as a hyper-parameter and tuned along with other hyper-parameters using the validation set.
2.2.6. Hyperparameter tuning and unsupervised pre-training
The hyperparameters include those for the transformer architecture (number of layers, hidden dimension and number of heads) and training (learning rate and regularization factor λ). They are grid-searched and tuned according to the validation-set performance (Fmax). Except λ, hyperparameters’ candidate values follow the original transformer (Vaswani et al., 2017) or its lighter versions (due to limited computational resources). λ is tuned on grids between 0 and 100 in two stages. More details can be found in Supplementary Section S1.2. The candidate and optimal values of all hyperparameters can be found in Supplementary Tables S1 and S2, respectively. When other hyperparameters are fixed at the optimal values, the best validation performances are plateaued for λ between 0.1 and 1, whereas inferior performances are found for λ = 0 or λ = 100.
We additionally include unsupervised pre-training as an option so that a large amount of unlabeled sequences (specifically, over 49 million UniRef50 sequences) can be exploited. For each hyperparameter combination, the pre-trained transformer encoder’s parameters provide ‘warm’ starting points during supervised training. More details can be found in Supplementary Section S1.1. Interestingly, pre-training was not found to improve validation Fmax (Supplementary Fig. S2) and thus not used thereinafter (Supplementary Section S1.2).
2.2.7. Ensemble model of TALE+
So far we have introduced all components of TALE. In order to reduce the variance of predicted scores and their generalization errors, we use the simple average of the outputs from multiple models (corresponding to top-K hyperparameter combinations) as the final TALE predictions (see details in Supplementary Section S1.2). The ensemble size K is tuned based on the validation set and is set to be 3 (3), 2 (3) and 2(3) on MFO, BPO and CCO, respectively, for the CAFA3 (our) dataset. Their corresponding hyperparameter values are reported in Supplementary Table S2.
Similar to DeepGOPlus (Kulmanov and Hoehndorf, 2020), we further use a convex combination of TALE (the simple average) and DIAMONDScore (Buchfink et al., 2015) as final outputs of TALE+:
| (6) |
where is from the ith best TALE model based on the validation set. The choice of the sequence alignment program was not optimized for accuracy but adopted for its much faster speed and similar sensitivity compared to BLAST. After tuning on the validation set, the best αs for three ontologies were set to be 0.4 for MFO, 0.4 for BPO and 0.6 for CCO in the CAFA3 dataset, and 0.4 for MFO, 0.5 for BPO and 0.6 for CCO in our dataset. TALE can be regarded as a special case of TALE+ when α = 1.
2.3 Experiment details
We compare TALE and TALE+ to six competing methods, including baselines, latest published methods and top performers in CAFA. They include a naive approach using background frequency of GO terms (Zhou et al., 2019b); sequence similarity-based DIAMONDScore (Buchfink et al., 2015); deep learning-based DeepGO (with network information) (Kulmanov et al., 2018) and recent extensions (without network information) DeepGOCNN and DeepGOPlus (DeepGOCNN + DIAMONDScore) (Kulmanov and Hoehndorf, 2020); NetGO (You et al., 2019) that merges the network information and its earlier sequence-based GOLabeler (You et al., 2018b). More implementation details of TALE and TALE+, including hyperparameter tuning, are in Supplementary Section S1. More details about competing methods are in Supplementary Section S2.
For DeepGO, DeepGOCNN and DeepGOPlus, we used their codes published on GitHub and trained the models on CAFA3 and our datasets. Training details of these and our models are in Supplementary Section S2. Note that the number of free parameters in TALE+ (9 models total, counting three ensembles of size 3 for 3 ontologies) is less than 40% of that in DeepGOPlus (Supplementary Table S4). For NetGO, we only had access to its webserver (version 1.1 released on February 22, 2020). As the latest NetGO webserver was updated after CAFA3 and may use training examples in the CAFA3 test set, a fair comparison to NetGO was not possible. We thus instead used the CAFA3 official assessment (AuPRC being unavailable) (Zhou et al., 2019b) of GOLabeler (You et al., 2018b), a top performer in CAFA3 and NetGO’s earlier version, for numerical comparison on the CAFA3 dataset.
2.4 Evaluation
For a test set , we use two evaluation metrics: Fmax and AuPRC. Fmax is the official, protein-centric evaluation metric used in CAFA. It is the maximum score of the geometric average of averaged precision and recall over proteins for all thresholds:
| (7) |
where and are the averaged precision and recall at threshold t. Specifically,
| (8) |
where Q(t) is the number of samples that have least one non-zero label in ; is the true label vector of kth sample in , and is the predicted label vector of the kth sample in at threshold t. For the calculation, we iterated t incrementally from 0 to 1 at a stepsize of 0.01.
AuPRC is a standard metric in machine learning for evaluating the binary classification performance, especially suitable for highly imbalanced data, which is often the case in protein function annotation. In multi-label classification, we concatenate all the label vectors and use canonical AuPRC (single-label) to evaluate the performance.
3 Results
We perform comprehensive evaluation of our models from several perspectives. We will start with comparing them to aforementioned competing methods on various ontologies and test sets. We will proceed to assess the capability of all models to generalize to novel sequences, novel species and novel functions relative to the training set. We will also conduct an ablation study for TALE and TALE+ to delineate the contributions of their various algorithmic components to overall performances and various generalizability. We will conclude with GO term-centric analysis of TALE+ predictions.
3.1 Performance on the CAFA3 test set
We first compare TALE and TALE+ with competing methods over the CAFA3 testset. The results are shown in Table 2. Overall, TALE+ achieved the best performance on biological process (BPO) and cellular component (CCO); and was the second best (next to GOLabeler) on molecular function (MFO). Compared to GOLabeler (the top performer in the official assessment of CAFA3), TALE+ improved the Fmax from 0.400 to 0.431 (by 8%) on BPO and from 0.610 to 0.669 (by nearly 10%) on CCO while having a slightly worse Fmax on MFO (0.615 versus 0.620). Speaking of TALE without the help of similarity-based DIAMONDScore, it tied with GOLabeler being the third best on BPO (next to TALE+ and DeepGOPlus, both of which use DIAMONDScore); and it achieved the second best on CCO (only next to TALE+; and improving Fmax from 0.610 to 0.654 by 7% compared to GOLabeler).
Table 2.
The performance of TALE and TALE+ against competing methods on the CAFA3 test set
| Fmax |
AuPRC |
|||||
|---|---|---|---|---|---|---|
| Ontology | MFO | BPO | CCO | MFO | BPO | CCO |
| Naive | 0.331 | 0.253 | 0.541 | 0.312 | 0.173 | 0.483 |
| DIAMONDScore | 0.532 | 0.382 | 0.523 | 0.461 | 0.304 | 0.500 |
| DeepGO | 0.392 | 0.362 | 0.502 | 0.312 | 0.213 | 0.446 |
| DeepGOCNN | 0.411 | 0.388 | 0.582 | 0.402 | 0.213 | 0.523 |
| DeepGOPlus | 0.552 | 0.412 | 0.608 | 0.502 | 0.313 | 0.564 |
| GOLabelera | 0.620 | 0.400 | 0.610 | / | / | / |
| TALE | 0.548 | 0.398 | 0.654 | 0.471 | 0.317 | 0.626 |
| TALE+ | 0.615 | 0.431 | 0.669 | 0.548 | 0.370 | 0.652 |
Note: Boldfaced are the top performance (Fmax or AuPRC) for each ontology.
Top performer in CAFA3, GOLabeler’s Fmax results (AuPRC being unavailable) are obtained from the official assessment (Zhou et al., 2019b). Its upgraded version NetGO is only available in a webserver whose training set may include CAFA3 test sequences, thus not compared.
3.2 Performance on our test set
We then compare TALE and TALE+ with competing methods over our larger and newer test set and show the results in Table 3. Overall, TALE+ again achieved the best performance in BPO and CCO; and had the second best in molecular function (MFO). The best performer in MFO, NetGO was also the second best performer in BPO and the third in CCO. Specifically, compared to NetGO, TALE+ improved Fmax from 0.423 to 0.459 (by 9%) in BPO and from 0.636 to 0.677 (by 6%) in CCO; and it had worse Fmax (0.703 versus 0.667) in MFO. TALE alone without adding similarity-based DIAMONDScore outperformed all other methods except our own TALE+ in CCO: compared to NetGO, TALE alone improved Fmax from 0.636 to 0.658 (by 4%). It is noteworthy that NetGO uses additional network information that is not used in TALE or TALE+. Such network information is often not available to proteins and, in such cases, TALE+ outperformed NetGO in all three ontologies including MFO, as shown in Table 4.
Table 3.
The performance of TALE and TALE+ against competing methods on our test set
| Fmax |
AuPRC |
|||||
|---|---|---|---|---|---|---|
| Ontology | MFO | BPO | CCO | MFO | BPO | CCO |
| Naive | 0.407 | 0.281 | 0.599 | 0.329 | 0.198 | 0.545 |
| DIAMONDScore | 0.582 | 0.359 | 0.548 | 0.505 | 0.207 | 0.448 |
| DeepGOa | 0.423 | 0.231 | 0.523 | 0.345 | 0.134 | 0.478 |
| DeepGOCNN | 0.476 | 0.266 | 0.616 | 0.419 | 0.162 | 0.563 |
| DeepGOPlus | 0.634 | 0.384 | 0.632 | 0.587 | 0.235 | 0.578 |
| NetGOa | 0.703 | 0.423 | 0.636 | 0.634 | 0.311 | 0.623 |
| TALE | 0.578 | 0.336 | 0.658 | 0.514 | 0.247 | 0.635 |
| TALE+ | 0.667 | 0.459 | 0.677 | 0.604 | 0.326 | 0.643 |
Note that both DeepGO and NetGO use network information besides sequence, whereas other methods including TALE and TALE+ use sequence alone. Note: Boldfaced are the top performance (Fmax or AuPRC) for each ontology.
Table 4.
The performance of TALE and TALE+ against competing methods on the portion of our test set that does not have network information available
| Fmax |
AuPRC |
|||||
|---|---|---|---|---|---|---|
| Ontology | MFO | BPO | CCO | MFO | BPO | CCO |
| Naive | 0.416 | 0.283 | 0.597 | 0.324 | 0.198 | 0.548 |
| DIAMONDScore | 0.571 | 0.367 | 0.528 | 0.488 | 0.210 | 0.450 |
| DeepGO | 0.423 | 0.253 | 0.572 | 0.336 | 0.213 | 0.523 |
| DeepGOCNN | 0.461 | 0.273 | 0.625 | 0.391 | 0.167 | 0.576 |
| DeepGOPlus | 0.631 | 0.396 | 0.644 | 0.575 | 0.246 | 0.604 |
| NetGO | 0.643 | 0.396 | 0.643 | 0.592 | 0.222 | 0.544 |
| TALE | 0.539 | 0.346 | 0.669 | 0.485 | 0.258 | 0.649 |
| TALE+ | 0.661 | 0.473 | 0.693 | 0.591 | 0.249 | 0.669 |
Note: Boldfaced are the top performance (Fmax or AuPRC) for each ontology.
The performance difference among the three ontologies, as observed in both datasets, can be attributed to the structure and complexity of the ontology as well as the available annotations (Jiang et al., 2016). Similarity-based DIAMONDScore performed much better than the naive approach (and did well among all methods) in MFO but worse in CCO. This observation echoes the hypothesis that sequence similarity may carry more information on basic biochemical annotations than cellular components. Interestingly, CCO is also the ontology where TALE and TALE+ did the best—even TALE alone was better than all methods other than TALE+ and adding similarity-based DIAMONDScore to TALE resulted in less help than it did in MFO and BPO.
3.3 Performance on our test set without network information
Protein–protein interaction (PPI) network information can be very useful in boosting the accuracy of computational protein function annotation. However, its availability can be limited and, when available, its quality can also be limited (noisy and incomplete). Table 1 shows that only round 40% of our test set has corresponding network information in STRINGdb, which is already biased considering that all test sequences have already been functionally annotated with experiments until now. In reality, only 7% of TrEMBL sequences have corresponding STRINGdb entries available, regardless of the quality of the network information. The ratio can be even worse for de novo designed protein sequences. Therefore, a reliable sequence-only function annotation method is necessary especially when network information is not available.
We thus did performance analysis over the portion of our test set without network information, i.e. the test sequences whose network information cannot be found in STRINGdb (see statistics in Table 1). In this case alone we used the version of DeepGO codes without network features. As shown in Table 4, TALE+ significantly outperformed all competing methods in all three ontologies. Compared to NetGO, TALE+ improved Fmax from 0.643 to 0.661 (by 3%) in MFO, from 0.396 to 0.473 (by 19%) in BPO and from 0.643 to 0.693 (by nearly 8%) in CCO.
3.4 Generalizability from the training set to the test set
Despite the improved performances of our models, questions remain on their practical utility. Are they useful in cases where function annotation is needed the most? Sequence-based protein property prediction (e.g. fold, structure and function) is needed the most in the ‘twilight’ or even ‘midnight’ zone where similarity to known annotated sequences is too low to sustain the assumption that similar inputs (sequences) imply similar outputs (aforementioned properties). Similarly, it is also needed the most in the ‘twilight’ or ‘midnight’ zone in another sense, where examples for some specific function labels are never or rarely seen in known annotated sequences (thus referred to as tail labels).
Besides the practical questions on model applicability in the twilight or midnight zone, fundamental biological questions also remain. Have these machine learning models learned anything fundamental in sequence–function relationships? Or are they merely mimicking patterns in training data using a complicated function (such as a neural network) that could overfit?
To answer these questions, we examine our models and competing ones in their generalizability from the training set to the test set. Models considered include sequence-based Naive, DIAMOND, DeepGOCNN, DeepGOPlus, TALE and TALE+. As the generalizability analysis requires similarity measures between the training and test sets, we couldn’t include the NetGO webserver for this analysis because its training set is neither accessible nor guaranteed to be identical to ours. Specifically, we examine the generalizability of these models from three perspectives: sequence, species and label (function) as follows.
3.4.1. Sequence generalizability
To analyze the generalizability to novel sequences, we split our test set into bins of various sequence-identity levels compared to the training set and examine various models’ accuracy (Fmax) over these bins. Specifically, sequence identity between a test sequence and the training set is measured by maximum sequence identity (MSI) [Sequence identity is measured as the number of identical residues divided by the length of the alignment. Sequence alignment is performed with the Needleman–Wunsch algorithm (Needleman and Wunsch, 1970), using the substitution matrix of BLOSUM62 and the gap penalty as the EBI webserver “EMBOSS Needle”.]. The distributions of test sequences in MSI are shown in Supplementary Figure S4. We partition the test sequences into four bins based on MSI: [0,0.2] (midnight zone), (0.2,0.3] (twilight zone), (0.3,0.4] and (0.4,1.0] (safe zone), and show the sequence counts (gray dots) and the Fmax scores (colored bars) in these bins (Fig. 2).
Fig. 2.

The Fmax performances of six models in three ontologies, over 4 bins of increasing sequence-identity ranges. Low sequence identity indicates low similarity between a test sequence and the training set. Sequence statistics over the bins (gray dots connected in dashed lines) are also provided
As shown in Figure 2, sequence similarity-based method DIAMOND performed poorly compared to deep learning-based models and even the background frequency-based naive approach, when sequence identity is below 20% (midnight zone) or between 20% and 30% (twilight zone). Meanwhile, without a surprise, DIAMOND was the close-to-best performer in MFO, BPO and CCO, when sequence identity is above 40% (safe zone). Between DeepGOCNN and TALE that do not use sequence-similarity scores from other sources, TALE outperformed DeepGOCNN in all bins. In fact TALE was even the best performer among all on MFO and CCO when sequence identity is below 20%. For all other combinations of the ontology and the bin, TALE+ had the best performance. As a convex combination of DIAMONDScore and TALE, TALE+ maintained the impressive performances of TALE in the midnight and twilight zones and significantly improved from TALE in the safe zone using the similarity-based information. The numerical values of the performances are reported in Supplementary Table S7.
3.4.2. Species generalizability
To analyze the generalizability to new species, we count for every test sequence the Number of training Samples of the Same Species (NSSS) and identify those in new species never seen in the training set (NSSS = 0). The statistics are in Supplementary Table S10 and the distributions of the test sequences in NSSS are in Supplementary Figure S5. We further remove ‘safe zone’ test sequences whose maximum sequence identities (MSI) to the training set are above 40%. The remaining test sequences are thus in new species and low similarity compared to the training set (see statistics in Supplementary Table S11).
Figure 3 shows the counts (gray dots) and the Fmax scores of various models (colored bars) over prokaryotes (including bacteria and archaea) and eukaryotes. Again, TALE+ outperformed all competing methods for all six combinations of clades and ontologies; and TALE remained the second best for all combinations except for prokaryotic CCO where DeepGOPlus, blending DeepGOCNN and similarity-based DIAMONDScore, edged TALE. Similarity-based DIAMOND performed very poorly while the naive approach was mediocre. The numerical values of the performances are reported in Supplementary Table S8.
Fig. 3.
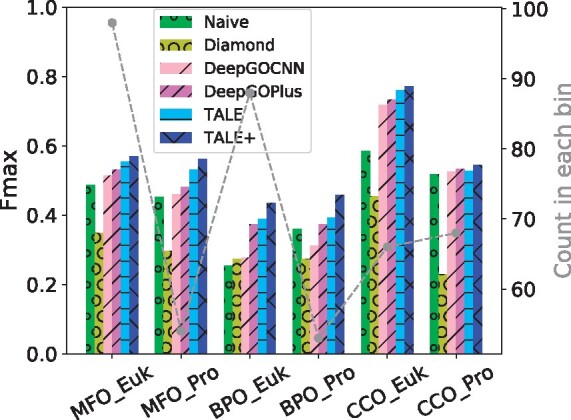
The Fmax performances of six models in three ontologies, over eukaryotes and prokaryotes with NSSS = 0 (new species) and MSI ⩽ 40% (low similarity)
Interestingly, all methods performed better for new eukaryotic species than for new prokaryotic species in MFO and CCO. To understand this pattern, we compared the MSI between the sequences in new eukaryotic species and those in new prokaryotic species on each ontology (MSI below 40%). We found that, the MSIs for sequences from new eukaryotes are in distribution higher than those for sequences from new prokaryotes (P-values ranging from 3E-4 to 5E-8 according to one-sided Kolmogorov–Smirnov test), potentially posing an easier prediction task. Detailed analyses can be found in Supplementary Section S4.
3.4.3. Function generalizability
To analyze the generalizability to new or rarely annotated functions (GO labels), we first calculate the frequency of the ith label in the training set:
| (9) |
where is the number of training samples and the binary is for the ith label of the jth training sample. Then for the kth test sample, we calculate its average label frequency (ALF) in the training set as:
| (10) |
where c is the number of labels, the binary is for the jth label of the kth sample in the test set, and is the stacked vector over all labels. The distributions of test sequences in are shown in Supplementary Figure S6. We split the test set into 4 bins based on : and , and provide the histograms of the sequences over these bins in Figure 4 (gray dots). We note that ALF is a protein centric measure that is a protein-specific average of individual GO term-centric frequencies. Instead, a direct GO term-centric analysis is included in Section 3.6.
Fig. 4.

The Fmax performances of six models in three ontologies, over 4 bins of increasing function/label frequencies (for each test sequence, average label frequencies in the training set, measured by ALF(·)). Low ALF bins indicate proteins with functions rarely annotated in the training set
As shown in Figure 4, the performances of both the naive approach and DeepGOCNN deteriorated noticeably as the average label frequency of a test sequence decreases, indicating that current deep learning models for function annotation do not necessarily lead to better performances in such scenarios. Similarity-based method DIAMOND also had mediocre performance especially in low ALF ( ⩽ 0.3). In all six combinations of 3 ontologies and 2 low ALF bins ([0,0.2] and (0.2,0.3]), TALE (twice in CCO) or TALE+ (four times in MFO or BPO) had the best performance. In the other six combinations involving medium or high ALF, TALE+ led all other methods by being the best performer thrice, followed by DeepGOPlus (twice) and the naive approach (once). These results attest to the advantage of our models that target tail labels using joint sequence–label embedding. Interestingly, adding similarity-based DIAMONDScore to TALE did not always lead to a further improved TALE+, as seen in the two lowest-ALF bins in CCO. The numerical values of the results are shown in Supplementary Table S9.
In total, TALE and TALE+ outperformed all competing methods in all generalizability tests (low sequence similarity, new species and rarely annotated functions), echoing our rationale that joint embedding of sequences and hierarchical function labels to address their similarities would significantly improve the performance for novel sequences and tail labels. In addition, combining TALE and similarity-based DIAMOND into TALE+ also enhanced the performances in some cases. In contrast, similarity-based DIAMOND did not generalize well to novel sequences in low similarity, new species and rarely annotated functions compared to the training ones, whereas the frequency-based naive approach had mediocre performance. Deep learning-based DeepGOCNN performed poorly for rarely annotated functions (tail labels), whereas DeepGOPlus combining DeepGOCNN and similarity-based DIAMONDScore improved the performance relative to DeepGOCNN.
3.5 Ablation study
To rigorously delineate the contributions of algorithmic innovations that we have made in TALE and TALE+ to their improved performances and superior generalizability, we perform the following ablation study. Starting with DeepGOCNN, we incrementally add algorithmic components and introduce variants to eventually lead to TALE and TALE+:
B1: replacing the convolutional layers in DeepGOCNN with the transformer encoder plus the input embeddings. Unlike Eq. (3) where a is the output from joint label embedding, the output of the encoder here would be simply row-averaged to obtain e;
B2: replacing the DeepGOCNN post-training correction of hierarchical violations in B1 with the additional loss term of hierarchical regularization (Eq. 5);
B3: adding label embedding and joint similarity modules to B2 for joint sequence–label embedding.
TALE is using the average of the top-3 B3 models (based on the validation set) and TALE+ is a convex combination of TALE and DIAMONDScore.
The overall performances of the above models over the test set are summarized in Figure 5(a). Exact Fmax and AuPRC values and detailed analyses are in Supplementary Section S7. From DeepGOCNN to TALE+, both Fmax and AuPRC were gradually increasing over model variants. In MFO and BPO, the convex combination with DIAMONDScore had the largest single contribution to the overall Fmax or AuPRC increase, whereas the TALE innovations, including the transformers, hierarchical regularization, label embedding (jointly with sequence embedding) and model ensembling, together contributed about the same. In CCO, DIAMONDScore still contributed but the TALE innovations contributed much more in improving both measures.
Fig. 5.

The Fmax performances of various models in the ablation study for (a) the overall test set as well as test sequences (b) with MSI ⩽ 30%, (c) in new eukaryotic or prokaryotic species and with MSI ⩽ 40%, or (d) average label frequency ⩽ 20%
Various generalizability of the above models is also assessed over test sequences with low similarity (MSI ⩽ 30%), in new species (and with MSI ⩽ 40%), or rarely annotated functions (ALF ⩽ 20%), as summarized in Figure 5(b)–(d), respectively. Exact Fmax and AuPRC values as well as detailed analyses are in Supplementary Section S8. Interestingly, similarity-based DIAMONDScore was no longer found the largest single contributor to Fmax improvements except in BPO, and sometimes found to hurt the performance. Instead, joint embedding, hierarchical regularization and sometimes transformers, were often found the largest contributors to many Fmax improvements among combinations of generalizability types and ontologies considered, which attests to the rationales of our algorithm designs.
3.6 GO term-centric analysis
Besides previous protein-centric analysis, we perform a GO term-centric analysis to show the best performing GO annotations by TALE+. Specifically, for each of the three ontologies, we report such top-10 annotations for GO terms in three categories: all GO terms considered (Table 1), a subset of low label frequency [lowest 10% in f(i)] or even zero label frequency (f(i) = 0), and a subset of high information content [IC; IC(i) ⩾ 5 or IC(i) ⩾ 10] (Clark and Radivojac, 2013). Due to the space limit, we detail the results in Supplementary Section S9 (Supplementary Tables S16–S30) and summarize the major observations as follows.
Among all GO terms considered, top-10 annotations by TALE+ were with extremely high precision and recall (Fmax being 1). The corresponding GO terms were often shallow (depth being mostly 2 for MFO and CCO and 3 for BPO) but their information content may vary widely (Supplementary Tables S16, S21 and S26).
For those GO terms rarely annotated in the training set, with the lowest 10% f(i) (often below 3E-5), the top-10, 5 and 2 best performing annotations by TALE+ still impressively achieved Fmax being 1 in MFO, BPO, and CCO, respectively (Supplementary Tables S17, S22 and S27). For GO terms i never annotated in the training set (but in the test set), with f(i) = 0, only top-3, top-4, and top-3 annotations by TALE+ could achieve Fmax over 0.1 for MFO, BPO and CCO, respectively (Supplementary Tables S18, S23 and S28). Their hierarchical relationships to other GO terms, many of which are annotated in the training set, are well exploited in our label embedding (jointly across GO terms and jointly between labels and sequences). The best-performing such annotation was for GO:0019164 (pyruvate synthase activity) with an Fmax of 0.34. These annotations were, naturally, with much larger depth (up to 6); and their distances to the closest ancestor annotated in the training set were often just 1. With few ground-truth sequences, these GO terms suffered from low precision but showed high recall. Similar observations were made for TALE+ annotations for those GO terms i with high information content (Supplementary Tables S19, S20, S24, S25, S29 and S30).
4 Conclusion
In this article, we have developed a novel transformer-based deep learning model named TALE, with joint embedding of sequence inputs and hierarchical function labels. The transformer architecture could learn sequence embedding while considering the long-term dependency within the sequence, which could generalize better to sequences with low similarity to the training set. To further generalize to tail labels (functions never or rarely annotated in the training set), we learn the label embedding, jointly with the sequence embedding, and use their joint similarity to measure the contribution of each amino acid to each label. The similarity matrix is further used to reweigh the contributions of each amino acid toward final predictions. In addition, we use TALE+, a convex combination of TALE and a similarity-based method, DIAMOND, to further improve model performances and generalizability.
Our results on the time-split test sets (standard CAFA3 and our curated) demonstrate that TALE+ outperformed all sequence-based methods in all three ontologies and outperformed the state-of-the-art hybrid method (using network information) in BPO and CCO. When network information is not available, TALE+ outperformed all competing methods in all ontologies. Importantly, both TALE and TALE+ showed superior generalizability to sequences of low similarity (and in never-annotated new species) as well as rarely (and sometimes never) annotated functions, echoing the rationales of our algorithm development. Ablation studies indicate that our newly introduced algorithmic components, especially transformer encoders and joint embedding of features (1D sequences) and labels (GO as directed acyclic graphs), contributed the most to such sequence, species and function generalizability, whereas sequence similarity-based DIAMONDScore helped especially the high-similarity cases.
Both TALE and TALE+ are fast models that can annotate 1000 sequences within a couple of minutes on a mid-range GPU (Nvidia K80). These high-throughput annotators with both accuracy and generalizability would help close the increasing gap between high-throughput sequence data and limited biological insights. In future, integrating additional data beyond protein sequences, particularly protein interaction networks, would further help close the gap especially for the ontologies of biological processes and cellular components.
Supplementary Material
Acknowledgements
The authors thank Texas A&M High Performance Computing Resources for GPU allocations.
Funding
This work was supported by the National Institute of General Medical Sciences [R35GM124952].
Conflict of Interest: none declared.
Contributor Information
Yue Cao, Department of Electrical and Computer Engineering, Texas A&M University, College Station, TX 77843, USA.
Yang Shen, Department of Electrical and Computer Engineering, Texas A&M University, College Station, TX 77843, USA.
References
- Ashburner M. et al. (2000) Gene ontology: tool for the unification of biology. Nat. Genet., 25, 25–29. [DOI] [PMC free article] [PubMed] [Google Scholar]
- Baker S., Korhonen A.-L. (2017) Initializing neural networks for hierarchical multi-label text classification. In: Proceedings of the 16th Workshop on Biomedical Natural Language Processing. Assoc. Comput. Ling, pp. 307-315. Vancouver, Canada. [Google Scholar]
- Buchfink B. et al. (2015) Fast and sensitive protein alignment using diamond. Nat. Methods, 12, 59–60. [DOI] [PubMed] [Google Scholar]
- Clark W.T., Radivojac P. (2013) Information-theoretic evaluation of predicted ontological annotations. Bioinformatics, 29, i53–i61. [DOI] [PMC free article] [PubMed] [Google Scholar]
- Deng J. et al. (2009) Imagenet: a large-scale hierarchical image database. In: 2009 IEEE Conference on Computer Vision and Pattern Recognition. IEEE, pp. 248–255. Miami, Florida, USA.
- Duong D.B. et al. (2020) Annotating gene ontology terms for protein sequences with the transformer model. bioRxiv 2020.01.31.929604.
- Elnaggar A. et al. (2020) ProtTrans: towards cracking the language of life’s code through self-supervised deep learning and high performance computing. arXiv preprint arXiv:2007.06225.
- Fa R. et al. (2018) Predicting human protein function with multi-task deep neural networks. PLoS One, 13, e0198216. [DOI] [PMC free article] [PubMed] [Google Scholar]
- Fan K. et al. (2020) Graph2GO: a multi-modal attributed network embedding method for inferring protein functions. GigaScience, 9, giaa081. [DOI] [PMC free article] [PubMed] [Google Scholar]
- Friedberg I., Radivojac P. (2017) Community-wide evaluation of computational function prediction. Methods Mol. Biol., 1446, 133–146. [DOI] [PubMed] [Google Scholar]
- Gligorijević V. et al. (2018) deepNF: deep network fusion for protein function prediction. Bioinformatics, 34, 3873–3881. [DOI] [PMC free article] [PubMed] [Google Scholar]
- Jiang Y. et al. (2016) An expanded evaluation of protein function prediction methods shows an improvement in accuracy. Genome Biol., 17, 184. [DOI] [PMC free article] [PubMed] [Google Scholar]
- Jones C.E. et al. (2005) Automated methods of predicting the function of biological sequences using go and blast. BMC Bioinformatics, 6, 272. [DOI] [PMC free article] [PubMed] [Google Scholar]
- Kahanda I., Ben-Hur A. (2017) Gostruct 2.0: Automated protein function prediction for annotated proteins. In Proceedings of the 8th ACM International Conference on Bioinformatics, Computational Biology, and Health Informatics, pp. 60–66. Boston, Massachusetts, USA.
- Kulmanov M., Hoehndorf R. (2020) DeepGOPlus: improved protein function prediction from sequence. Bioinformatics, 36, 422–429. [DOI] [PMC free article] [PubMed] [Google Scholar]
- Kulmanov M. et al. (2018) DeepGO: predicting protein functions from sequence and interactions using a deep ontology-aware classifier. Bioinformatics, 34, 660–668. [DOI] [PMC free article] [PubMed] [Google Scholar]
- Needleman S.B., Wunsch C.D. (1970) A general method applicable to the search for similarities in the amino acid sequence of two proteins. J. Mol. Biol., 48, 443–453. [DOI] [PubMed] [Google Scholar]
- Radivojac P. et al. (2013) A large-scale evaluation of computational protein function prediction. Nat. Methods, 10, 221–227. [DOI] [PMC free article] [PubMed] [Google Scholar]
- Rifaioglu A.S. et al. (2019) DEEPred: automated protein function prediction with multi-task feed-forward deep neural networks. Sci. Rep., 9, 1–16. [DOI] [PMC free article] [PubMed] [Google Scholar]
- Rives A. et al. (2020) Biological structure and function emerge from scaling unsupervised learning to 250 million protein sequences. bioRxiv, 622803. [DOI] [PMC free article] [PubMed]
- Stewart M. et al. (1998) Structural basis for molecular recognition between nuclear transport factor 2 (NTF2) and the GDP-bound form of the Ras-family GTPase Ran. J. Mol. Biol., 277, 635–646. [DOI] [PubMed] [Google Scholar]
- Szklarczyk D. et al. (2016) The STRING database in 2017: quality-controlled protein–protein association networks, made broadly accessible. Nucleic Acids Res., 45, D362–D368. [DOI] [PMC free article] [PubMed] [Google Scholar]
- UniProtConsortium (2019) UniProt: a worldwide hub of protein knowledge. Nucleic Acids Res., 47, D506–D515. [DOI] [PMC free article] [PubMed] [Google Scholar]
- Vaswani A. et al. (2017) Attention is all you need. Adv. Neural Inf. Process. Syst., 30, 5998–6008. [Google Scholar]
- Wrapp D. et al. (2020) Cryo-EM structure of the 2019-ncov spike in the prefusion conformation. Science, 367, 1260–1263. [DOI] [PMC free article] [PubMed] [Google Scholar]
- Yang J. et al. (2015) The I-TASSER suite: protein structure and function prediction. Nat. Methods, 12, 7–8. [DOI] [PMC free article] [PubMed] [Google Scholar]
- You R. et al. (2018a) DeepText2Go: improving large-scale protein function prediction with deep semantic text representation. Methods, 145, 82–90. [DOI] [PubMed] [Google Scholar]
- You R. et al. (2018b) GOLabeler: improving sequence-based large-scale protein function prediction by learning to rank. Bioinformatics, 34, 2465–2473. [DOI] [PubMed] [Google Scholar]
- You R. et al. (2019) NetGO: improving large-scale protein function prediction with massive network information. Nucleic Acids Res., 47, W379–W387. [DOI] [PMC free article] [PubMed] [Google Scholar]
- Zhang F. et al. (2019) DeepFunc: a deep learning framework for accurate prediction of protein functions from protein sequences and interactions. Proteomics, 19, 1900019. [DOI] [PubMed] [Google Scholar]
- Zhou G. et al. (2019a) DeepGOA: predicting gene ontology annotations of proteins via graph convolutional network. In: 2019 IEEE International Conference on Bioinformatics and Biomedicine (BIBM). IEEE, pp. 1836–1841. San Diego, California, USA.
- Zhou N. et al. (2019b) The CAFA challenge reports improved protein function prediction and new functional annotations for hundreds of genes through experimental screens. Genome Biol., 20, 1–23. [DOI] [PMC free article] [PubMed] [Google Scholar]
Associated Data
This section collects any data citations, data availability statements, or supplementary materials included in this article.