

Abstract
In 2006, the Centers for Disease Control and Prevention (CDC) funded community-based organizations (CBOs) to deliver Many Men, Many Voices (3MV) to young men of color who have sex with men. Although 3MV, a group-level behavioral intervention designed to reduce human immunodeficiency virus (HIV) risk behaviors of black men who have sex with men (MSM), has shown effectiveness when delivered in a controlled research environment, there is limited evidence that the intervention is associated with similar outcomes in Breal world^ settings. For the current project, CDC funded three CBOs to conduct outcome monitoring of the 3MV intervention to determine if young MSM of color report changes in HIVrisk behaviors postintervention. Using a repeated measures design, risk behaviors were collected at baseline and again at 3 and 6 months postintervention. Changes in risk behaviors were assessed using generalized estimating equations. Participants (n=337) reported decreases in sexual risk behaviors at both follow-up time points, such as sex without a condom, sex without a condom and multiple partners, and sex without a condom with serodiscordant or status unknown partners. Results suggest that 3MV may be an effective tool for reducing HIVrisk behaviors in this critical target population.
Keywords: Men who have sex with men; Young men of color who have sex with men; MSM; Many Men, Many Voices; 3MV; HIVrisk behaviors; Evidenced-based behavioral interventions; Community-based organizations
Introduction
Young gay, bisexual, and other men who have sex with men (collectively referred to as MSM) of color represent the group currently most affected by human immunodeficiency virus (HIV) in the USA. Between 2008 and 2010, new HIV infections significantly increased by 22 % among young (aged 13–24) MSM (Centers for Disease Control and Prevention [CDC] 2012a). In 2010, the estimated number of new HIV infections among MSM was highest among young black or African–American (hereinafter referred to as black) MSM, who accounted for 45 % of new HIV infections among all black MSM, and 55 % of new HIV infections among young MSM overall (CDC 2012a). In 2010, of Hispanic/Latino MSM, 47 % of new infections occurred in those under the age of 34 (CDC 2012a).
The 2010 National HIV/Acquired Immunodeficiency Syndrome (AIDS) Strategy (NHAS) calls for intensified prevention efforts in communities where HIV is concentrated and targeting high-risk populations such as blacks and Hispanics/Latinos and gay and bisexual men within these communities (Office of National AIDS Policy 2010). It also speaks about the importance of providing such high-risk populations with access to effective, evidence-based interventions with long-term and sustainable outcomes that reduce the probability of HIV acquisition.
Through research and extensive efficacy reviews, CDC has identified 74 HIV risk reduction evidenced-based behavioral interventions (EBIs) that focus on reducing sex- or drug-related risk behaviors among persons with HIV or at risk for HIV and have shown evidence of efficacy in decreasing HIV acquisition and transmission (CDC 2014). CDC supports the implementation of several EBIs by community-based service providers and state and local health departments through the provision of packaged EBIs, suggestions for adaptation, training, and ongoing technical assistance (CDC 2012b; Collins et al. 2006).
Currently, Many Men, Many Voices (3MV) is the only group-level EBI supported by CDC that is designed to prevent HIV and sexually transmitted diseases among black MSM who may or may not identify themselves as gay. In response to the continuing HIV epidemic among young MSM of color, CDC has funded community-based organizations (CBOs) to deliver 3MV to black MSM since 2004 and to young MSM and transgender persons of color and their partners at high risk for acquiring or transmitting HIV infection since 2006. In this context, “of color” refers to a person who is identified as Hispanic or Latino or with a race other than white.
3MV is a small group-level intervention that is designed to be facilitated by peers in groups of 6 to 12 clients (CDC 2009). The intervention is delivered in cycles comprised of six 2-h core sessions and one 2-h optional session. Sessions are highly experiential, incorporating group exercises, behavioral skills practice, group discussions, and role plays. The intervention addresses factors that influence the behavior of black MSM such as cultural, social, and religious norms; sexual relationship dynamics; and the social influences that racism and homophobia have on HIV risk behaviors (see http://www.effectiveinterventions.org for a detailed description of 3MV).
The original efficacy trial was conducted with black MSM of HIV-negative or unknown HIV serostatus residing in New York City. The study found that in comparison to the control group, 3MV participants reported a reduced number of male sex partners and reduced condomless anal intercourse with casual male sex partners (Wilton et al. 2009). However, there is no systematic assessment of its effectiveness in “real-world” settings such as CBOs. The real-world setting may be very different than the original research setting, and the intervention often needs to be adapted to meet participant and contextual needs in the field (Venigas et al. 2009).
There is an established and growing body of work, called the Community-Based Organization Behavioral Outcomes Project (CBOP), which aims to determine if the implementation of specific EBIs by CDC-funded CBOs is associated with outcomes similar to those reported in efficacy studies (Fisher et al. 2011; Heitgerd et al. 2011; Sapiano et al. 2013). Findings from CBOP projects are encouraging and suggest that implementation of EBIs in nonresearch settings are associated with behavioral changes that are similar to those reported in efficacy studies (Fisher et al. 2011; Heitgerd et al. 2011; Sapiano et al. 2013). All CBOP projects, including this one, were determined to be program evaluation projects, and nonresearch determinations were obtained.
In 2008, through a competitive process, CDC provided funds to three CBOs to collect data for CBOP for Many Men, Many Voices (CBOP-3MV) over a period of 33 months. These CBOs were selected from the 29 CBOs already funded by CDC to provide HIV prevention services to young MSM and transgender persons of color and their partners at high risk for acquiring or transmitting HIV infection (CDC 2008). The purpose of this paper is to describe findings from CBOP-3MV, which aimed to assess the longitudinal changes in self-reported sexual risk behaviors among 3MV clients at the three CBOs. The questions of interest include: (1) Do clients receiving 3MV report changes in HIV risk behaviors 3 and 6 months after receiving the intervention? (2) Which CBO or client-level factors are associated with reported changes in HIV risk behaviors at the two follow-up time points?
Methods
Community-Based Organizations
The three CBOs funded to conduct CBOP-3MV were located in Bronx, NY (CBO A); Tampa, FL (CBO B); and New Orleans, LA (CBO C). The selection criteria included the agency’s capacity to conduct an outcome monitoring project and experience implementing 3MV with fidelity or with appropriate adaptations. The three CBOs had each provided HIV prevention services in their respective metropolitan areas for an average of 20 years. HIV prevention services provided included HIV counseling, testing, and referral; behavioral interventions for populations at risk for HIV transmission; and various programs for HIV-positive individuals.
3MV Recruitment and Implementation
Although all three CBOs targeted young men of color for 3MV, there were some variations in their specific target populations. CBO staff delivered 3MV according to CDC and EBI training guidelines and guidance provided by their CDC program project officers. All intervention facilitators are required to complete CDC-funded trainings including a 3MV facilitation course, and most were part of the target population. CBOs used condensed intervention delivery formats that changed throughout the project period. Incentives were used to recruit and retain clients in 3MV (e.g., gift cards to local retail stores and restaurants and train and bus transportation cards). Table 1 describes the CBOs’ target populations, specific recruitment strategies, and intervention delivery formats.
Table 1.
Target populations, recruitment methods and intervention delivery formats, CBOP-3MV Project, 2009–2011
| CBO A | CBO B | CBO C | |
|---|---|---|---|
| CBO location | Bronx, NY | Tampa, FL | New Orleans, LA |
| Target populations | Black/African–American and Hispanic/Latino males; ages 13–24; self-identified as gay, bisexual, or MSM | Black/African–American and Hispanic/Latino males; ages 16–24; transgender persons; self-reported condomless anal sex with a male in the last 3 months | Black/African–American males; ages 13–24; self-identified as homosexual or bisexual, or had a sexual or emotional attraction to other men or male-to-female transgender persons |
| Recruitment methods | Targeted outreach; drop-in center; client referrals; social media; networking with other community organizations | Targeted outreach; monthly socials; client referrals; social media; and networking with other community organizations | Targeted outreach; drop-in center; client referrals; social media; and networking with other community organizations |
| Intervention delivery formats | Sometimes used a retreat-style format, which occurred over the weekend, but the majority of the intervention cycles were delivered using a 3-day format that spanned across a week | Initially delivered the intervention over multiple days and later delivered the intervention in a single day | Initially delivered one session a week over a period of 6 or 7 weeks before moving to a 3-day format that spanned across a week |
CBOP-3MV Methods
Design
CBOP-3MV used a repeated measures design with no control group. Client-level data were collected before the participation in 3MV (baseline), and at 3 and 6 months after the last session of 3MV. Each CBO was expected to enroll 200 participants in CBOP-3MV and retain 80 % at both the 3 and 6 months data collection time points. All clients who enrolled in 3MV also qualified for CBOP-3MV and were given an option to participate if they could make a commitment to be interviewed at the baseline and two follow-up time points.
Data Collection
Demographic and risk data were collected from participants through questionnaires administered by CBO staff. Participants were asked to recall their sexual risk behaviors over the last 3 months (e.g., “How many partners have you had anal or vaginal sex with?”). They were asked about their risk behaviors overall not by unique partners. Baseline data were collected in-person. Follow-up data were also collected in-person, or in rare cases, over the phone. The target time frame for the baseline interview was within the 30 days prior to the first 3MV session. The target dates for the first and second follow-up interviews were 3 and 6 months after the last 3MV session, respectively. Efforts were made to collect follow-up data from all CBOP-3MV participants regardless of whether they participated in 3MV. Information collected during interviews included demographic variables, previous HIV test history, and HIV-related risk behaviors. In this project, “sex” included anal or vaginal intercourse and excluded oral sex. Incentives were provided at both follow-up time points (e.g., gift cards to local retail stores and restaurants, train and bus transportation cards).
Analyses
Baseline demographic characteristics and HIV-related risk behavior data were analyzed using descriptive statistics. For selected outcome measures, behavioral changes after the intervention were analyzed using generalized estimating equations (GEE), and empirical (robust) standard errors/confidence intervals were applied. Introduced by Liang and Zeger (1986), the analytical approach is an expansion upon generalized linear models that incorporates covariance within individuals and CBO and accounts for the lack of independence between multiple observations for an individual over time. To evaluate changes over time, several exclusion criteria (described below) were applied to support comparisons.
Data Cleaning
Several data-cleaning procedures were conducted prior to data analysis. For one individual at baseline, sexual HIV risk behaviors were recoded as missing/invalid due to reporting an unusually high number of sex events (>1,000) in the previous 3 months. Outcome data were recoded to ensure consistency among risk behaviors reported. Individuals who reported no partners or no sex events at a given time point were coded as having no sexual risk behaviors for that time point. In cases where more sex partners were reported than sex events, the number of partners was recoded to be equal to the number of sex events. This approach was taken for all variables that represented a subset of another outcome variable such as specific types of partners or sex events. Consequently, recodes were applied to one or more outcome variables for n=72 (12 %) of the sample at one or more time points. Count-type outcomes were winsorized, recoding the upper 1 % of values with the 99th percentile for each outcome (Lix and Keselman 1998). This procedure limits the influence of relatively extreme values, preserving the relevance of the results for the sample. Recodes of the upper 1 % of values affected the outcomes for a maximum of 9 participants (1.3 %), depending on the outcome.
We applied exclusions to the dataset prior to analyses. Figure 1 illustrates the number of participants stratified by CBO who were enrolled, and either included or excluded those lost to follow-up. For the evaluation of changes in outcomes over time, we excluded data deemed to be of poor quality to promote interpretation of the results. Due to concerns raised by staff at CBO C about the veracity of the data collection efforts of one interviewer, follow-up data collected by this individual were excluded from the analysis. This included data from 145 individuals. The final number of individuals included in the analysis of changes over time was 337. To make the follow-up times consistent and interpretable, follow-up data were included in the analyses if collected within the following time windows for each time point: follow-up 1 within 7 days before and 28 days after the 3-month target date and follow-up 2 within 14 days before and 28 days after the 6-month target date. We selected these ranges to limit overlap in recall between time points. Individuals newly diagnosed with HIV during follow-up were included in the analysis, but outcome data collected after a new HIV diagnosis were excluded (n=5) because changes in behavior may have been due to the new diagnosis.
Fig. 1.
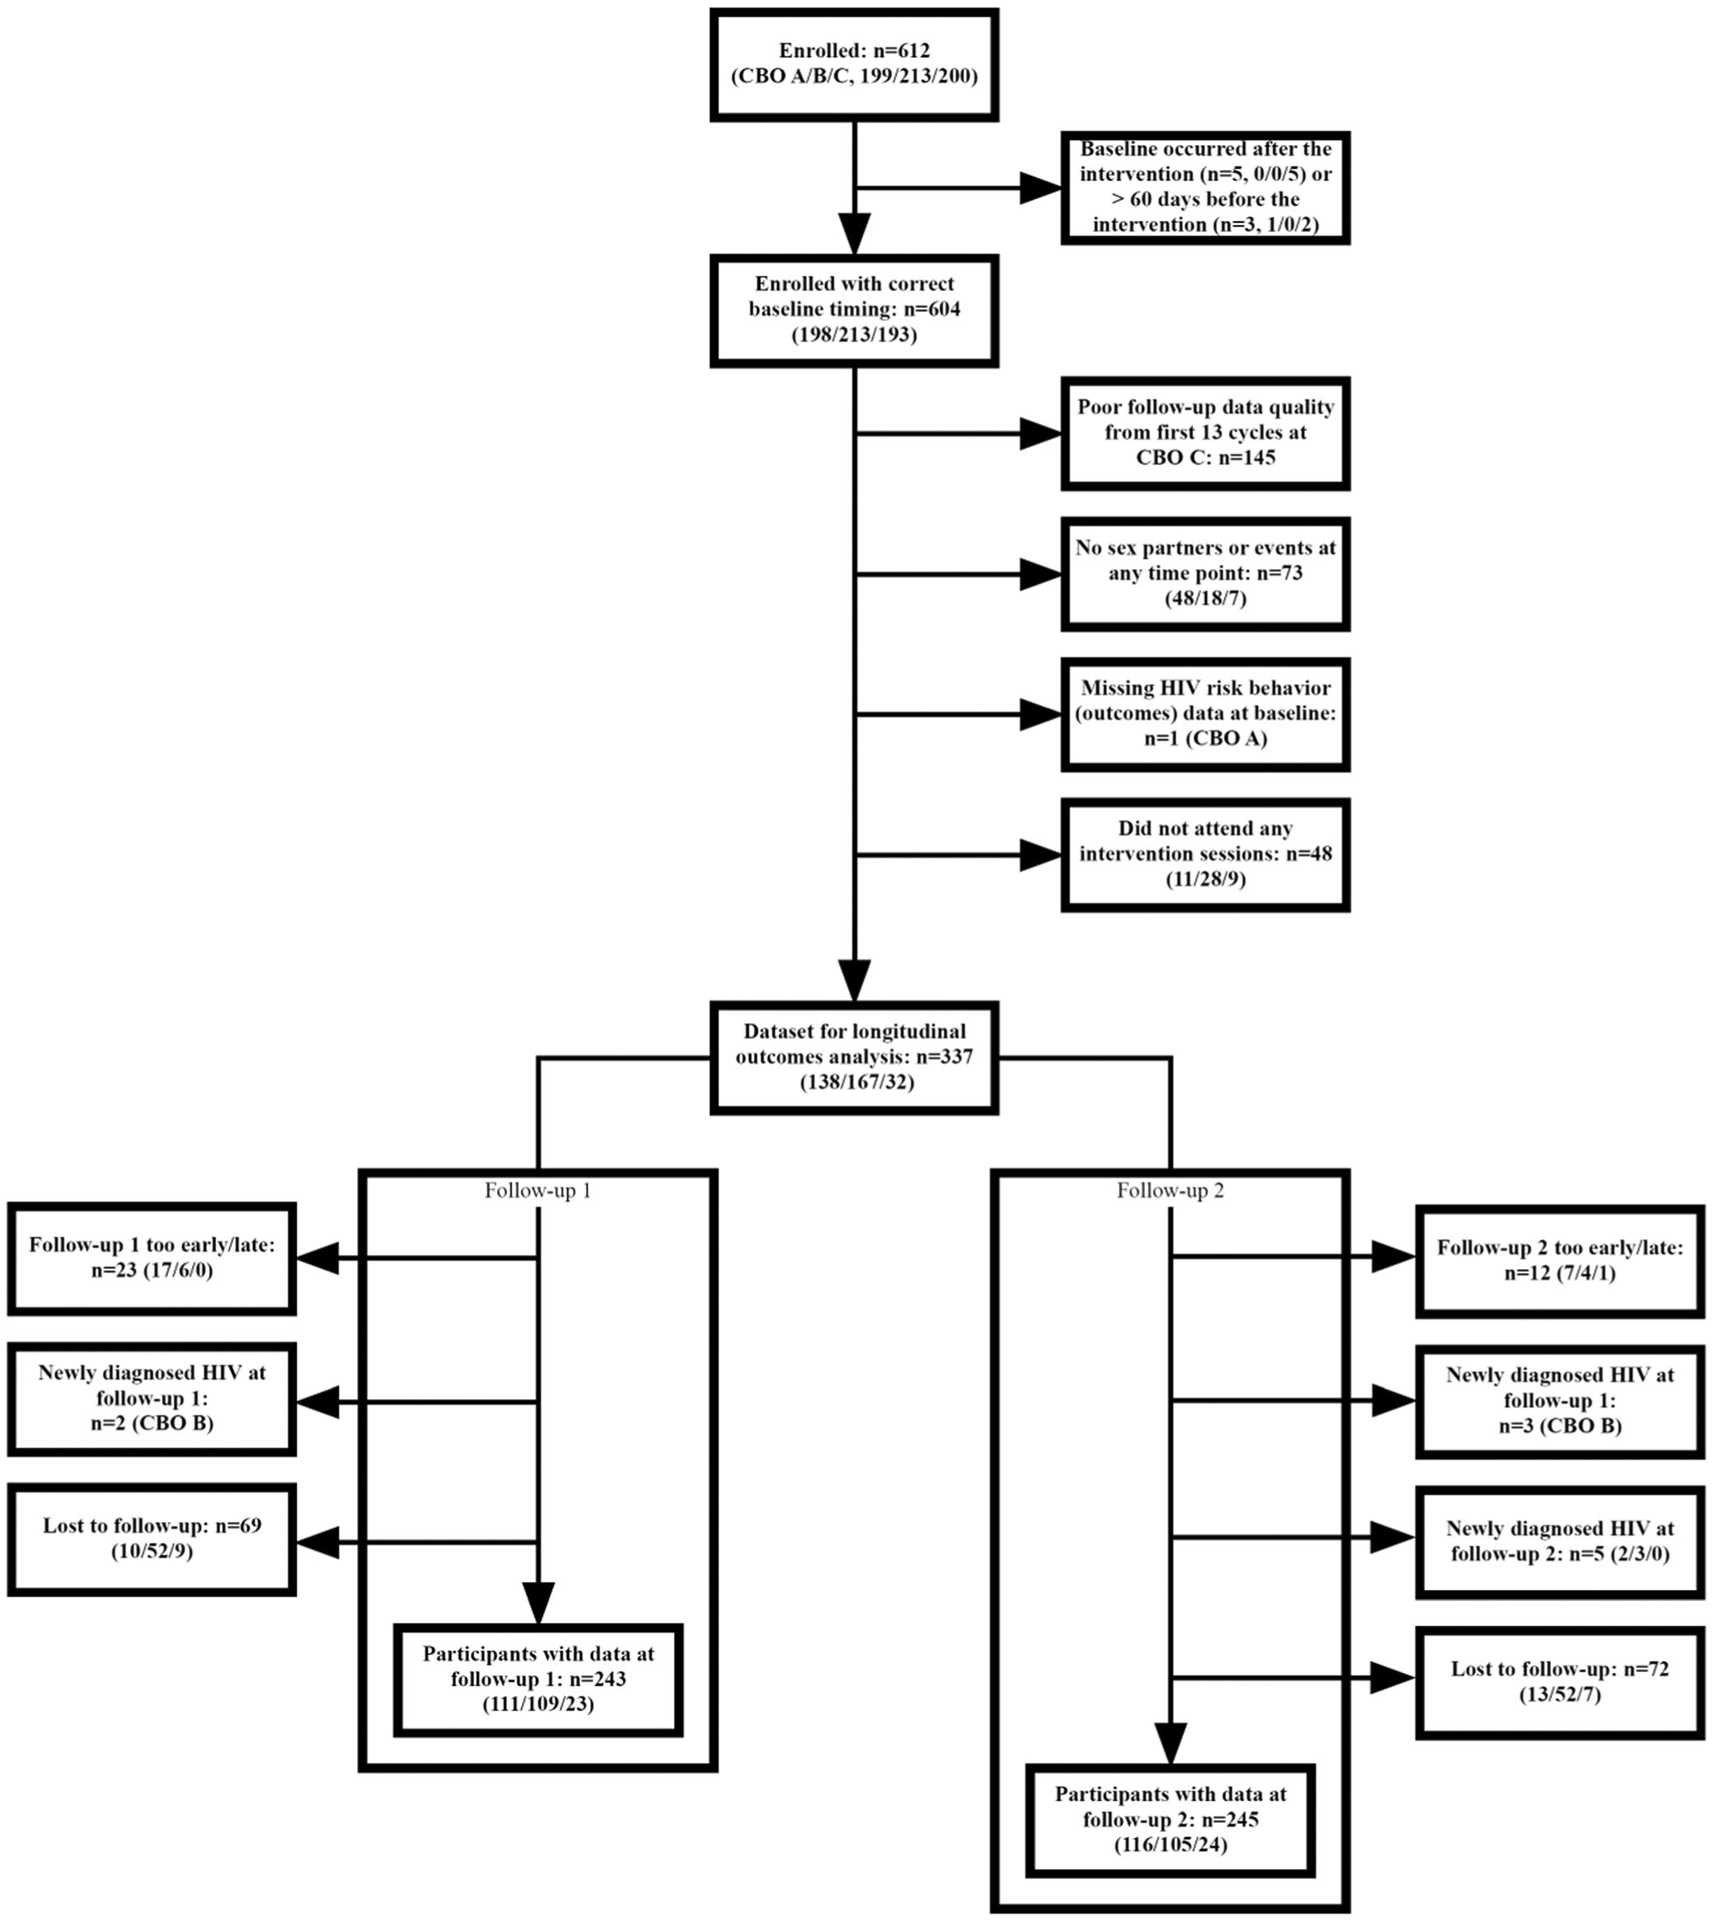
Summary of exclusions and losses to follow-up, CBOP-3MV Project, 2009–2011
GEE models were used to analyze changes in outcomes comparing the follow-up 1 and follow-up 2 time points to the baseline (preintervention) time point. For count-type outcomes, Poisson models were applied resulting in rate ratios that compare the rate of events per person at follow-up as compared to baseline (Gardner et al. 1995). For dichotomous-type outcomes (yes/no), logistic models were used resulting in odds ratios. Results for both unadjusted and multivariable estimates are provided. Covariates for inclusion in multivariable models were selected based upon plausibility of an association with the risk behaviors and/or prior research findings and included age group, CBO, race/ethnicity. All first-order interactions between each covariate and follow-up were also analyzed to explore potential differences in behavior change. Interaction terms in these models reflect whether the change from baseline to follow-up differs for different levels of the covariate. Stratified analyses were conducted where significant interactions were identified. Parsimonious models were selected by comparing the quasi-likelihood under the independence criterion (QIC; Pan 2001) of all candidate models and selecting the model with the best fit.
Results
Intervention Characteristics and Session Attendance
Table 2 describes intervention characteristics including cycle duration and group size, as well as intervention attendance and completion for all CBOP-3MV participants. Most (>95 %) 3MV participants also participated in CBOP-3MV. There was significant variation in both mean cycle duration and group size across CBOs. The mean cycle duration ranged between 4.9 h at CBO B and 13.6 h at CBO A. The mean group size varied between 5 participants at CBO B and 11.4 participants at CBO C. Most participants attended all intervention sessions, ranging from 75.1 % at CBO C and 91.9 % at CBO A.
Table 2.
Intervention characteristics and session attendance, CBOP-3MV Project, 2009–2011
| CBO A | CBO B | CBO C | All CBOs | |
|---|---|---|---|---|
| n=198 | n=213 | n=193 | n=604 | |
| Mean cycle duration in hours | 13.6 | 4.9 | 6.0 | 7.6 |
| Mean number of participants enrolled in cycle | 8.3 | 5.0 | 11.4 | 7.2 |
| Total no. of participants attending no sessions | 12 (6.1 %) | 32 (15.0 %) | 41 (21.2 %) | 85 (14.1 %) |
| Total no. of participants attending some sessions | 4 (2.0 %) | 2 (0.9 %) | 7 (3.6 %) | 13 (2.2 %) |
| Total no. of participants attending all sessions | 182 (91.9 %) | 179 (84.0 %) | 145 (75.1 %) | 506 (83.8 %) |
Excluded Cycles at CBO C
Although 604 participants were enrolled and had a valid baseline time point, follow-up data were not used from 24 % of these participants. This is due to the exclusion of 145 of the 193 (75 %) participants from CBO C due to data collection errors made in the follow-up interviews during the first 13 out of a total 17 cycles (see Fig. 1). Analyses exploring baseline differences associated with the exclusion of the CBO C participants in the first 13 cycles revealed that excluded participants were more likely to be older than included participants [X2(2)=12.63, p<0.01] and report more sex events without a condom (RR=3.28; 95 % CI: 2.56, 4.19), more sex events with serodiscordant/status unknown partners (RR=1.97, 95 % CI:1.48, 2.62), and more sex events without a condom while intoxicated or high on noninjection drugs (RR=4.32; 95 % CI: 2.41, 7.78) (e Table 1).
Retention and Attrition
Retention and attrition analyses were conducted on 459 participants. We assessed everyone except participants in the excluded cycles at CBO C. On average, follow-up 1 data collection occurred 95 days after the last intervention session (range: 62–140), and follow-up 2 data collection occurred 187 days after the last intervention session (range: 102–296). Examining completion of follow-up interviews within the 2-week follow-up windows, 67.5 % of participants completed follow-up 1, 71.0 % completed follow-up 2, and 55.8 % completed both follow-up interviews.
Retention rates by CBO and time point are detailed in Table 3. We also tested for association of CBO and demographics with loss to follow-up (defined as missing at both follow-up time points). There were significant differences in loss to follow-up by CBO (e Table 2) with a smaller proportion being lost to follow-up at CBO A (12.6 %; OR=0.50; 95 % CI: 0.29, 0.84) as compared to CBO B (22.5 %). Loss to follow-up was not associated with age group, race/ethnicity, or education. Individuals who were lost to follow-up reported higher number of serodiscordant/status unknown partners (RR=1.43; 95 % CI: 1.06, 1.92), higher number of sex events without a condom (RR=1.54; 95 % CI: 1.36, 1.74), higher number of sex events with serodiscordant/status unknown partners (RR=1.24; 95 % CI: 1.05, 1.45), and higher number of sex events without a condom with serodiscordant/unknown partners (RR=1.47; 95 % CI: 1.04, 2.07), all at baseline.
Table 3.
Retention Rates by CBO, CBOP-3MV Project, 2009–2011
| CBO A | CBO B | CBO C | All CBOs | |
|---|---|---|---|---|
| n=198 | n=213 | n=48 | n=459 | |
| Completed follow-up 1 | 149 (75.3 %) | 126 (59.2 %) | 35 (72.9 %) | 310 (67.5 %) |
| Completed follow-up 2 | 159 (80.3 %) | 131 (61.5 %) | 36 (75.0 %) | 326 (71.0 %) |
| Completed both follow-up 1 and 2 | 135 (68.2 %) | 92 (43.2 %) | 29 (60.4 %) | 256 (55.8 %) |
| Did not complete either follow-up 1 or 2 | 25 (12.6 %) | 48 (22.5 %) | 6 (12.5 %) | 79 (17.2 %) |
Participant Characteristics at Baseline
Participant characteristics at baseline are shown in Table 4. Of the 604 participants, all were male at birth, and 96.7 % identified their gender as male. The majority of participants were 18–24 years old (76.9 %), 69.2 % were black, and 23.8 % were Hispanic/Latino. A large majority reported that they had received a previous HIV test (91.6 %), and 5.9 % reported receiving a positive HIV test result.
Table 4.
Participant characteristics, CBOP-3MV Project, 2009–2011
| Characteristics | CBO A | CBO B | CBO C | All CBOs |
|---|---|---|---|---|
| n=198 (%) | n=213 (%) | n=193 (%) | n=604 (%) | |
| Sex at birth | ||||
| Male | 198 (100.0) | 213 (100.0) | 193 (100.0) | 604 (100.0) |
| Gender identity | ||||
| Male | 198 (100.0) | 204 (95.8) | 182 (94.3) | 584 (96.7) |
| Female | 0 (0.0) | 2 (0.9) | 4 (2.1) | 6 (1.0) |
| Transgender: male to female | 0 (0.0) | 7 (3.3) | 6 (3.1) | 13 (2.2) |
| Transgender: female to male | 0 (0.0) | 0 (0.0) | 0 (0.0) | 0 (0.0) |
| Other* | 0 (0.0) | 0 (0.0) | 1 (0.5) | 1 (0.2) |
| Age group | ||||
| 13 to 17 | 43 (21.7) | 20 (9.4) | 25 (13.0) | 88 (14.6) |
| 18 to 24 | 153 (77.3) | 164 (77.0) | 147 (76.2) | 464 (76.9) |
| 25 to 29 | 2 (1.0) | 26 (12.2) | 20 (10.4) | 48 (8.0) |
| Greater than 30 | 0 (0.0) | 3 (1.4) | 0 (0.0) | 3 (0.5) |
| Not reported | 0 (0.0) | 0 (0.0) | 1 (0.1) | 1 (0.2) |
| Race/ethnicity | ||||
| Black, not Hispanic/Latino | 87 (43.9) | 154 (72.3) | 177 (91.7) | 418 (69.2) |
| Hispanic/Latino | 100 (50.5) | 38 (17.8) | 6 (3.1) | 144 (23.8) |
| White, not Hispanic/Latino | 0 (0.0) | 4 (1.9) | 0 (0.0) | 4 (0.7) |
| Other, not Hispanic/Latino** | 10 (5.1) | 15 (7.0) | 5 (2.6) | 30 (5.0) |
| Not reported | 1 (0.5) | 2 (0.9) | 5 (2.6) | 8 (1.3) |
| Education | ||||
| Less than high school graduate | 64 (32.3) | 37 (17.3) | 38 (19.7) | 139 (23.0) |
| High school graduate or GED | 74 (37.4) | 83 (39.0) | 71 (36.8) | 228 (37.7) |
| Some college | 55 (27.8) | 85 (39.9) | 77 (39.9) | 217 (35.9) |
| Bachelor’s degree or higher | 5 (2.5) | 8 (3.7) | 7 (3.6) | 20 (3.3) |
| Previous HIV test | 187 (94.4) | 198 (93.0) | 168 (87.0) | 553 (91.6) |
| HIV-positive test result | 11 (5.6) | 18 (8.5) | 3 (1.6) | 32 (5.9) |
| STD diagnosis (within last 12 months) | 6 (3.0) | 14 (6.6) | 10 (5.3) | 30 (5.0) |
| Sex worker (within last 12 months) | 3 (1.5) | 13 (6.1) | 6 (3.1) | 22 (3.6) |
| Incarcerated (within last 12 months) | 11 (5.6) | 35 (16.5) | 47 (24.5) | 93 (15.4) |
| Nonstable housing (within last 12 months) | 15 (7.6) | 17 (8.0) | 5 (2.6) | 37 (6.1) |
Participant reported “Other” which was an available response option on the survey
Participants who were not Hispanic/Latino and reported multiple races or race as American Indian/Native Alaskan, Asian, and Native Hawaiian/Pacific Islander
Changes in Behavioral Outcomes Over Time
Descriptive Summary
The means and proportions for each outcome by time point are shown in Table 5 and are illustrated in Fig. 2a and b. Declines were observed for each outcome at both follow-up time points as compared to baseline.
Table 5.
Summary of outcomes over time in the sample analyzed for longitudinal change, CBOP-3MV Project, 2009–2011
| Outcome | Baseline | Follow-up 1 | Follow-up 2 |
|---|---|---|---|
| n=337 | n=243 | n=245 | |
| Sex partners | |||
| No. of sex partners (mean) | 1.77 | 1.26 | 1.39 |
| No. of serodiscordant/status unknown partners (mean) | 0.59 | 0.37 | 0.32 |
| Prevalence of (any) serodiscordant/status unknown partners | 31.2 % | 23.5 % | 17.6 % |
| Prevalence of (any) sex events without a condom and multiple partners | 18.7 % | 8.3 % | 10.2 % |
| Sex events | |||
| No. of sex events without a condom (mean) | 3.39 | 2.24 | 1.74 |
| Prevalence of (any) sex events without a condom | 36.8 % | 17.8 % | 19.7 % |
| No. of sex events with serodiscordant/status unknown partners (mean) | 2.20 | 1.13 | 1.09 |
| No. of sex events without a condom with serodiscordant/status unknown partners (mean) | 0.44 | 0.17 | 0.16 |
| Prevalence of (any) sex events without a condom with serodiscordant/status unknown partners | 12.8 % | 4.5 % | 3.3 % |
| No. of sex events without a condom with male serodiscordant/status unknown partners (mean) | 0.31 | 0.05 | 0.05 |
| Prevalence of (any) sex events without a condom with male serodiscordant/status unknown partners | 11.5 % | 2.7 % | 1.8 % |
| No. of sex events without a condom while intoxicated or high on noninjection drugs (mean) | 0.47 | 0.19 | 0.16 |
| Prevalence of (any) sex events without a condom while intoxicated or high on noninjection drugs | 13.4 % | 4.5 % | 5.3 % |
Fig. 2.

Mean and prevalence of outcomes over time, CBOP-3MV Project, 2009–2011. a Mean number. b Prevalence of one or more
GEE Analysis
Sex Partners
Results from unadjusted and multivariable models of outcomes related to sex partners are presented in Table 6. For the following outcomes, there was a significant decline in the risk behavior at both follow-ups as compared to the baseline in the unadjusted model: (1) the number of sex partners per client, (2) the number of serodiscordant/status unknown partners per client, (3) the odds of having any serodiscordant/status unknown partners, and (4) the odds of having both sex events without a condom and more than one sex partner.
Table 6.
Model results for outcomes related to sex partners (n=337), CBOP-3MV Project, 2009–2011
| No. of sex partners | No. of serodiscordant/status unknown partners | Odds of (any) serodiscordant/status unknown partners | Odds of (any) sex without a condom and multiple partners | |
|---|---|---|---|---|
| RR (95 % CI) | RR (95 % CI) | OR (95 % CI) | OR (95 % CI) | |
| Unadjusted model | ||||
| Time (ref = baseline) | ||||
| Follow-up 1 | 0.72 (0.62, 0.84)*** | 0.62 (0.47, 0.82)*** | 0.67 (0.48, 0.94)* | 0.41 (0.26, 0.64)*** |
| Follow-up 2 | 0.80 (0.69, 0.92)** | 0.58 (0.43, 0.78)*** | 0.49 (0.34, 0.71)*** | 0.51 (0.32, 0.81)** |
| Multivariable model | ||||
| Time (ref = baseline) | ||||
| Follow-up 1 | Model reduced to unadjusted model (above) | Model reduced to unadjusted model (above) | Model reduced to unadjusted model (above) | 0.40 (0.25, 0.65)*** |
| Follow-up 2 | 0.53 (0.33, 0.84)** | |||
| Race/ethnicity (ref = Black/African–American) | ||||
| Hispanic/Latino | 1.49 (0.91, 2.43) |
Covariates for age and CBO were removed from multivariable models for all outcomes based upon selection of the best fitting model.
P<0.05;
P<0.01;
P<0.001
Sex Events
Results from unadjusted and multivariable models of outcomes related to sex events are presented in Table 7. For the following outcomes, there was a significant decline in the risk behavior at both follow-ups as compared to the baseline in the unadjusted model: (1) the odds of having sex without a condom, (2) the number of sex events with serodiscordant/status unknown partners per client, (3) the odds of having sex without a condom with serodiscordant/status unknown partners, (4) the number of sex events without a condom with male serodiscordant/status unknown partners per client, (5) the odds of having sex without a condom with male serodiscordant/status unknown partners, (6) the number of sex events without a condom while intoxicated or high on noninjection drugs per client, and (7) the odds of having sex without a condom while intoxicated or high on noninjection drugs. Significant effects remained after selecting the best fitting multivariable models.
Table 7.
Model results for outcomes related to sex events (N=337), CBOP-3MV Project, 2009–2011
| No. of sex events without a condom | Odds of (any) sex without a condom | No. of sex events with serodiscordant/status unknown partners | No. of sex events without a condom with serodiscordant/status unknown partners | Odds of (any) sex without a condom with serodiscordant/status unknown partners | |
|---|---|---|---|---|---|
| RR (95 % CI) | OR (95 % CI) | RR (95 % CI) | RR (95 % CI) | OR (95 % CI) | |
| Unadjusted model | |||||
| Time (ref=baseline) | |||||
| Follow-up 1 | 0.69 (0.45,1.06) | 0.38 (0.27,0.53)*** | 0.47 (0.28,0.79)** | 0.39 (0.16,0.94)* | 0.33 (0.17,0.63)*** |
| Follow-up 2 | 0.65 (0.44,0.97)* | 0.45 (0.32,0.62)*** | 0.53 (0.35,0.80)** | 0.37 (0.14,1.01) | 0.24 (0.12,0.51)*** |
| Multivariable Model | |||||
| Time (ref = Baseline) | |||||
| Follow-up 1 | 0.69 (0.45,1.06) | 0.37 (0.26,0.52)*** | Model reduced to unadjusted model (above) | Model reduced to unadjusted model (above) | Model reduced to unadjusted model (above) |
| Follow-up 2 | 0.64 (0.42,0.98)* | 0.45 (0.32,0.63)*** | |||
| Age group (ref= 18–24) | |||||
| 13–17 | 2.88 (1.18,7.05)* | 1.47 (0.89,2.44) | |||
| 25–29 | 1.66 (0.56,4.89) | 0.37 (0.13,1.02) | |||
| CBO (ref= CBO B) | |||||
| CBO C | 0.20 (0.06,0.64)** | 0.47 (0.23,0.97)* | |||
| CBO A | 0.42 (0.22,0.81)** | 0.67 (0.44,1.00) | |||
| Race/ethnicity (ref=Black/African American) | |||||
| Hispanic/Latino | NAa | NAa |
| No. of sex events without a condom with male serodiscordant/status unknown partners | Odds of (any) sex without a condom with male serodiscordant/status unknown partners | No. of sex events without a condom while intoxicated or high on non-injection drugs | Odds of (any) sex without a condom while intoxicated or high on non-injection drugs | |
|---|---|---|---|---|
| RR (95 % Cl) | OR (95 % Cl) | RR (95 % Cl) | OR (95 % Cl) | |
| Unadjusted model | ||||
| Time (ref=baseline) | ||||
| Follow-up 1 | 0.17 (0.07,0.40)*** | 0.22 (0.10,0.50)*** | 0.40 (0.20,0.82)* | 0.32 (0.18,0.56)*** |
| Follow-up 2 | 0.16 (0.05,0.56)** | 0.15 (0.06,0.39)*** | 0.41 (0.22,0.77)** | 0.42 (0.25,0.70)** |
| Multivariable Model | ||||
| Time (ref = Baseline) | ||||
| Follow-up 1 | 0.18 (0.07,0.44)*** | Model reduced to unadjusted model (above) | 0.41 (0.20,0.82)* | 0.27 (0.13,0.54)*** |
| Follow-up 2 | 0.18 (0.05,0.60)** | 0.41 (0.22,0.77)** | 0.47 (0.27,0.81)** | |
| Age group (ref= 18–24) | ||||
| 13–17 | NAa | 0.51 (0.15,1.73) | NAa | |
| 25–29 | NAa | 0.92 (0.19,4.48) | NAa | |
| CBO (ref= CBO B) | ||||
| CBO C | 0.79 (0.24,2.60) | NAa | NAa | |
| CBO A | 0.77 (0.29,2.03) | NAa | NAa | |
| Race/ethnicity (ref=Black/African American) | ||||
| Hispanic/Latino | 1.12 (0.40,3.10) | NAa | 2.09 (1.12,3.90)* |
Differential Changes by CBO and Other Covariates
No significant interactions were observed by CBO, indicating that there were no statistically significant differences in risk behavior changes among CBOs. Due to differences in implementation, however, these were further explored by conducting stratified analyses (e Table 3). Except for CBO C, for which a small number of individuals were included in the longitudinal analysis (n=32), risk behaviors showed a declining trend. Not all declines were statistically significant in the CBO analyses, as the sample sizes were relatively small. No significant increases in risk were observed.
When assessing interactions for the number of sex events without a condom per client, the interaction between age and follow-up 1 was significant for both the 13- to 17-year-old group (RR=2.19; 95 % CI: 1.07, 4.49) and the 25- to 29-year-old group (RR=0.05; 95 % CI: 0.00, 0.64) as compared to the 18- to 24-year-old group. Stratified analyses were conducted to further explore these results. Among participants 13–17 and 18–24 years old, there were no significant differences at either follow-up times. For participants 25–29 years old, a significant decline was observed at follow-up 1 (RR=0.03; 95 % CI: 0.00, 0.21), but not at follow-up 2 (RR=0.29; 95 % CI: 0.06, 1.37). No other significant interactions between follow-up and covariates were observed.
Potential Impact of Losses to Follow-Up
All analyses were conducted under the assumption of missing completely at random. To assess the potential impact of losses to follow-up, sensitivity analyses for the unadjusted models were conducted in which missing outcome data were imputed using the last observation carried forward (LOCF; Streiner and Geddes 2001). For this analysis, LOCF makes a conservative assumption in that risk behaviors are assumed to stay the same over time. Statistically significant reductions in risk behaviors persisted, with the exception of the number of sex events without a condom, which was significant at follow-up 2 in the nonimputed model, but not after imputation (RR= 0.80; 95 % CI: 0.60, 1.07 (e Table 4).
Discussion
The results from this outcome monitoring project suggest that 3MV may lead to reductions in HIV-related risk behaviors for young MSM of color and those reductions may be sustained for at least 6 months following 3MV. In the unadjusted models, participants reported a decrease in 11 of 13 risk behaviors 3 and 6 months after the intervention. Postintervention reductions in HIV risk behaviors were similar to or stronger than those observed in other HIV risk behavior studies (Fisher et al. 2011; Heitgerd et al. 2011; Sapiano et al. 2013; Johnson et al. 2008) and those reported in the original randomized trial of 3MV (Wilton et al. 2009).
Interestingly, there was not a reduction in the number of sex events without a condom at follow-up 1 for the youngest age group (13–17 years old) as there was for those 18 and older. The fact that 13–17 years old reported a higher number of sex events without a condom than those aged 18–24 across all time points indicates that this is an important age group to target for HIV prevention services.
CBOs reported few adaptations to the intervention content, and despite the large variation in the mean intervention cycle duration and group size across CBOs, there were no significant differences in risk behavior changes across CBOs. This finding suggests that CBOs may have some latitude in the intervention delivery structure and format. Nonetheless, it is important for CBOs to routinely monitor and assess the delivery of 3MV to ensure that the intervention is being delivered with fidelity and in a way that effectively incorporates its core elements.
The majority of 3MV participants in this project (84 %) completed all 3MV sessions. Participants who missed at least one session reported more HIV-related risk behaviors across all time points than participants who attended all sessions. These individuals may be more transient or stigmatized, or have competing priorities, and so may require more intensive retention efforts by CBOs. CBOs should consistently engage with their target population and use strategies that appeal to them (e.g., social media for youth and a safe space for social support) and individuals who engage in high-risk behaviors should be prioritized for HIV prevention services.
This study did not ask participants whether the risk behaviors they engaged in were with primary or casual partners. It is possible that participants were less likely to use condoms with their primary partners versus their casual partners, and this may have been why we did not see a reduction in sex events without a condom for 13–17 years old. Because it is even more likely for young MSM to acquire HIV from their primary partners as compared to their casual partners (Davidovich et al. 2001), it is important to make young MSM aware of the risk of acquiring HIV (even from their primary partners) as well as provide information about the range of prevention strategies in addition to condom use (e.g., appropriate timing of HIV testing, biomedical prevention strategies, and effective communication skills) that can minimize their risk with both primary and casual partners.
There are limitations related to the design and approach of this project that must be considered along with its promising findings. First, all participants’ data were self-reported to a CBO staff member. There are potential biases associated with self-reported data and participants’ efforts to appear socially desirable, especially when answering questions about their HIV-related risk behaviors. Future studies could use computer-based questionnaires to potentially reduce social desirability bias. Second, the participants included in this analysis chose to be a part of the 3MV as well as the outcome monitoring project. This self-selection may limit the general-izability of the results to other members of the target population. Third, this project lacked a control group which limits our ability to attribute the changes in behavior to the intervention. Fourth, retention rate across CBOs for the outcome monitoring study were 68 % for follow-up 1 and 71 % for follow-up 2, and 17 % did not complete either follow-up. Although loss to follow-up was not associated with age group, race/ethnicity, or education, individuals lost to follow-up reported higher risk at baseline than individuals not lost to follow-up. This may have introduced a self-selection bias such that the participants who were retained for follow-up may have been more receptive to the intervention than those who were lost to follow-up. Finally, we excluded follow-up data for 145 individuals at CBO C due to concerns related to poor data quality at data collection. These clients reported significantly higher risk at baseline than those clients who were not excluded. Finally, information on additional HIV prevention services the participants received while enrolled in 3MV was not collected, so the impact of additional services cannot be eliminated as a possible explanation of the positive behavioral changes.
Despite these limitations, this project can now be added to the growing number of CBOP projects that have found significant reduction in risk behaviors associated with client participation in EBIs implemented at CDC-funded CBOs (Fisher et al. 2011; Heitgerd et al. 2011; Sapiano et al. 2013). These EBIs include VOICES/VOCES, Healthy Relationships, and SISTA. Importantly, the findings from this project are consistent with the original randomized trial study, which found that black MSM reduced HIV-related risk behaviors after participating in 3MV (Wilton et al. 2009). In the original study, participants who received the 3MV intervention reported greater reduction in condomless anal intercourse with casual partners and in the number of male sex partners than participants in the comparison condition at 3 and 6 months after the intervention. The current project provides additional evidence for effectiveness of 3MV in reducing HIV-related risk behaviors for young MSM of color.
CDC’s high-impact HIV prevention approach calls for interventions that are practical to implement on a large scale, at a reasonable cost (CDC 2011). The 3MV intervention conducted at these three CBOs was delivered in 1 week’s time or less, and many were delivered on a single day or over a weekend, which indicates that the intervention is capable of reaching a large number of men at very high risk for HIV in a relatively short period of time.
NHAS calls for an emphasis on HIV prevention in the communities where HIV is most heavily concentrated and an expanded use of effective combinations of evidence-based HIV prevention approaches (Office of National AIDS Policy 2010). Because young MSM of color bear a disproportionate burden of the HIV epidemic, evidence-based interventions such as 3MV that are specifically tailored to this target population need to be prioritized as part of the CDC’s approach to reducing HIV infections in the USA. In 2014, CDC’s Division of HIV Prevention will only fund Effective Behavioral Interventions that have maximum prevention benefits in reducing new HIV infections (CDC 2011). 3MV will be included in this list of interventions, and CDC will continue to support 3MV nationwide through funding for implementation, provision of training, and technical assistance.
Supplementary Material
Footnotes
Electronic supplementary material The online version of this article (doi:10.1007/s11121-015-0565-8) contains supplementary material, which is available to authorized users.
Conflict of Interest The authors declare that they have no conflict of interest.
References
- Centers for Disease Control and Prevention. (2008). CDC funding opportunity announcement PS06–618. http://www.cdc.gov/od/pgo/funding/PS08-812.htm.Accessed11 Jul 2014.
- Centers for Disease Control and Prevention. (2009). Many Men, Many Voices: A group-level intervention for gay men of color fact sheet. http://www.effectiveinterventions.org/Libraries/3MV_Implementation_Materials/3MV_Fact_Sheet.sflb.ashx.Accessed11 Jul 2014.
- Centers for Disease Control and Prevention. (2011). High-impact HIV prevention: CDC’s approach to reducing HIV infections in the United States. http://www.effectiveinterventions.org/Libraries/General_Docs/12-0209_HIP_CDCs_Approach_red_booklet.sflb.ashx.Accessed11 Jul 2014.
- Centers for Disease Control and Prevention. (2012a). HIV surveillance supplemental report 2012; 17. Estimated HIV incidence in the United States, 2007–2010. http://www.cdc.gov/hiv/pdf/statistics_hssr_vol_17_no_4.pdf.Accessed11 Jul 2014.
- Centers for Disease Control and Prevention. (2012b). Effective interventions: HIV prevention that works. http://www.effectiveinterventions.org/en/home.aspx.Accessed11 Jul 2014.
- Centers for Disease Control and Prevention. (2014). Compendium of evidence-based HIV behavioral interventions. http://www.cdc.gov/hiv/dhap/prb/prs/index.html.Accessed11 Jul 2014.
- Collins C, Harshbarger C, Sawyer R, & Hamdallah M (2006). The diffusion of effective behavioral interventions project: Development, implementation, and lessons learned. AIDS Education and Prevention, 18, 5–20. [DOI] [PubMed] [Google Scholar]
- Davidovich U, de Wit J, Albrecht N, Geskus R, Stroebe W, & Coutinho R (2001). Increase in the share of steady partners as a source of HIV infection: A 17-year study of seroconversion among gay men. AIDS, 15, 1303–1308. [DOI] [PubMed] [Google Scholar]
- Fisher HH, Patel-Larson A, Green K, Shapatava E, Uhl G, Kalayil EJ, et al. (2011). Evaluation of an HIV prevention intervention for African Americans and Hispanics: Findings from the VOICES/VOCES Community-Based Organization Behavioral Outcomes Project. AIDS and Behavior, 15, 1691–1706. [DOI] [PubMed] [Google Scholar]
- Gardner WI, Mulvey EP, & Shaw EC (1995). Regression analyses of counts and rates: Poisson, overdispersed Poisson, and negative binomial models. Psychological Bulletin, 118, 392–404. [DOI] [PubMed] [Google Scholar]
- Heitgerd JL, Kalayil EJ, Patel-Larson A, Uhl G, Williams WO, Griffin T, & Smith BD (2011). Reduced sexual risk behaviors among people living with HIV: Results from the healthy relationships outcome monitoring project. AIDS and Behavior, 15, 1677–1690. [DOI] [PubMed] [Google Scholar]
- Johnson WD, Diaz RM, Flanders WD, Goodman M, Hill AN, Holtgrave D, et al. (2008). Behavioral interventions to reduce risk for sexual transmission of HIVamong men who have sex with men. Cochrane Database of Systematic Reviews, 16, CD001230. mrw.interscience.wiley.com/cochrane/clsysrev/articles/CD001230/frame.html. Accessed 11 Jul 2014. [DOI] [PubMed] [Google Scholar]
- Liang KY, & Zeger SL (1986). Longitudinal data analysis using generalized linear models. Biometrika, 73, 13–22. [Google Scholar]
- Lix LM, & Keselman HJ (1998). To trim or not to trim: Tests of location equality under heteroscedasticity and nonnormality. Educational and Psychological Measurement, 58, 409–429. [Google Scholar]
- Office of National AIDS Policy. (2010). National HIV/AIDS strategy for the United States. http://www.whitehouse.gov/sites/default/files/uploads/NHAS.pdf.Accessed11 Jul 2014.
- Pan W (2001). Akaike’s information criterion in generalized estimating equations. Biometrics, 57, 120–125. [DOI] [PubMed] [Google Scholar]
- Sapiano T, Moore A, Kalayil E, Zhang X, Chen B, Uhl G, et al. (2013). Evaluation of an HIV prevention intervention designed for African American women: Results from the SISTA Community-Based Organization Behavioral Outcomes Project. AIDS and Behavior, 17, 1052–1067. [DOI] [PMC free article] [PubMed] [Google Scholar]
- Streiner D, & Geddes J (2001). Intention to treat analysis in clinical trials when there are missing data. Evidence-Based Mental Health, 4, 70–71. [DOI] [PubMed] [Google Scholar]
- Venigas RC, Kao UH, & Rosales R (2009). Adapting HIV prevention evidence-based interventions in practice settings: An interview study. Implementation Science, 4, 76.1–76.9. [DOI] [PMC free article] [PubMed] [Google Scholar]
- Wilton L, Herbst JH, Coury-Doniger P, Painter T, English G, Alvarez ME, et al. (2009). Efficacy of an HIV/STI prevention intervention for black men who have sex with men: Findings from the Many Men, Many Voices (3MV) project. AIDS and Behavior, 13, 532–544. [DOI] [PubMed] [Google Scholar]
Associated Data
This section collects any data citations, data availability statements, or supplementary materials included in this article.