

Abstract
Background
Chinese materia medica processing is a distinguished and unique pharmaceutical technique in Traditional Chinese Medicine (TCM) used for reducing side effects, and increasing or even changing therapeutic efficacy of the raw herbs.Changes in the essential components induced by an optimized processing procedure are primarily responsible for the increased efficacy of medicinal plants.The kidney-yang invigorating effect of rice wine-steamed Cistancha deserticola (C. deserticola) was stronger than raw C. deserticola (CD).
Methods
A comparison analysis was carried out using the UPLC-Q-TOF-MSE with the UNIFI informatics platform to determine the influence of processing. In vitro studies were performed for the characterization of constituents as well as metabolites in vivo. The chemical components were determined in CD and its processed products. The multivariate statistical analyses were conducted to evaluate variations between them while OPLS-DA was used for pairwise comparison.
Results
The results of this study revealed considerable variations in phenylethanoid glycosides (PhGs) and iridoids after processing. A total of 97 compounds were detected in the extracts of CD and its processed product. PhGs having 4'-O-caffeoyl group in the 8-O-β-d-glucopyranosyl part, like acteoside, cistanoside C, campneoside II, osmanthuside decreased after being processed, while PhGs with 6'-O-caffeoyl group in the 8-O-β-d-glucopyranosyl part, such as isoacetoside, isocistanoside C, isocampneoside I, isomartynoside increased, especially in the CD-NP group. The intensity of echinacoside and cistanoside B whose structure possess 6'-O-β-d-glucopyranosyl moiety also increased. In in vivo study, 10 prototype components and 44 metabolites were detected in rat plasma, feces, and urine. The obtained results revealed that processing leads to the considerable variation in the chemical constituents of CD and affected the disposition of the compounds in vivo, and phase II metabolic processes are the key cascades of each compound and most of the metabolites are associated with echinacoside or acteoside.
Conclusions
This is the first global comparison research of raw and processed CD. These findings add to our understanding of the impact of CD processing and give important data for future efficacy investigations.
Keywords: Cistanche deserticola, Processing, UPLC-Q-TOF-MSE, Chemical profiles, Metabolites in vivo
Introduction
Chinese materia medica (CMM) processing has demonstrated significant applicability in Traditional Chinese Medicine (TCM) clinical practice, and it has been considered a viable treatment for several centuries. This is a unique pharmaceutical technology that has been derived from the theory of TCM. Following processing, significant differences in the appearance, chemical constituents, characteristics, and medicinal significance of all types of TCMs have been identified, leading to the assumption that processing could improve the efficacy or reduce the TCM's toxic effects.
For hundreds of years, Cistanche deserticola (Roucongrong in Chinese, CD) is commonly used in TCM clinical practice for supplementing the functions of the kidney. It also helps in the moisturizing of the intestine that leads to relaxing bowel [1]. Cistanche was firstly recorded in ShenNongBencaoJing. It is commonly found in arid and semi-arid habitats across Eurasia and North Africa, including Iran, China, India, and Mongolia [2]. The processing of CD has been carried out by steaming with rice-wine under normal pressure, which is a preparation method documented in the Chinese pharmacopeia (Jiucongrong in Chinese, hereinafter called “CD-NP”). And CD steaming with rice-wine under high pressure is a more effective preparation method (hereinafter called “CD-HP”) [3, 4]. Several studies have been revealed that the pharmacological effects of CD are different from its processed products [5]. CD may tonify kidney-yang and relax bowel, while after being steamed by rice-wine, the effect of replenishing the kidney-yang would be strengthened. In our earlier study, it has been found that CD-NP could enhance tonification of the kidney and support yang, and relieve the effect of moistening intestines and defecating [6–8]. In clinical practice, the processed products are the most commonly used form.
Up to date, several studies have analyzed the chemical components of CD, followed by isolation and identification of more than 100 compounds [9–11], such as phenylethanol glycosides (PhGs), iridoids, lignans, and oligosaccharides as its main chemical constituents. It has also been reported that there are many pharmacological activities of PhGs including immunomodulatory, neuroprotective, hepatoprotective, anti-inflammatory, and anti-oxidative, etc.[12–14]. Iridoids possess anti-inflammatory activities [15, 16]. It has also been revealed by earlier studies that some chemical components showed variations during the processing [17–20]. Based on these reports, it can be assumed that post-processing, the variations in chemical composition lead to various pharmacological effects, which need to be further explored.
In the current study, a sensitive and effective method i.e., ultra-high performance liquid chromatography coupled with TOF-MSE (UPLC-Q-TOF-MSE) was performed for comparative analysis, and in-vitro studies were performed to qualitatively analyze the extracts of CD, CD-NP, and CD-HP for elucidating their chemical profiles. Generally, the exogenous chemicals with high exposure in target organs were regarded as effective components. Therefore, in rats, CD and its processed products were orally administered respectively, followed by their characterization. The existing study reveals a comparative study (both in vitro and in vivo) of raw and processed CD for the first time. The obtained results would expand our understanding regarding the effect of CD processing, which might be helpful for further studies.
Materials and methods
Materials
Standard compounds of ajugol (180120) and 2'-actylacetoside (M0601AS) were provided by Chendu Pure Chem-Standard Co., Ltd (Chengdu, China). Cistanoside F (MUST-17022620), echinacoside (D1105AS), cistanoside A (M0906AS), and isoacteoside (M0106AS) were provided by Must company (Sichuan China); acteoside (O0618AS), salidroside (J0526AS), catalpol (S0728AS), geniposide (A0407AS), and geniposidic acid (MB6001-S) were acquired from Dalian Meilun Bio.Co., Ltd (Dalian, China). 8-epideoxyloganic acid (B31123) was obtained from Shanghai Yuanye Biological Technology Co., Ltd, China. Methanol and acetonitrile were of MS-grade and were obtained from Merck KGaA, Darmstadt, Germany. Methanoic acid (CH2O2) of HPLC grade was provided by Merck KGaA (Darmstadt, Germany). The water, used in the existing study was processed via the Milli-Q system (18.2 MΩ, Millipore, Ma, USA). Rice-wine was provided by Brand Tower Shaoxing Wine Co., Ltd. (Zhejiang, China).
Cistanch deserticola was collected from Neimenggu wangyedi cistanche Co. Ltd. The samples were identified by Prof. Yanjun Zhai (school of pharmacy, Liaoning University of TCM). The specimens were submitted to the Liaoning University of Traditional Chinese Medicine.
Animals
Sprague–Dawley male rats (SPF grade) with 180–220 g of total body weight were provided by Liaoning Changsheng biotechnology Co. Ltd. (Laboratory Animal Resource Center of Liaoning Province, license number: SCXK-2015–0001). These rats were housed in a breeding room with well-maintained temperature, and humidity i.e., 20–26 ℃, 50–70% for one week. The rats were fed with usual lab food and water before experimentation. The animals fasted overnight, however, the water ad libitum was provided before the experimentation. The rats were executed with a 10% of chloral hydrate anesthetic. The Institutional Animal Ethics Committee of Liaoning Provincial Hospital of Chinese Medicine approved all of the experimental protocols (2019.3.25, 2019015).
Preparation of CD, CD-NP, and CD-HP extract
CD-NP, CD-HP were processed from the same batch of Cistanch deserticola. To prepare CD-NP, dry CD pieces (5 mm thick, 100 g) were moisturized with rice-wine (30 mL) and were steamed at 100 ℃ for 16 h., followed by drying at 55 ℃ via drying oven. While CD-HP was prepared via infiltration of dry CD pieces (5 mm thick, 100 g) with rice-wine (30 mL), followed by steaming at 1.25 atmospheric pressure for 4 h. and then dried in a drying oven at 55 ℃.
In a 100 mL measuring flask, one gram of the powder was sieved via sieve#4, followed by adding 50% of methanol (50 mL) and then tightly covered and mixed. This mixture was weighed, followed by half hrs. maceration. After maceration, the mixture was ultrasonicated (power 250 W, frequency 35 kHz) for 40 min, followed by cooling, and weighing again. The loss of the weight was replenished with 50% methanol, properly mixed, and allowed to stand, followed by filtering the supernatant and then used the obtained filtrate as the test solution.
MSE analysis of active components
Preparation of standard substances: tubuloside-A (3.02 mg), echinacoside (3.00 mg), 2'-acetylacteoside (2.34 mg), acteoside (2.45 mg), isoacteoside (0.61 mg), cistanoside-F (2.14 mg), salidroside (3.39 mg), geniposide (2.84 mg), ajugol (1.58 mg), catalpol (2.39 mg), geniposidic acid (2.56 mg), and 8-epideoxyloganic acid (2.34 mg) were added into a 10 mL volumetric flask, added methanol constant volume to scale, configured into a corresponding concentration reference solution. Each of the 100 μL was configured into a mixed reference solution.
MS analysis condition: The mass value was corrected before the experiment, and the negative ion mode was used. The range of mass was 50–1200 Da, and the sample was injected through a flow injection pump. The cone velocity was 100 L/hrs, the dissolvent flow rate was set at 800 L/h. The capillary and cone voltages were fixed at 2500 and 40 V, accordingly. The temperature of the ion source and dissolvent gas was 100 ℃ and 400 ℃ respectively, and signal acquisition frequency was 0.5 S−1。
UPLC-Q-TOF-MSE analysis of CD extract
Chromatographic evaluations were carried out in a Waters ACQUITY I-CLASS UPLC system (Waters Corporation, Milford, MA, USA). Including ACQUITY UPLC® BEH C18 column (50 × 2.1 mm, 1.7 μm, Waters). The mobile phase was comprised of water having 0.1% formic acid (A) and acetonitrile contains 0.1% formic acid (B), the elution condition was as follows: 97% to 85% A (0–5 min), 85% to 75% A (5–15 min), 75% to 65% A (15–16 min), 65% to 55% A (16–18 min). The flow rate was 0.3 mL min−1, while the temperature of the auto-sampler room and column was 30 ℃ and 8 ℃ separately. The injection volume was 1.0 μL.
The mass spectrometric evaluation was carried out via Waters XEVO G2-XS QTOF MS (Waters Corporation, Milford, MA, USA), comprising an ESI source. The flow rate of nitrogen gas was fixed at 800 L·hrs−1 with a temp of 400 ℃, the source temp was fixed at 100 ℃, and the cone gas was set at 50 L h−1. The voltage of cone and capillary was adjusted at 40 and 2000 V, accordingly. The collision energy of the ramp was used in the range of 20–30 V. The centroided data of all samples were obtained from 50 to 1200 Da, with a 5-scan time of 0.5 s over an analysis time of 10 min. LockSpray TM was employed for the validation of the mass precision. The [M–H]− ion of leucine enkephalin (200 pg·μL−1 infusion flow rate 10 μL min−1) at m/z 554.2615 was used as the lock mass. The MassLynx V4.1 software (Waters Co., Milford, USA) was employed for the accurate mass, the composition of the precursor ions, and the fragment ions calculation.
Data analysis in Masslynx platform
Furthermore, an in-house library comprising the name of the compound, its structure, and the molecular formula (in mol.) was set up based on literature. All the compounds were noted in a special template, made in Excel. In addition, the mol files (Chemdraw Ultra 8.0, Cambridge soft, USA) and the Excel files of all the individual compound structures were also saved on the local PC. The established Excel-sheet having important data was directly imported into the scientific library in UNIFI.
UNIFI 1.8.2, Waters, Manchester, UK was employed for the evaluation of structural characteristics, particularly for the characteristic fragments and MS fragmentation. A minimum peak area of 500 was set for the 2D peak detection. During revealing 3D peaks, a low energy peak intensity of more than 300 counts and elevated energy peak intensity of more than 80 counts were chosen. The error of mass was found to be up to ± 10 ppm for known compounds, and the retention time tolerance was set in the range of ± 0.1 min. We selected the negative adducts containing –H, + HCOOH. The processing of the raw data obtained from MS was carried out via streamlined UNIFI software to rapidly pinpoint the chemical components that met the standards with the self-built database and the in-house Traditional Medicine Library.
Next, to verify the chemical structure of each target compound, the isomers were distinguished by their characteristic MS fragmentation patterns which were revealed in the reported studies, and by comparing the retention times of reference standards.
Metabolomics analysis based on multivariate statistical analysis
Before processing the raw data, the parameters were set, such as mass ranging from 150 to 1200 Da, range of retention time (0 to 20 min), threshold intensity (2000 counts), mass tolerance i.e., 5 mDa, while mass and retention time window was 0.20 min and 0.05 Da, respectively. In the subsequent list of the database, the identifier of ions was the RT-m/z pairs with respect to their elution times. The same values for RT and m/z in various batches of samples were considered as the same compound.
Multivariate statistical analysis was conducted to evaluate effective biomarkers that considerably contributed to variations among different groups. During the analysis, principal component analysis (PCA) was employed to indicate the maximum differences and pattern recognition for obtaining an overview and classification. The OPLS-DA is a modeling tool that provides visualization of the OPLS-DA predictive component loading to assist model evaluation. Variable importance for the projection (VIP) was used for assessing the evaluation of various components, and the metabolites with VIP values > 1.0 and P-value < 0.05 were regarded as effective markers. Furthermore, a permutation test was conducted for providing reference distributions for the R2/Q2 values that could show the statistical significance.
Animal experiments
The rats were randomly categorized into four groups (n = 6 for each group), followed by the oral administration of various extracts: (1) Blank control group: the rats were given normal saline (2 mL/100 g); (2) CD group: the rats were given CD extract (2 mL/100 g); (3) CD-NP group: the rats were given CD-NP extract (2 mL/100 g); (4) CD-HP group: the rats were given CD-HP extract (2 mL/100 g). The further categorization of all groups was carried out into three sub-groups for plasma, urine, and feces, accordingly. Two hours later, each rat was orally administered with the same and equal amount of extracts.
Post administration, the collection of blood samples was carried out at 1.0 h, 2.0 h, and 4.0 h in heparinized 1.5 mL polythene tubes (from orbital veins), followed by centrifugation (at 4500 rpm) of all samples for 15 min.
For urine and feces samples, the rats were held in metabolism cages, and then the collection of urine and feces samples was carried out for 24 h after administration. The centrifugation of urine samples was carried out at 4500 rpm for 15 min, while feces samples were dried in the shade, ground into powder, then 0.2 g was taken, and added into 0.5 mL saline solution, ultrasound for 5 min, and centrifuged at 12,000 rpm for 15 min. All the bio-samples were kept at − 80 ℃ until analysis.
Preparation of biological samples
The addition of plasma, urine, and feces samples was carried out with 3 volumes of methanol, followed by vortexing for 3 min. Next, the centrifugation (at 12,000 rpm) of the mixtures was carried out for 10 min, followed by transferring supernatant into the EP tube, and then dried by nitrogen at 37 ℃. Furthermore, the addition of 200 μL of HCN–H2O (50%) solution was carried out. Then, the vortex was used for mixing (1 min), followed by centrifugation (at 12,000 rpm) for 5 min. The supernatant (5 μL) of the treated samples was injected into the UPLC-Q-TOF-MSE system.
Liquid chromatographic and mass spectrometric condition
The analysis for metabolites was also performed by the Waters UPLC instrument through an ESI interface. Separations were carried out using an Acquity UPLC HSS T3 column (100 mm × 2.1 mm, 1.8 µm), the mobile phase was 0.1% formic acid (A): Acetonitrile (B), the gradient elution condition was 0–3 min (99.8% → 98% A), 3–5 min (98% → 95% A), 5–8 min (95% → 90% A), 8–12 min (90% → 85% A), 12–17 min (85% → 70% A), 17–22 min (70% → 60% A), 22–23 min (60% → 58% A), 23–25 min (58% A), 25–32 min (58% → 45% A), and 32–37 min (45% → 35% A), 0.4 mL min−1 was the flow rate. The temperature for the column and sample room was set at 40 ℃ and 8 ℃ respectively. The mass spectrometry conditions mentioned above were used.
Strategy for systematic analysis of metabolites in bio-samples
UNIFI (1.8.2) software was employed for data processing. The Binary Compare function was used for the identification of effective metabolites. Evaluated metabolites were not existing in the equivalent control sample or exist at low ion intensities. The relative intensity threshold was set at 3 or 5, and metabolites that fulfilled the underlined criteria could be evaluated. Common and predictable metabolites were then determined by EIC. For searching of two-phase metabolites, the NLF function was applied. For example, in the UNIFI software, the parameters could be set at 176.0321 for searching for possible glucuronic acid conjugates. Post-processing, a neutral loss can be set in the method or identified. MassFragment was used for determining or characterization of detected metabolites' structures, a UNIFI’s spectral interpretation function is the main function used to analyze secondary fragmentation of parent components. This function can be used for rapid verification of the fragmentation path whether reasonable.
Results
Mass fragmentation rule of phenylethanoid glycosides and iridoids
Phenylethanoid glycosides are the main chemical constituents of CD. The standard solutions of isoacteoside, cistanoside F, tubuloside A, echinacoside, acteoside, and 2'-actylacteoside were taken, followed by providing a different level of collision energies (Table 1), and then corresponding MS2 maps were obtained (Fig. 1).
Table 1.
Collision energy for standard substances
| Components | Molecular | Theoretical mass (Da) | Detected mass (Da) | Fragment | Energy (v) |
|---|---|---|---|---|---|
| Isoacteoside | C29H36O15 | 623.1976[M–H]− | 623.1956[M–H]− | 461.1636, 315.1636, 179.0354, 161.0232 | 35 |
| Cistanoside F | C21H28O13 | 487.1452[M–H]− | 487.1423[M–H]− | 179.0326, 135.0440 | 20 |
| Tubuloside A | C37H48O21 | 827.2610[M–H]− | 827.2852[M–H]− | 665.2477, 623.2388, 477.1722, 161.0202 | 40 |
| Echinacoside | C35H46O20 | 785.2505[M–H]− | 785.2651[M–H]− | 623.2286, 477.1677, 179.0374, 161.0250 | 45 |
| Acteoside | C29H36O15 | 623.1976[M–H]− | 623.2030[M–H]− | 461.1691, 179.0374, 161.0250 | 25 |
| 2'-actylacteoside | C31H38O16 | 665.2082[M–H]− | 665.2108[M–H]− | 623.1979, 503.1784, 461.1647, 179.0374, 161.0250 | 30 |
| Ajugol | C15H24O9 | 347.1342[M–H]− | 347.1410[M–H]− | 185.0845, 167.0721, 149.0624, 127.0413 | 25 |
| Catalpol | C15H22O10 | 361.1135[M–H]− | 361.1131[M–H]− | 199.0586, 169.0486, 151.0380, 125.0332 | 50 |
| Geniposidic acid | C16H22O10 | 373.1135[M–H]− | 373.1143[M–H]− | 211.0602, 193.0500, 149.0608, 167.0703, 123.0453 | 30 |
| Geniposide | C17H24O10 | 387.1291[M–H]− | 387.1313[M–H]− | 225.0787, 207.0678, 123.0453 | 10 |
| 8-epideoxyloganic acid | C16H24O9 | 359.1342[M–H]− | 359.1345[M–H]− | 197.0810, 153.0916, 135.0823 | 40 |
Fig. 1.

Mass Spectrogram and cleavage pathway of phenylethanoid glycosides. A Isoacteoside; B cistanosideF; C tubulosideA; D echinacteoside; E acteoside; F 2'-actylacteoside
The mass spectrometric analysis revealed that phenylethanoid glycosides have similar mass spectrum fragmentation patterns, the cleavage pathways in the negative-ion mode mainly include: (1) Ester bond cleavage: loss of neutral caffeoyl group (C9H3O6, 162.03) and neutral acetyl group (C2H2O, 42.00); (2) Glycosidic cleavage: loss of neutral rhamnose residues (C6H10O4, 146.05) and neutral glucose residue (C6H10O5, 162.05). From high-resolution mass spectrometry, caffeoyl (162.03) and glucose residue (162.05) could be distinguished.
Iridoids ajugol, catalpol, geniposidic acid, geniposide, and 8-epideoxyloganic acid standard solutions were taken, followed by providing different collision energies, and corresponding MS2 maps were obtained (Fig. 2).
Fig. 2.

Mass Spectrogram and cleavage pathway of iridoid glycosides. A Ajugol, B catalpol, C geniposidic acid, D geniposide, E 8-epideoxyloganic acid
Iridoid glycosides have similar mass spectrum fragmentation patterns, the cleavage pathways in the negative-ion mode mainly include (1) Glycosidic cleavage: Loss of neutral glucose residue (C6H10O5, 162.05); (2) Loss of neutral CO2 (43.99) and H2O (18.01).
Identification of the compounds in CD, CD-NP, and CD-HP extracts
UPLC-QTOF-MSE analysis
The optimization of chromatographic conditions was carried out. Next, the compounds of Cistanche Herba were evaluated in both negative and positive ion modes with high as well as low CEs. The obtained results revealed that the compatibility of the negative mode was higher relative to the positive mode for these compounds. Figure 3 showed MS basic peak ion (BPI) chromatogram traced with numbered peaks. The intensity of each detected ion in UPLC-Q-TOF-MSE analysis was normalized with respect to the whole ion count for the generation of a data matrix which comprised of m/z value, the normalized peak area, and retention time.
Fig. 3.

The base peak intensity (BPI) of the samples. 1.CD, 2. CD-NP, 3. CD-HP
The evaluation of components from CD and its processed products on the UNIFI platform
A total of 97 compounds were identified with -SEM (n = 6) mode from CD and its processed product (Table 2), including phenylethanoid glycosides (PhGs), iridoids, lignans, and oligosaccharides. The 95, 91, and 94 components were detected in CD, CD-NP, and CD-HP, accordingly. Among them, 64 were phenylethanoids, 13 were iridoids, and 20 other kinds of compounds were determined. There was a similarity in the chemical composition of CD and its processed product, however, the quantity of the components was found to be different among CD and its processed product.
Table 2.
Evaluation of Compounds obtained from CD and its processed products by UPLC-Q-TOF-MSE
| NO | RT | Identification | Molecular formula | Adducts | Experimental | Theoretical | Error (ppm) |
MS/MS fragmentation | source |
|---|---|---|---|---|---|---|---|---|---|
| 1 | 1.10 | Kankanoside B | C15H24O10 | + HCOO | 409.1348 | 364.1369 | 0.2 | 363.12870, 183.06693, 153.05619 | CD, CD-HP |
| 2 | 1.22 | 6-Deoxycatalpol | C15H22O9 | + HCOO | 391.1245 | 346.1260 | 0.5 | 391.12447, 341.10886, | CD, CD-NP, CD-HP |
| 3 | 1.44 | 6-Deoxycatalpol | C15H22O9 | + HCOO | 391.1245 | 346.1260 | 0.5 | 391.12448, 183.06662 | CD, CD-HP |
| 4 | 2.04 | Androsin | C15H20O8 | + HCOO | 373.1143 | 328.1163 | 0.8 | 373.11434, 211.06188, 193.05142 | CD, CD-NP, CD-HP |
| 5 | 2.25 | 6-Deoxycatalpol | C15H22O9 | + HCOO | 391.1245 | 346.1260 | 0.5 | 391.12446, 229.07232, 167.03571 | CD, CD-NP, CD-HP |
| 6 | 2.58 | Androsin | C15H20O8 | + HCOO | 373.1147 | 328.1166 | 1.2 | 373.11471, 299.11294, 211.06206, 149.06137 | CD, CD-NP, CD-HP |
| 7 | 2.64 | Kankanoside L | C15H24O9 | + HCOO | 393.1404 | 348.1421 | 0.7 | 393.14046, 315.10749, 206.06863, 134.04736 | CD, CD-NP, CD-HP |
| 8 | 2.93 | kankanoside M | C15H22O8 | + HCOO | 375.1297 | 330.1318 | 0.6 | 375.12966, 213.07775, 125.06127 | CD, CD-NP, CD-HP |
| 9 | 3.14 | 3,4-dimethoxybenzyl-β-d-glucoside | C16H24O10 | –H | 375.1299 | 376.1373 | 0.8 | 375.12994, 255.08683, 213.07767, 151.07707 | CD, CD-NP, CD-HP |
| 10 | 3.22 | Decaffeoylacteoside | C20H30O12 | –H | 461.1659 | 462.1734 | 0 | 461.16591, 315.10891, 135.04591 | CD, CD-NP, CD-HP |
| 11 | 3.24 | Kankanoside F | C26H40O17 | –H | 623.2192 | 624.2273 | 0.5 | 623.21920, 461.16678, 315.10994, 135.04591 | CD, CD-NP, CD-HP |
| 12 | 3.25 | Gluroside | C15H24O8 | + HCOO | 377.1449 | 332.1463 | 0.1 | 377.14491, 461.16609, 315.10891, 135.04591 | CD, CD-NP, CD-HP |
| 13 | 3.31 | Cistantubulose A1 | C27H38O18 | –H | 649.1987 | 650.2068 | 0.7 | 649.19871, 537.18251, 335.09146, 179.03598, | CD, CD-NP, CD-HP |
| 14 | 3.35 | 6-deoxycatalpol | C15H22O9 | –H | 345.1193 | 346.1271 | 0.7 | 345.11929, 299.11424, 179.03598 | CD, CD-NP, CD-HP |
| 15 | 3.40 | Adoxosidic acid | C16H24O10 | –H | 375.1302 | 376.1373 | − 1.1 | 213.07683 | CD, CD-NP, CD-HP |
| 16 | 3.54 | Cistanoside F | C21H28O13 | –H | 487.1451 | 488.1532 | − 0.1 | 487.14512, 325.09503, 251.05822, 179.03637 | CD, CD-NP, CD-HP |
| 17 | 3.65 | Sinapic aldehyde 4-O-β-d-glucopyranoside | C16H20O9 | + HCOO | 401.1087 | 356.1109 | 0.3 | 401.10872, 301.09,397, 283.08371, 193.05148 | CD, CD-NP, CD-HP |
| 18 | 3.77 | Kankanose | C27H38O18 | –H | 649.1985 | 650.2063 | 0.5 | 649.19853, 461.16139, 293.12495, 179.03612 | CD, CD-NP, CD-HP |
| 19 | 3.79 | 3-Methyl-but-2-en-1-yl-β-d-glucopyranoside | C11H20O6 | + HCOO | 293.1249 | 248.1264 | 1.3 | 293.12494, 195.06673, 179.03612 | CD, CD-NP, CD-HP |
| 20 | 3.81 | Demethylsyringing | C16H22O9 | –H | 357.1193 | 358.1266 | 0.7 | 357.11931, 251.05778, 195.06,678, 179.03653 | CD, CD-NP, CD-HP |
| 21 | 3.82 | Cistanoside G | C20H30O11 | –H | 445.1709 | 446.1756 | − 0.1 | 445.17092, 375.13013, 293.12548, 195.06823, 179.03678 | CD, CD-NP, CD-HP |
| 22 | 3.84 | Cistanoside F | C21H28O13 | –H | 487.1458 | 488.1523 | − 0.6 | 487.14577, 445.17102,323.08273, 179.03678, | CD, CD-NP, CD-HP |
| 23 | 3.96 | 3-Methyl-but-2-en-1-yl-β-D-glucopyranoside | C11H20O6 | + HCOO | 293.1251 | 248.1268 | 1.5 | 293.12505, 161.04759 | CD, CD-NP, CD-HP |
| 24 | 3.98 | Gluroside | C15H24O8 | + HCOO | 377.1455 | 332.1476 | 0.7 | 377.14547, 293.12505, 179.03614 | CD, CD-HP |
| 25 | 4.03 | Cistanoside F | C21H28O13 | –H | 487.1457 | 488.1538 | 0.5 | 487.14668, 2,23.06196, 179.03779 | CD, CD-NP, CD-HP |
| 26 | 4.16 | Kankanoside D | C15H26O7 | + HCOO | 363.1663 | 318.1679 | 0.8 | 363.16634, 315.10883, 179.03855, 161.04465 | CD, CD-NP, CD-HP |
| 27 | 4.19 | Cistanoside E | C21H32O12 | –H | 475.1869 | 476.1888 | 5.3 | 475.18694, 363.16559, 179.03,855 | CD, CD-NP, CD-HP |
| 28 | 4.25 | Cistanoside I | C21H28O12 | –H | 471.1505 | 472.1577 | 0.2 | 471.15048, 369.11987, 471.15071, 179.03589, 163.04110 | CD, CD-NP, CD-HP |
| 29 | 4.32 | Cistanoside F | C21H28O13 | –H | 487.1466 | 488.153 | 1.4 | 487.14656, 323.07922, 251.05793, 179.03699 | CD, CD-NP, CD-HP |
| 30 | 4.53 | Cistanoside F | C21H28O13 | –H | 487.1464 | 488.1537 | 1.2 | 487.14637, 323.08028, 251.05805, 179.03769 | CD, CD-NP, CD-HP |
| 31 | 4.55 | Androsin | C15H20O8 | –H | 327.1092 | 328.1158 | 1.2 | 327.10918, 251.05805, 179.03769, 131.07201 | CD, CD-NP, CD-HP |
| 32 | 4.86 | Cistanoside H | C22H32O13 | –H | 503.1761 | 504.1835 | − 0.4 | 503.17610, 461.16590, 375.13036, 315.10972, 135.04603 | CD, CD-NP, CD-HP |
| 33 | 4.88 | Kankanoside E | C16H28O8 | + HCOO | 393.1760 | 348.1784 | − 0.1 | 393.17603, 241.11923, 375.13036, 161.03814 | CD, CD-HP |
| 34 | 4.92 | Cistantubuloside C 1 /C 2 | C35H46O21 | –H | 801.2487 | 802.2556 | 3.4 | 801.24867, 623.20258, 110.03824 | CD, CD-NP, CD-HP |
| 35 | 5.29 | (2E,6Z)-2-β-d-Glucopyranosyloxy-2,6-dimethyl-2,6-octadienoic acid | C16H26O8 | + HCOO | 391.1608 | 346.1628 | 0.4 | 391.16080, 345.15509, 163.03730 | CD, CD-NP, CD-HP |
| 36 | 5.47 | Kankanoside E | C16H28O8 | + HCOO | 393.1766 | 348.1783 | 0.5 | 393.17656, 283.07834, 179.03768 | CD, CD-NP, CD-HP |
| 37 | 5.56 | Campneoside II | C29H36O16 | –H | 639.1926 | 640.2003 | 0.1 | 621.19264, 361.15007, 161.02704 | CD, CD-NP, CD-HP |
| 38 | 5.73 | Echinacoside | C35H46O20 | –H | 785.2549 | 786.2618 | 4.5 | 785.25485, 623.21903, 392.11650, 179.03596 | CD, CD-NP, CD-HP |
| 39 | 5.81 | 8-hydroxygeraniol-1-β-d-glucopyranoside | C16H28O7 | + HCOO | 377.1813 | 332.1835 | 0.1 | 377.18129, 331.14023, 164.07382 | CD, CD-NP, CD-HP |
| 40 | 5.86 | Cistanoside E | C21H32O12 | –H | 475.1813 | 476.1888 | − 0.3 | 347.17188, 251.05915 | CD, CD-NP, CD-HP |
| 41 | 5.93 | Liriodendrin | C34H46O18 | + HCOO | 787.2670 | 742.2689 | 0.9 | 787.26703, 579.20978, 475.18047, 417.15414 | CD, CD-NP |
| 42 | 6.00 | Isolariciresinol-9′-O-β-d-glucopyranoside | C26H34O11 | + HCOO | 567.2076 | 522.2095 | − 0.2 | 567.20755, 359.14970, 329.13966, 178.06231 | CD, CD-NP, CD-HP |
| 43 | 6.06 | Campneoside II | C29H36O16 | –H | 639.1936 | 640.2003 | 1.1 | 639.19362, 487.14472, 251.05630 | CD, CD-NP, CD-HP |
| 44 | 6.26 | Kankanosides K 1 /K 2 | C36H48O21 | –H | 815.2636 | 816.2701 | 2.6 | 815.26358, 783.23518, 637.1979, 381.15558, 179.03631 | CD, CD-NP, CD-HP |
| 45 | 6.34 | Cistantubuloside B 1 | C35H46O19 | –H | 769.2573 | 770.2655 | 1.8 | 769.25732, 623.21303, 420.06489, 163.03926 | CD, CD-NP, CD-HP |
| 46 | 6.36 | 8-hydroxygeraniol-1-β-d-glucopyranoside | C16H28O7 | + HCOO | 377.1820 | 332.1833 | 0.8 | 377.18204, 367.15243, 163.04196 | CD, CD-NP, CD-HP |
| 47 | 6.42 | Kankanoside N | C16H26O8 | –H | 345.1563 | 346.1637 | 1.4 | 345.15630, 197.80891, 113.02490 | CD, CD-NP, CD-HP |
| 48 | 6.50 | Cistanoside A | C36H48O20 | + HCOO | 845.2769 | 800.2781 | 5.4 | 845.27689, 799.27001,681.20502 | CD, CD-NP, CD-HP |
| 49 | 6.47 | Kankanoside I | C35H46O18 | + HCOO | 799.2703 | 754.2718 | 4.2 | 799.27031, 365.08428, 161.02522 | CD, CD-NP, CD-HP |
| 50 | 6.79 | (2E,6E)-2-β-d-glucopyranosyloxy-2,6-dimethyl-2,6-octadienoic acid | C16H26O8 | –H | 345.1565 | 346.1632 | 1.6 | 345.15649, 165.09327 | CD, CD-NP, CD-HP |
| 51 | 6.96 | Kankanoside A | C16H26O8 | –H | 345.1565 | 346.1633 | 1.6 | 345.15647, 195.06666, 179.03628 | CD, CD-NP, CD-HP |
| 52 | 7.03 | Cistanoside C | C30H38O15 | + HCOO | 683.2198 | 638.2208 | 1.1 | 683.21978, 489.14915, 417.15349, 335.20636, 197.80796 | CD, CD-NP, CD-HP |
| 53 | 7.09 | kankanoside E | C16H28O8 | –H | 347.1716 | 348.1781 | 1.0 | 347.17157, 195.81307, 167.10929 | CD, CD-NP, CD-HP |
| 54 | 7.19 | Acteoside | C29H34O15 | –H | 623.1992 | 622.1892 | 1.6 | 623.19917, 461.16657, 315.10988, 161.02530 | CD, CD-NP, CD-HP |
| 55 | 7.25 | Tubuloside A | C37H48O21 | –H | 827.2655 | 828.2721 | 4.5 | 827.26548, 621.18343, 469.13652, 379.19635 | CD, CD-NP, CD-HP |
| 56 | 7.51 | Cistanoside B | C37H50O20 | + HCOO | 859.2913 | 814.2931 | 4.1 | 859.2913, 679.18910, 565.19246 | CD, CD-NP, CD-HP |
| 57 | 7.58 | Cistanoside J | C33H42O16 | + HCOO | 739.2409 | 694.2482 | 4.0 | 739.24093, 345.15468, 161.02597 | CD, CD-NP, CD-HP |
| 58 | 7.60 | Tubuloside A | C37H48O21 | –H | 827.2649 | 828.2727 | 3.9 | 827.26486, 739.24745, 579.22756, 345.15468, 161.02597 | CD-NP, CD-HP |
| 59 | 7.7 | Kankanoside E | C16H28O8 | –H | 347.1719 | 348.1791 | 1.3 | 347.17191, 303.18323, 211.13616, 185.11917, | CD, CD-NP, CD-HP |
| 60 | 7.86 | Acteoside | C29H36O15 | –H | 623.1995 | 624.2067 | 1.9 | 623.19954, 461.16624, 161.02546 | CD, CD-NP, CD-HP |
| 61 | 7.94 | Crenatoside | C29H34O15 | –H | 621.1833 | 622.1907 | 1.4 | 621.18331, 387.14418, 179.03640 | CD, CD-NP, CD-HP |
| 62 | 8.06 | Kankanosides K1/K2 | C36H48O21 | –H | 815.2631 | 816.2688 | 2.1 | 499.1811, 197.8080, 160.8423 | CD-HP |
| 63 | 8.33 | Kankanoside H1 | C37H48O20 | –H | 812.2731 | 812.2739 | − 0.8 | 607.20431, 445.17033, 161.02556 | CD, CD-HP |
| 64 | 8.36 | Isosyringalide-3´-α-L-rhamnopyranoside | C29H36O14 | –H | 607.2034 | 608.2119 | 0.7 | 607.20341, 461.16447, 315.10906, 145.03063 | CD, CD-NP, CD-HP |
| 65 | 8.53 | Campneoside I | C30H38O16 | –H | 653.2084 | 654.216 | 1.6 | 607.20440, 461.16367, 443.15204, 145.03081 | CD, CD-NP, CD-HP |
| 66 | 8.78 | Cis-isocistanoside C | C30H38O15 | –H | 637.2147 | 638.2222 | 1.5 | 637.21474, 475.18074, 329.12012, 161.02576 | CD, CD-NP, CD-HP |
| 67 | 8.84 | Citrusin A | C27H36O11 | + HCOO | 581.2235 | 536.2280 | 0.1 | 581.22351, 433.15241,371.13360,343.1457 | CD, CD-NP, CD-HP |
| 68 | 9.17 | Isosyringalise-3´-ɑ-L-rhamnopyranoside | C29H36O14 | –H | 607.2033 | 608.2122 | 0.6 | 607.20334, 461.15822, 161.02611 | CD, CD-NP, CD-HP |
| 69 | 9.50 | Isocampneoside I | C30H38O16 | –H | 653.2094 | 654.2161 | 1.2 | 607.2094, 461.16616, 307.08417, 145.03058 | CD, CD-NP, CD-HP |
| 70 | 9.50 | Syringalide A-3´-α-L-rhamnopyranoside | C29H36O14 | –H | 607.2037 | 608.2127 | 1.0 | 607.20372, 461.16616, 307.08417, 145.03089 | CD, CD-NP, CD-HP |
| 71 | 9.57 | isocistanoside C | C30H38O15 | –H | 637.2150 | 638.2221 | 1.8 | 637.21503, 445.15153, 323.07862, 251.05653 | CD, CD-NP, CD-HP |
| 72 | 9.62 | Cis-Tubuloside B | C31H38O16 | –H | 665.2103 | 666.2169 | 2.1 | 665.21032, 503.17680, 305.06585, 161.02529 | CD, CD-NP, CD-HP |
| 73 | 9.76 | Crenatoside | C29H34O15 | –H | 621.1826 | 622.1891 | 0.7 | 621.18264, 487.14611, 323.07878, 179.03579 | CD, CD-NP, CD-HP |
| 74 | 9.92 | cistanoside C | C30H38O15 | –H | 637.2139 | 638.2209 | 0.7 | 637.21389, 591.20868, 445.16991, 163.04078, 145.03032 | CD, CD-NP, CD-HP |
| 75 | 9.92 | Osmanthuside B | C29H36O13 | –H | 591.2080 | 592.2158 | 0.2 | 591.20804, 445.16991, 160.84291, 145.03032 | CD, CD-NP, CD-HP |
| 76 | 10.28 | Eutigoside A | C23H26O9 | –H | 445.1501 | 446.1571 | 0.2 | 445.15008, 163.03943, 145.03004 | CD, CD-NP, CD-HP |
| 77 | 10.35 | Cistanoside M | C30H38O14 | + HCOO | 667.2245 | 622.2248 | 0.7 | 667.22446, 621.21761, 555.20753, 161.02534 | CD, CD-NP, CD-HP |
| 78 | 10.78 | Isomartynoside | C31H40O15 | + HCOO | 697.2356 | 652.2372 | 1.2 | 697.23563, 651.22859, 475.17960, 175.04062 | CD, CD-NP, CD-HP |
| 79 | 10.92 | Salsaside B | C28H34O13 | –H | 577.1929 | 578.1999 | 0.8 | 503.17758, 323.07755, 161.02527 | CD, CD-NP, CD-HP |
| 80 | 10.93 | 2´-acetylacteoside | C31H38O16 | –H | 665.2108 | 666.2173 | 2.6 | 665.21076, 503.17758, 305.06712, 161.02527 | CD, CD-NP, CD-HP |
| 81 | 11.08 | Osmanthuside B | C29H36O13 | –H | 591.2084 | 591.2093 | 0.6 | 445.1579, 163.0400, 145.0301 | CD, CD-NP, CD-HP |
| 82 | 11.08 | Plantainoside C | C30H38O15 | –H | 637.2141 | 638.2238 | 0.9 | 591.20986, 445.15921, 145.03022 | CD, CD-NP, CD-HP |
| 83 | 11.33 | Kankanosides J1/J2 | C32H40O17 | –H | 695.2190 | 696.2267 | 0.3 | 695.21902, 649.21477, 503.17505, 145.03017 | CD, CD-NP, CD-HP |
| 84 | 11.33 | SalsasideF | C31H38O15 | –H | 649.2140 | 650.2199 | 0.8 | 649.21399, 503.17505, 347.16994, 145.03017 | CD, CD-NP, CD-HP |
| 85 | 11.89 | Cistansinenside A | C32H40O16 | –H | 679.2246 | 680.2324 | 0.8 | 679.22464, 623.19749, 161.02503 | CD, CD-NP, CD-HP |
| 86 | 12.02 | isomartynoside | C31H40O15 | + HCOO | 697.2360 | 652.2364 | 1.6 | 697.23604, 651.22862, 505.16921, 175.04095 | CD, CD-NP, CD-HP |
| 87 | 12.63 | Salsaside A | C28H34O13 | –H | 577.1932 | 578.1982 | 1.1 | 577.19316, 501.16521, 469.13425, 179.03540, 161.02496 | CD, CD-NP, CD-HP |
| 88 | 12.84 | Salsaside Ca/Cb | C28H34O12 | –H | 561.1978 | 562.2044 | 0.6 | 561.19776, 415.16021, 163.04118, 145.03011 | CD, CD-NP, CD-HP |
| 89 | 12.90 | SalsasideF | C31H38O15 | –H | 649.2144 | 650.2212 | 1.2 | 649.21443, 503.17434, 461.16538 | CD, CD-NP, CD-HP |
| 90 | 12.90 | Kankanosides J1/J2 | C32H40O17 | –H | 695.2195 | 696.2274 | 0.8 | 695.21948, 649.21421, 607.20459, 503.17401, 149.02394 | CD, CD-NP, CD-HP |
| 91 | 13.10 | Osmanthuside B | C29H36O13 | –H | 591.2085 | 592.2162 | 0.7 | 591.20845, 429.17830, 161.02556 | CD, CD-NP, CD-HP |
| 92 | 13.11 | Jionoside D | C30H38O15 | –H | 637.2131 | 638.2210 | − 0.1 | 591.20842, 161.02556 | CD, CD-NP, CD-HP |
| 93 | 13.17 | Salsaside D | C31H38O15 | –H | 649.2140 | 650.2199 | 0.8 | 649.21401, 607.19810, 329.16152 | CD, CD-NP, CD-HP |
| 94 | 13.53 | cistansinenside A | C32H40O16 | –H | 679.2251 | 680.2314 | 1.3 | 679.22512, 637.21464, 461.16791, 161.02601 | CD, CD-NP, CD-HP |
| 95 | 14.36 | Osmanthuside B6(Z) | C29H36O13 | –H | 591.2085 | 592.2152 | 0.7 | 591.20854, 489.26955, 445.15395, 161.02652 | CD, CD-NP, CD-HP |
| 96 | 15.30 | sinenside A | C32H40O16 | –H | 679.2255 | 680.2328 | 1.7 | 679.22547, 633.22252, 591.20916, 145.03024 | CD, CD-NP |
| 97 | 16.43 | Cistanoside M | C30H38O14 | –H | 621.2184 | 622.2258 | 0.1 | 591.20868, 489.27111, 161.02535 | CD, CD-NP |
Variations in chemical components of processed products
The Simca-P 13.0 software was employed for analyzing the multivariate data matrix. Before PCA, all variables were mean-centered and pareto-scaled, followed by identification of potential discriminant variables. In a PCA score plot, every point showed an individual sample. Samples that showed similarity in their chemical components were scattered adjacent to each other, while those which showed variations in their components were divided. As seen in PCA (Fig. 4), the group of CD-HP was separated from the groups of CD and CD-NP.
Fig. 4.
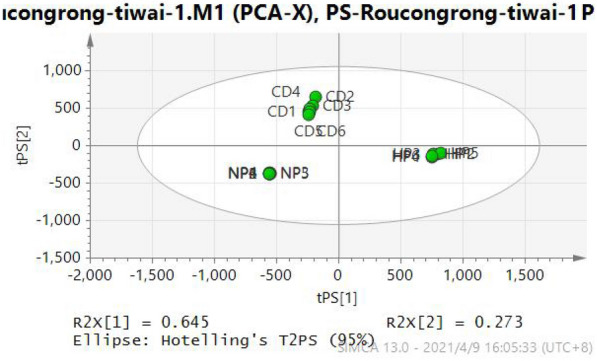
The PCA of CD and its different processed products
To distinguish CD from CD-HP and CD-NP, OPLS-DA, permutation test, S-plot, and VIP value were developed. (Figs. 5, 6, 7) The obtained results revealed that many components were key characteristic components of each product. The screening condition was the VIP > 1 and P < 0.05. From the date of the S-plot, the characteristic components were evaluated, which were commonly existing in the three groups.
Fig. 5.

The OPLS-DA/permutation test/S-plot/heat map indicating the intensities of potential biomarkers between CD-NP and CD-HP Compounds 9, 10, 14, 32, 59, 60, 68, 70, 74, 75, 80, 81, 82, and 84 are the differential components of CD-NP, while compounds 11, 15, 16, 45, 48, 66, and 72 are the differential components of CD-HP.
Fig. 6.

The OPLS-DA /permutation test/ S-plot/heatmaps indicating the intensities of effective biomarkers between CD and CD-NP Compounds 13, 15, 16, 37, 49, 63, 66, 72, 74, 75, and 85 are the differential components of CD, while compounds 10, 11, 32, 59, 60, 68, 70, 71, 80, 81, and 82 are the differential components of CD-NP.
Fig. 7.

The OPLS-DA/permutation test/S-plot/heatmaps revealing the intensities of effective biomarkers between CD and CD-HP Compounds 9, 14, 16, 59, 63, 66, 72, 74, 75, 80, 82, 84, 85, and 94 are the differential components of CD, and 11, 15, 45, 49, 50, 60, and 71 are the differential components of CD-HP.
From Fig. 8, we found the intensity of acteoside (54), cistanoside C (74), campneoside II (43), osmanthuside (75), and 2'-actylacteoside (80) having the 4'-O-caffeoyl group in the 8-O-β-d-glucopyranosyl part (see Fig. 9) decreased after being processed by rice-wine, while the intensity of isoacetoside (60), isocistanoside (71), isocampneoside I (69), isomartynoside (86) having the 6'-O-caffeoyl group (see Fig. 9) increased, especially for the CD-NP group. Though tubuloside B (72) having 6'-O-caffeoyl group, the same as isoacteoside, the intensity decreased because of its 2'-actyl group. The intensity of echinacoside (38) and cistanoside B having 6'-O-β-d-glucopyranosyl moiety groups increased, but the intensity of tubuloside A (55) decreased also because of its 2'-actyl group.
Fig. 8.

The Intensity of mainly PhGs in CD and its processed products
Fig. 9.

Chemical Structures of mainly PhGs in CD and its processed products.
Our research team also studied the thermal stability of acteoside and isoacteoside, and found that acteoside was unstable in water, methanol and yellow rice wine solution, and could be converted into isoacteoside partly under heating condition. But the thermostability of isoacteoside was better, especially in yellow rice wine solution. Figure 10 showed the possible changes of PhGs in CD during processing:
Fig. 10.

The possible reaction for PhGs during the processing
Identification of the metabolites in rats
From high-resolution mass spectrometry data, the accurate molecular weight and elemental composition for metabolites and protomolecule compounds were analyzed and compared. As the same kinds of compounds in TCM showed similarity in metabolic modifications, the correlations of phytochemical constituents in vitro can extend to their metabolites in vivo. Meanwhile, based on conventional biotransformation pathways, a reasonable change of molecular weight was inferred. Finally, the metabolites were identified by analyzing the MSE mass spectra of the metabolites and proto-compounds fragmentation pathway in the mass spectrum [21, 22]. Compared with the blank sample, its components were identified in vivo based on the information provided by chromatogram-mass spectrum, the possibility of a metabolic reaction, the characteristics of the compound structure, and the fragmentation rule of its mass spectrum. See Table 3.
Table 3.
Identified Metabolites in plasma, urine and feces of aqueous extract in CD and its processed products
| No. | rtmed | Measured mass | Error (mDa) | Formula | Distribution | Identification | Status |
|---|---|---|---|---|---|---|---|
| 1 | 0.77 | 179.0389 | 4.4 | C9H8O4 |
U(CD, CD-NP, CD-HP) F(CD-NP, CD-HP) |
Caffeic acid | Metabolites |
| 2 | 0.81 | 149.0653 | 5.0 | C9H9O2 | U(CD, CD-NP, CD-HP) | 3-phenylpropionic acid | Metabolites |
| 3 | 0.93 | 195.0623 | -3.5 | C10H12O4 |
U(CD) S(CD-NP) F(CD-HP) |
Methylated 3,4-dihydroxybenzenepropionic acid | Metabolites |
| 4 | 1.02 | 193.0524 | 2.3 | C10H10O4 | U(CD, CD-NP, CD-HP) | Methylated caffeic acid | Metabolites |
| 5 | 1.18 | 167.0762 | 5.4 | C9H12O3 | U(CD-NP) | Methylated HT | Metabolites |
| 6 | 3.31 | 185.117 | − 0.8 | C10H18O3 |
U(CD, CD-HP) F(CD-HP) |
Ajugol deglycosylation product | Metabolites |
| 7 | 3.52 | 167.0536 | − 0.9 | C8H8O4 | U(CD-NP) | HT oxidation | Metabolites |
| 8 | 4.48 | 361.1491 | − 0.8 | C16H26O9 |
U(CD, CD-NP, CD-HP) F(CD-HP) |
Hydroxylated kankanoside A or isomer | Metabolites |
| 9 | 4.70 | 541.1144 | − 8.3 | C20H30O15S |
S(CD-NP, CD-HP) F(CD-HP) |
Decaffeoylacteoside sulfate conjugation | Metabolites |
| 10 | 4.73 | 153.0504 | − 4.8 | C8H10O3 |
U(CD, CD-NP, CD-HP) F(CD-NP, CD-HP) |
HT | Metabolites |
| 11 | 4.85 | 123.0821 | 1.1 | C8H12O |
U(CD, CD-NP, CD-HP) F(CD, CD-HP) |
Geniposide hydrolysated product | Metabolites |
| 12 | 5.14 | 246.9911 | − 1.4 | C8H8O7S |
U(CD, CD-NP, CD-HP) F(CD-NP) |
3,4-dihydroxyphenylacetic acid sulfate conjugation | Metabolites |
| 13 | 5.23 | 361.1471 | − 2.8 | C16H26O9 |
U(CD, CD-NP, CD-HP) F(CD-NP, CD-HP) |
Hydroxylated kankanoside A or isomer | Metabolites |
| 14 | 5.35 | 313.0962 | 3.9 | C14H18O8 |
U(CD, CD-NP, CD-HP) F(CD-NP, CD-HP) |
Tyrosol glucuronide conjugation | Metabolites |
| 15 | 5.63 | 217.0138 | − 3.3 | C8H10O5S |
U(CD, CD-NP, CD-HP) F(CD-NP, CD-HP) |
Tyrosol sufate conjugation | Metabolites |
| 16 | 5.73 | 329.0851 | − 2.2 | C14H18O9 | U(CD, CD-NP, CD-HP) | HT-glucuronide conjugation | Metabolites |
| 17 | 5.98 | 233.0170 | − 5.0 | C8H10O6S |
U(CD, CD-NP, CD-HP) F(CD, CD-NP, CD-HP) |
HT sulfate conjugation | Metabolites |
| 18 | 6.54 | 185.1114 | − 6.4 | C10H18O3 |
U(CD, CD-NP, CD-HP) F(CD-HP) |
Deglycosylated kankanoside N | Metabolites |
| 19 | 6.76 | 261.0084 | 1.5 | C9H10O7S |
U(CD, CD-NP, CD-HP) F(CD-NP) |
3,4-dihydroxybenzenepropionic acid sulfate conjugation | Metabolites |
| 20 | 7.01 | 183.1085 | 6.4 | C10H16O3 | U(CD, CD-NP, CD-HP) | Deglycosylated kankanoside A or isomer | Metabolites |
| 21 | 7.16 | 461.1605 | − 5.4 | C20H30O12 | F(CD-NP) | Decaffeoylacteoside | Proto |
| 22 | 7.19 | 247.0278 | 0.1 | C9H12O6S | U(CD, CD-NP, CD-HP) | Methylated HT sulfate conjugation | Metabolites |
| 23 | 7.28 | 345.1476 | − 7.3 | C16H25O8 |
U(CD, CD-NP, CD-HP) S(CD, CD-NP) |
Kankanoside A or isomer | Proto |
| 24 | 7.57 | 215.0024 | 0.2 | C8H8O5S | U(CD-HP) | HT sulfate conjugation dehydration product | Metabolites |
| 25 | 7.69 | 355.0704 | 3.9 | C15H16O10 |
U(CD-HP) S(CD) |
CA glucuronide conjugation | Metabolites |
| 26 | 7.78 | 343.1037 | 0.8 | C15H20O9 | U(CD, CD-NP, CD-HP) | Methylated HT glucuronide conjugation | Metabolites |
| 27 | 7.81 | 258.994 | 1.5 | C9H8O7S | U(CD, CD-NP, CD-HP) | CA sulfate conjugation | Metabolites |
| 28 | 8.19 | 375.1284 | − 0.7 | C16H24O10 | U(CD, CD-NP, CD-HP) | 8-epilogani acid | Proto |
| 29 | 8.52 | 245.0125 | 0.5 | C9H10O6S |
U(CD, CD-NP, CD-HP) F(CD-HP) |
3-HPP sulfate conjugation | Metabolites |
| 30 | 8.53 | 193.0531 | 0.8 | C10H10O4 | U(CD, CD-NP, CD-HP) | Geniposidic acid deglycosylation dehydration product | Metabolites |
| 31 | 8.90 | 341.0942 | 6.9 | C15H17O9 | U(CD, CD-NP, CD-HP) | 3-HPP glucuronide conjugation | Metabolites |
| 32 | 9.02 | 242.9951 | − 2.1 | C9H7O6S | U(CD, CD-NP, CD-HP) | Dehydroxylated CA sulfate conjugation | Metabolites |
| 33 | 9.06 | 181.0491 | − 1.0 | C9H10O4 |
U(CD, CD-NP, CD-HP) F(CD, CD-NP, CD-HP) |
3,4-dihydroxybenzenepropionic acid | Metabolites |
| 34 | 9.08 | 151.0352 | − 4.3 | C8H8O3 | U(CD, CD-NP, CD-HP) | Catalpol deglycosylated dehydration product | Metabolites |
| 35 | 9.58 | 273.0064 | − 0.5 | C10H9O7S | U(CD, CD-NP, CD-HP) | Methylated CA sulfate conjugation | Metabolites |
| 36 | 10.02 | 275.0209 | − 1.6 | C10H12O7S | U(CD-NP, CD-HP) | Methoxylated 3-HPP sulfate conjugation | Metabolites |
| 37 | 10.13 | 583.1320 | − 1.3 | C22H32O16S | U(CD, CD-NP, CD-HP) | Cistanoside H sulfate conjugation | Metabolites |
| 38 | 10.28 | 299.1108 | − 2.3 | C14H19O7 | U(CD-HP) | Salidroside | Proto |
| 39 | 10.4 | 163.04 | 0.5 | C9H8O3 |
U(CD, CD-NP, CD-HP) S(CD, CD-HP) F(CD, CD-NP, CD-HP) |
Dehydroxylated CA | Metabolites |
| 40 | 10.91 | 199.0641 | 3.5 | C9H10O5 | U(CD-NP) | Catalpol hydrolysated product | Metabolites |
| 41 | 11.17 | 521.1816 | − 5.4 | C22H33O14 | U(CD-HP) | 6-deoxycatalpol glucuronide conjugation | Metabolites |
| 42 | 11.29 | 165.0558 | 0.6 | C9H10O3 |
U(CD, CD-NP, CD-HP) F(CD, CD-NP, CD-HP) |
3-HPP | Metabolites |
| 43 | 11.31 | 332.1479 | 0.8 | C15H24O8 | U(CD, CD-NP, CD-HP) | Gluroside | Proto |
| 44 | 11.31 | 211.0665 | 5.8 | C10H12O5 |
U(CD, CD-NP, CD-HP) F(CD, CD-NP, CD-HP) |
Deglycosylated geniposidic acid | Metabolites |
| 45 | 12.15 | 169.0487 | − 1.4 | C8H8O4 | U(CD, CD-NP, CD-HP) | Catalpol deglycosylated product | Metabolites |
| 46 | 12.15 | 785.2552 | 4.8 | C35H45O20 | F(CD, CD-NP, CD-HP) | Echinacoside | Proto |
| 47 | 13.66 | 345.1571 | 2.2 | C16H25O8 |
U(CD, CD-NP, CD-HP) S(CD-NP) |
6-deoxycatapol | Proto |
| 48 | 13.95 | 489.1514 | − 9.4 | C21H29O13 | U(CD-HP) | Cistanoside F reduction | Metabolites |
| 49 | 14.40 | 487.1480 | 2.8 | C21H27O13 | F(CD, CD-NP) | Cistanoside F | Proto |
| 50 | 14.53 | 347.1747 | − 4.1 | C16H27O8 | U(CD, CD-HP) | Kankanoside N | Proto |
| 51 | 14.55 | 477.1193 | − 0.4 | C23H26O11 | U(CD-HP) | Calceolarisolide A | Proto |
| 52 | 14.84 | 315.1174 | 9.4 | C14H20O8 | F(CD-NP) | 3,4-dihydroxyphenethyl glycoside | Metabolites |
| 53 | 15.03 | 197.0833 | 1.9 | C10H13O4 | U(CD, CD-NP, CD-HP) | Deglycosylation products of 8-epideoxyloganic acid | Metabolites |
| 54 | 16.43 | 230.9984 | 1.0 | C8H8O6S |
U(CD, CD-HP) F(CD-NP) |
4-phenylacetic acid sulfate conjugate | Metabolites |
Identification of phenylethanol glycosides related metabolites
UNIFI platform was used for processing. Figure 11 showed the TIC chromatograph of urine, feces and plasma for CD and its processed products. Compared with blank samples, a total of 54 metabolites were identified in rats, including 10 prototype components and 44 metabolites, in which 24, 49, and 6 were in feces, urine, and plasma, accordingly.
Fig. 11.

Chromatograph of TIC. A Urine sample in BC group; B Urine sample in CD group; C Urine sample in CD-NP group; D Urine sample in CD-HP group; E Feces sample in BC group; F Feces sample in CD group; G Feces sample in CD-NP group; H Feces sample in CD-HP group; I Plasma sample in BC group; J Plasma sample in CD group; K Plasma sample in CD-NP group; M Plasma sample in CD-HP group
Based on accurate mass, fragmentation cascade, and predictable neutral losses by biotransformation, a total of 35 phenylethanoid glycosides-associated metabolites were tentatively evaluated. The related metabolites of phenylethanoid glycosides have similar mass spectrum fragmentation patterns, like the typical decaffeoyl fragment m/z 461.1605, then further hydrolyzed by glycosidic and ester bonds in vivo, and metabolized into hydroxytyrosol (HT) (m/z 153.0504, C8H10O3, 4.73 min) and caffeic acid (CA)(m/z 179.0389, C9H7O4, 0.77 min), see Fig. 12A.
Fig. 12.

Mass spectrum of some metabolites in CDs
M11 indicated [M–H]− at m/z 153.0504 with formula i.e., C8H10O3, and identified as HT. M16 presented [M–H]− at m/z 329.0851, which was 176 Da elevated than that of HT, revealing that it might be a glucuronidated metabolite of HT. The [M–H]− of M26 was at m/z 343.1037, 14 Da higher than that of HT-glucuronide. Therefore, M26 was identified as HT-methylated glucuronide. M17 was identified as HT-sulfate based on its [M–H]− at m/z 233.0112, 80 Da over the HT, which could be further methylated, then produced M22, which showed the m/z 247.0278, indicating that it was HT-methylated sulfated metabolite. M7 (m/z 167.0335) and M5 (m/z 167.0762) were considered as oxidation products and methylated HT, respectively (Fig. 12B).
M1 indicated [M–H]− at m/z 179.0389, elucidated molecular formula was C9H7O4 and identified as caffeic acid (CA). M25 revealed [M–H]− at m/z 355.0704, which were 176 Da elevated than that of CA, shows that it might be a glucuronidated metabolite of CA. M27 had m/z 258.994, which was 80 Da higher than that of CA, so we elucidated it as CA sulfate, and it could produce M35 (m/z 273.0064). As M4 gives the [M–H]− at m/z 193.0524, 14 Da higher than CA, it was identified as CA methylated metabolite. M39 was CA dehydroxylation metabolite, with m/z 163.04, and it could be sulfated into M32 (m/z 242.9951).
M33 (m/z 181.0491, C9H10O4, 9.06 min) was the reduction product of CA, that is 3,4-dihydroxybenzenepropionic acid, which could be methylated into M19 (m/z 195.0623, C10H12O4, 0.93 min). M33 could be dehydroxyed into M43, that is 3-HPP (m/z 165.0558, C9H10O3, 11.29 min), and M31 (m/z 341.0942, C15H17O9, 8.90 min) and M29 (m/z 245.0125, C9H10O6S, 8.52 min) were the glucuronidated and sulfated products (Fig. 12C).
For the phenylethanoid glycosides-associated metabolites, the key metabolic cascades were phase II metabolic reactions, i.e., glucuronidation, methylation, and sulfation. The proposed metabolic cascades of phenylethanoids are depicted in Fig. 13.
Fig. 13.

Possible Metabolic pathway of phenylethanoids
Identification of iridoids related metabolites
By analyzing the elemental composition of the metabolites, MSE fragmentation, and associated literature, a total of 19 iridoid-associated metabolites were tentatively evaluated. Iridoid glycosides were hydrolyzed by glycosidic bonds to form their corresponding aglycones. The m/z 185.117 was for M8, 162 Da less than ajugol, which was yielded by the loss of glucose residue.
M40 (m/z 199.0641, Rt 10.91 min) was the deglycosylated product of catalpol. M45 m/z 169.0487, Rt 12.15 min) was less than 30 Da that of catalpol deglycosylated metabolite, and was identified as removal of a molecule of CH2O metabolite. M34 (m/z 151.0352, Rt 9.08 min), was further loss of H2O metabolite.
M44 (m/z 211.0665, Rt 11.31 min) was a deglycosylated metabolite of geniposide, and M37 (m/z 197.0833, Rt 15.03 min) was deglycosylation of 8-epideoxyloganic acid. Metabolic reactions for iridoids could be revealed as phase I metabolism of deglycosylation (Fig. 12D).
Comparison of metabolic profiling in plasma, urine, and feces between CD and its processed products
2 prototypes in plasma, 7 in urine, and 3 in feces were compared. There were 7 prototypes absorbed in CD, 7 prototypes absorbed in CD-NP, and 8 prototypes in CD-HP. M21 was only detected in the feces group of CD-NP, and M38 and M51 were detected just in urine groups of CD-HP. Compared with metabolites, identical metabolites in plasma, urine, and feces were 4, 42, and 21, respectively. There were 34 metabolites absorbed in the CD group, 39 in CD-NP, and 40 in the CD-HP group. M5, M7, M40, and M52 were only detected in CD-NP groups, while M24, M41, and M48 were just detected in CD-HP groups.
Variations were observed in the absorption as well as the metabolism of active compounds in diverse processed products of CD. From Fig. 14, we found that the intensity of HT-sulfate conjugation (M17) was the highest in the urine, followed by 3-HPP sulfate conjugation (M29), methylated HT sulfate conjugation (M22), dehydroxylated CA sulfate conjugation (M32), and 3,4-dihydroxy benzenepropionic acid sulfate conjugation (M19). The content of metabolic products in the processed group was higher than in the CD group, especially for M22, M29, M27, M16, M19, M1, M2. Their precursor compounds, such as hydroxytyrosol have anti-tumor, anti-inflammatory, antibacterial, an tiviral, and antifungal properties [23]. Caffeic acid possesses anti-inflammatory, anti-cancer, and antiviral activities [24]. It was consistent with the clinical use of CD and its processed products.
Fig. 14.

Intensity of main metabolites in urine
Discussion
CD is a TCM, and its major bioactive components, including PhGs, iridoids, polysaccharide have been documented by various research studies. In TCM clinical practice, the processed products of CD have been widely used relative to raw ones. The chemical composition will be changed during the processing, which may lead to changes in the medicinal effects (Fig. 14).
PhGs are a type of phenolic compound characterized by a β-glucopyranoside structure bearing a hydroxyphenylethyl moiety as the aglycone. These compounds often comprise caffeic acid and rhamnose attached to the glucose residue through ester or glycosidic linkages respectively. In the current study, the qualitative analyses of CD, CD-NP, and CD-HP were carried out, and a total of 97 compounds, including phenylethanoid glycosides (PhGs), iridoids, etc. were identified. The obtained results showed the variations in chemical composition before and after processing. The intensity of PhGs having the 4'-O-caffeoyl group in the 8-O-β-d-glucopyranosyl part, like acteoside, cistanoside C, campneoside II, osmanthuside decreased after being processed, while PhGs with 6'-O-caffeoyl group in the 8-O-β-d-glucopyranosyl part, such as isoacetoside, isocistanoside, isocampneoside I, isomartynoside increased, especially in the CD-NP group. The intensity of echinacoside and cistanoside B whose structure possess 6'-O-β-d-glucopyranosyl moiety also increased. PhGs having 2'-actyl group often decreased because of hydrosis reaction during the process, like tubuloside B, 2-acetylacteoside.
Investigation of metabolites absorbed in vivo was carried out after oral administration of CD and its processed products. The metabolic processes of phase II were the key cascades and most of the metabolites were sulfate, glucuronide, and methylated conjugates. Phenylethanol glycosides have low oral absorption and utilization. They are difficult to be absorbed into the blood, and act as progenitors to play their roles after metabolic activation in vivo. Phenylethanoids produced into phenylethanolaglycone, like hydroxytyrosine (HT) and caffeic acid (CA) and its derivative 3-hydroxyphenylpropionic acid (3-HPP), these metabolites may be more easily absorbed into the plasma and have a better medicinal effect.
Most of the metabolites were found in their lower concentrations or not detected in rat plasma, however, higher concentration was observed in the urine, indicating that metabolites would get easily eliminated via urine. As depicted in Table 3, the same compounds were determined in various groups, while considerable variations were found in the concentrations of the metabolites which might be associated with the unequal efficacy of CD and its processed products. HT-sulfate conjugation (M17) have the highest intensity in the urine, followed by 3-HPP sulfate conjugation (M29), methylated HT sulfate conjugation (M22), dehydroxylated CA sulfate conjugation (M32), and 3,4-dihydroxy benzenepropionic acid sulfate conjugation (M19). The content of metabolic products in the processed group was higher than in the CD group, especially for M22, M29, M27, M16, M19, M1, M2.
Generally, the components having high exposure in target organs could be effective. A sufficient amount of phenylethanoids and their derivatives have been evaluated and determined in vitro. Acteoside is the characteristic compounds, whose content decreased after being processed by rice-wine, and the content of isoacteoside, isocistanoside C, isocampneoside I increased correspondingly. The degradation products of PhGs, like CA and HT derivatives could be evaluated in the bio-samples, and rice-wine processing can enhance the absorption of metabolites in vivo.
Conclusion
In this study, 97 compounds were detected in the extracts of CD and its processed product. The degradation of few glycosides occurred under an elevated temperature and as a result, some new isomers and complexes were synthesized. In in vivo study, prototype components (10) and metabolites (44) were determined or tentatively evaluated in rat plasma, feces, and urine. Phase II metabolic processes were the key cascades, most of the metabolites were associated with echinacoside or acteoside, like HT, CA and their derivatives 3-hydroxyphenylpropionic acid 3-HPP. These metabolites may be more easily absorbed into the plasma and have a better medicinal effect. The obtained results showed that the chemical composition of CD was different and affected the disposition of the compound in vitro and in vivo.
Acknowledgements
Not applicable.
Abbreviations
- PhGs
Phenylethanoid glycosides
- CD
Cistanche deserticola
- CMM
Chinese Materia Medica
- TCM
Traditional Chinese Medicine
- CD-NP
Cistanche deserticola Processed by steaming with rice-wine under normal pressure
- CD-HP
Cistanche deserticola Processed by steaming with rice-wine under high pressure
- UPLC-Q-TOF-MSE
Ultra-high performance liquid chromatography coupled with TOF-MSE
- PCA
Principal component analysis
- VIP
Variable importance for the projection
- CA
Caffeic acid
- HA
Hydroxytyrosol
Authors' contributions
LZ, LBN, SJ participated in drafting, writing the manuscript. RJ, LPP assisted with the animal experiments and drafted and finalized all figures and tables. ZC, HY, JTZ assisted with the design and performance of this study and reviewed the manuscript. All authors read and approved the final manuscript.
Funding
This work was supported by the National Natural Science Foundation of China (Grant No: 81874345) and Natural Science Foundation of Liaoning Province (Grant No: 2020-MS-223).
Availability of data and materials
The datasets used and/or analyzed during the current study are available from the corresponding author on reasonable request.
Declarations
Ethics approval and consent to participate
Ethical approval for using experimental animals for this study had been obtained from the Medical Ethics Committee of Liaoning University of Traditional Chinese Medicine (Approval number: 2018YS(DW)-044-01). All experimental procedures in this study were under ethical standards of the medical Ethics Committee of Liaoning University of Traditional Chinese Medicine.
Consent for publication
Not applicable.
Competing interests
The authors declare that they have no conflicts of interest to disclose.
Footnotes
Publisher's Note
Springer Nature remains neutral with regard to jurisdictional claims in published maps and institutional affiliations.
References
- 1.Chinese Pharmacopoeia Commission . Pharmacopeia of The People’s Republic of China. Beijing: China Medical Science Press; 2020. p. 140. [Google Scholar]
- 2.Li Z, Lin H, Gu L, Gao J, Tzeng CM. Herba Cistanche (Rou Cong-Rong): one of the best pharmaceutical gifts of traditional chinese medicine. Front Pharmacol. 2016;7:41. doi: 10.3389/fphar.2016.00041. [DOI] [PMC free article] [PubMed] [Google Scholar]
- 3.Liu BN, Shi J, Zhang C, Li Z, Hua Y, Liu PP, Jia TZ. Effects of different drying processing methods for Fresh Cistanche deserticola on its component contents. J Chin Med Mater. 2020;10:2414–2418. [Google Scholar]
- 4.Liu BN, Shi J, Jia TZ, Lv TT, Li Z. Optimization of high-pressure steaming process for Cistanches Herba. Chin Trad Patent Med. 2019;11:2576–2580. [Google Scholar]
- 5.Fan YN, Huang YQ, Jia TZ, Wang J, La-Sika, Shi J. Effects of Cistanches herba before and after processing on anti-aging function and immune function of D-galactose-induced aging rats. Chin Arch Trad Chin Med, 2017; 11:2882–2885.
- 6.Gao YJ, Jiang Y, Dai F, Han ZL, Liu HY, Bao Z, Zhang TM, Tu PF. Study on laxative constituents in Cistanche deserticola YCMa. Modern Chin Med. 2015;17(4):307–310. [Google Scholar]
- 7.Liu BN, Shi J, Li Z, Zhang C, Liu P, Yao W, Jia T. Study on neuroendocrine-immune function of Cistanche deserticola and Its rice wine steaming products in glucocorticoid-induced rat model. Evid Based Complement Alternat Med. 2020;22:5321976. doi: 10.1155/2020/5321976. [DOI] [PMC free article] [PubMed] [Google Scholar]
- 8.Guo Y, Wang L, Li Q, Zhao C, He P, Ma X. Enhancement of kidney invigorating function in mouse model by Cistanches herba dried rapidly at a medium high temperature. J Med Food. 2019;22(12):1246–1253. doi: 10.1089/jmf.2018.4354. [DOI] [PubMed] [Google Scholar]
- 9.Wang T, Zhang X, Xie W. Cistanche deserticola Y. C. Ma, "Desert ginseng": a review. Am J Chin Med. 2012;40(6):1123–1141. doi: 10.1142/S0192415X12500838. [DOI] [PubMed] [Google Scholar]
- 10.Fu Z, Fan X, Wang X, Gao X. Cistanches Herba: An overview of its chemistry, pharmacology, and pharmacokinetics property. J Ethnopharmacol. 2018;219:233–247. doi: 10.1016/j.jep.2017.10.015. [DOI] [PubMed] [Google Scholar]
- 11.Lei H, Wang X, Zhang Y, Cheng T, Mi R, Xu X, Zu X, Zhang W. Herba Cistanche (Rou Cong Rong): a review of its phytochemistry and pharmacology. Chem Pharm Bull. 2020;68(8):694–712. doi: 10.1248/cpb.c20-00057. [DOI] [PubMed] [Google Scholar]
- 12.Geng X, Tian X, Tu P, Pu X. Neuroprotective effects of echinacoside in the mouse MPTP model of Parkinson’s disease. Eur J Pharmacol. 2007;564:66–74. doi: 10.1016/j.ejphar.2007.01.084. [DOI] [PubMed] [Google Scholar]
- 13.Deng M, Zhao JY, Ju XD, Tu PF, Jiang Y, Li ZB. Protective effect of tubuloside B on TNF alpha-induced apoptosis in neuronal cells. Acta Pharmacol Sin. 2004;25(10):1276–1284. [PubMed] [Google Scholar]
- 14.Nan ZD, Zhao MB, Zeng KW, Tian SH, Wang WN, Jiang Y, Tu PF. Anti-inflammatory iridoids from the stems of Cistanche deserticola cultured in Tarim Desert. Chin J Nat Med. 2016;14(1):61–65. doi: 10.3724/SP.J.1009.2016.00065. [DOI] [PubMed] [Google Scholar]
- 15.Nan ZD, Zeng KW, Shi SP, Zhao MB, Jiang Y, Tu PF. Phenylethanoid glycosides with anti-inflammatory activities from the stems of Cistanche deserticola cultured in Tarim desert. Fitoterapia. 2013;89:167–174. doi: 10.1016/j.fitote.2013.05.008. [DOI] [PubMed] [Google Scholar]
- 16.Morikawa T, Pan Y, Ninomiya K, Imura K, Yuan D, Yoshikawa M, Hayakawa T, Muraoka O. Iridoid and acyclic monoterpene glycosides, kankanosides L, M, N, O, and P from Cistanche tubulosa. Chem Pharm Bull. 2010;58(10):1403–1407. doi: 10.1248/cpb.58.1403. [DOI] [PubMed] [Google Scholar]
- 17.Li SL, Song JZ, Qiao CF, et al. A novel strategy to rapidly explore potential chemical markers for the discrimination between raw and processed Radix Rehmanniae by UHPLC-TOF-MS with multivariate statistical analysis. J Pharm Biomed Anal. 2010;51(4):812–823. doi: 10.1016/j.jpba.2009.10.002. [DOI] [PubMed] [Google Scholar]
- 18.Peng F, Chen J, Wang X, Xu CQ, Liu TN, Xu R. Changes in levels of phenylethanoid glycosides, antioxidant activity, and other quality traits in Cistanche deserticola slices by steam processing. Chem Pharm Bull. 2016;64:1024–1030. doi: 10.1248/cpb.c16-00033. [DOI] [PubMed] [Google Scholar]
- 19.Ma ZG, Tan YX. Contents changes of six phenylethanoid glycosides under steaming time spans with wine in Desertliving Cistanche. Chin Trad Patent Med. 2011;33(11):1951–1954. [Google Scholar]
- 20.Peng F, Xu R, Wang X, Xu C, Liu T, Chen J. Effect of the steaming process on quality of postharvest cistanche deserticola for medicinal use during sun drying. Biol Pharm Bull. 2016;39(12):2066–2070. doi: 10.1248/bpb.b16-00250. [DOI] [PubMed] [Google Scholar]
- 21.Cui Q, Pan Y, Zhang W, Zhang Y, Ren S, Wang D, Wang Z, Liu X, Xiao W. Metabolites of dietary acteoside: profiles, isolation, identification, and hepatoprotective capacities. J Agric Food Chem. 2018;66(11):2660–2668. doi: 10.1021/acs.jafc.7b04650. [DOI] [PubMed] [Google Scholar]
- 22.Cui Q, Pan Y, Bai X, Zhang W, Chen L, Liu X. Systematic characterization of the metabolites of echinacoside and acteoside from Cistanche tubulosa in rat plasma, bile, urine and feces based on UPLC-ESI-Q-TOF-MS. Biomed Chromatogr. 2016;30(9):1406–1415. doi: 10.1002/bmc.3698. [DOI] [PubMed] [Google Scholar]
- 23.Bertelli M, Kiani AK, Paolacci S, Manara E, Kurti D, Dhuli K, Bushati V, Miertus J, Pangallo D, Baglivo M, Beccari T, Michelini S. Hydroxytyrosol: a natural compound with promising pharmacological activities. J Biotechnol. 2020;309:29–33. doi: 10.1016/j.jbiotec.2019.12.016. [DOI] [PubMed] [Google Scholar]
- 24.Touaibia M, Jean-François J, Doiron J. Caffeic Acid, a versatile pharmacophore: an overview. Mini Rev Med Chem. 2011;11(8):695–713. doi: 10.2174/138955711796268750. [DOI] [PubMed] [Google Scholar]
Associated Data
This section collects any data citations, data availability statements, or supplementary materials included in this article.
Data Availability Statement
The datasets used and/or analyzed during the current study are available from the corresponding author on reasonable request.