

Abstract
Objective
Information gaps that accompany hurricanes and floods limit researchers’ ability to determine the impact of disasters on population health. Defining key use cases for sharing complex disaster data with research communities and facilitators, and barriers to doing so are key to promoting population health research for disaster recovery.
Materials and Methods
We conducted a mixed-methods needs assessment with 15 population health researchers using interviews and card sorting. Interviews examined researchers’ information needs by soliciting barriers and facilitators in the context of their expertise and research practices. Card sorting ranked priority use cases for disaster preparedness.
Results
Seven barriers and 6 facilitators emerged from interviews. Barriers to collaborative research included process limitations, collaboration dynamics, and perception of research importance. Barriers to data and technology adoption included data gaps, limitations in information quality, transparency issues, and difficulty to learn. Facilitators to collaborative research included collaborative engagement and human resource processes. Facilitators to data and technology adoption included situation awareness, data quality considerations, adopting community standards, and attractive to learn. Card sorting prioritized 15 use cases and identified 30 additional information needs for population health research in disaster preparedness.
Conclusions
Population health researchers experience barriers to collaboration and adoption of data and technology that contribute to information gaps and limit disaster preparedness. The priority use cases we identified can help address information gaps by informing the design of supportive research tools and practices for disaster preparedness. Supportive tools should include information on data collection practices, quality assurance, and education resources usable during failures in electric or telecommunications systems.
Keywords: hurricanes, floods, population health, disaster preparedness, use cases, information needs
INTRODUCTION
Within a 3-month span in 2017, Hurricanes Harvey, Irma, and Maria and the Pacific Northwest wildfires cost nearly 3 times the average global economic costs of the prior 10 years of natural disasters,1–3 highlighting key emergent concerns related to population health during disaster recovery (eg, socioeconomic burden, burden of disease, uncertainties over missing persons, communities coping with prolonged displacement and loss of essential services).4–8 Despite population health being broadly adopted as a framework to understand health outcomes explained by the risk factors, mitigating factors, and health determinants,9,10 it has not permeated into research efforts in disaster settings. With disasters on the rise (ie, Australian wildfires and COVID-19 [coronavirus disease 2019] pandemic) simultaneously with data science innovations, sophisticated data networks in close partnership with population health research communities are needed to innovate disaster response.
Difficulties forming collaborations amidst disasters and the historically discipline-centric approach taken in disaster data collections have stifled research data efforts.11,12 Decades of natural disasters have spurred the creation of the National Institutes of Health Disaster Research Response (DR2) Program that calls for multidisciplinary data collection and data sharing among stakeholders and decision-makers.9–14 Research instruments, such as the DR2 toolkit and Community Assessments for Public Health Emergency Response (CASPER) surveys, have gained adoption to improve data collection, but population health research communities still have critical areas of unmet data needs in disaster preparedness.
Various data sources related to environmental and health factors within communities have yet to be combined effectively for easy access by population health research communities. Arctur15,16 and Bandaragoda et al17 produced data archives about environmental factors before, during, and after Hurricanes Harvey, Irma, and Maria to support communities dealing with posthurricane water quality concerns.18 Maas et al19 showcased Facebook data used to detect outbreaks and connectivity coldspots. Adoption of electronic health records (EHRs) has made clinical data commonplace to research domains like bioterror surveillance20 and population health analyses, but EHR data sharing has not been systematically integrated within disaster research datasets due to the additional security and infrastructure challenges.12,13,21,22 The complex challenges presented by recent disasters and the COVID-19 pandemic have elevated the need to create robust data sharing networks for population health research communities to enable information retrieval and survey for health outcomes related to disasters.20,22–25
The Partnership-Driven Clinically Federated (PCF) Data Sharing Model provides a 4-quadrant framework that can enable data sharing for populations health communities studying disaster response through an iterative spiral model of development across (1) building collaborative partnerships, (2) defining system requirements, (3) developing technical architecture, and (4) conducting promotion and evaluation through measurable system utility.26 The PCF model highlights the need for clear use case definitions to drive the iterative cycles of development, and the need to identify key facilitators and barriers to ensure that the technical system architecture and evaluation iterations lead to success.
The objective was to assess key aspects for developing a robust data sharing solution to share complex disaster related datasets, this study examines the information needs of population health researchers to prepare for weather-related disasters: hurricanes and floods. We conducted a needs assessment to characterize barriers, facilitators, and priority use cases of population health researchers for hurricane and flood disasters. Guided by the PCF model, we examined sociotechnical barriers and facilitators that impact collaborative research and adoption of data and technology. To inform measurable system utility, we sought to identify use cases that reflect ways that population health researchers may interact with future tools to best meet their needs.24 This needs assessment addresses 2 research questions: (1) What are the barriers and facilitators of population health researchers for hurricane and flood disaster preparedness? and (2) What use cases do population health researchers prioritize for hurricanes and flood disaster preparedness?
MATERIALS AND METHODS
Study design
We conducted a needs assessment through individual sessions consisting of qualitative interviews and mixed-methods card sorting. Study procedures were approved by the University of Washington Institutional Review Board.
Setting and participants
We defined population health researchers as professionals who use health information, policy, and determinants of health data to study health for populations that reside within a geographic area, adapted from Lindsay.10 We used email snowball sampling to recruit a convenience sample. To achieve a diverse sample, we attempted to recruit participants from different work settings (ie, academic, government, nonprofit) and geographies affected (Puerto Rico) and not affected (Washington state) by the 2017 hurricanes. Respondents were eligible if they were English speakers and conducted population health research.
Data collection
Between June and December 2018, the first author (J.P.) conducted 15 individual sessions (14 in person, 1 video conference) lasting 80 minutes on average (range = 40 minutes to 4 hours). Sessions were audio recorded and transcribed.
Interviews
Each session began with a semi-structured interview (see Supplementary Appendix 1 for interview guide). We asked about 4 main constructs informed by prior disaster research and the PCF model.9–11,26 These constructs include (1) researcher role and expertise, (2) readiness for future hurricanes and floods, (3) barriers and facilitators to collaborative research, and (4) barriers and facilitators to data and technology adoption. Specifically, construct 1 is drawn from known challenges to prioritizing research gaps amid a disaster,11 and constructs 2-4 are drawn from PCF’s promotion and evaluation quadrant, collaborative partnerships quadrant, and both the system requirements and technical architecture quadrants, respectively.26
Card sorting
Guided by PCF’s promotion and evaluation quadrant, we identified use cases that can inform measurable system utility through card sorting. After the interview, we conducted a think-aloud closed card sort using 31 hurricane- and flood-related information cards (see Supplementary Appendix 2 for information cards). We developed the cards to represent research information that can be tentatively collected and indexed within data archives, such as the Hurricane Maria Collection.17 We color-coded the card into 6 categories based on Hurricane Maria Collection indexing.17 The cards include concepts from geographic indicators of community resilience,5,9,12,27 health research from prior hurricanes and floods,4,6–8,27,28 and known disaster research concerns.10,11,29
We used closed card sorting30 to ask participants to group cards into categories of usefulness. We asked participants to envision themselves as the key actor for population health research during disaster preparedness for an anticipated hurricane or flood 10 days in the future. We asked participants to “think aloud” while sorting the 31 cards into 3 groups: useful, maybe useful, or not useful for research. Participants then prioritized the cards they rated as useful and maybe useful to support population health research for an anticipated hurricane or flood. The think-aloud protocol provided an opportunity to discover use cases representing how participants think and group priority information across cards.31 We conducted card-sorts for 3 sessions electronically using the OptimalSort Web interface and used paper cards for the remaining 12 sessions. Finally, we asked participants to nominate information concepts not already represented in the 31 cards that they would find useful for population health research in disasters. We took photographs of the completed physical card sorts and downloaded electronic card sorts using the OptimalSort card-sort reports.
Data analysis
Barriers and facilitators to hurricane and flood disaster preparedness
We used template analysis32 in Dedoose to analyze interviews according to predefined themes aligning with the interview guide’s 4 constructs. Informed by PCF and disaster research challenges,11,26 the first author (J.P.) created the following codebook: For researcher roles and expertise (construct 1), we coded for research training, subject matter expertise, analytical methods, current occupational setting, and context in research (ie, place of focus, temporal scale, geospatial scale). For readiness for future hurricanes and floods (construct 2), we coded for indications of planning and preparations, barriers and facilitators they envisioned for future disaster research, and prior disaster management experience. For barriers and facilitators to collaborative research (construct 3), we coded for negative and positive attitudes toward their research collaboration experiences. For barriers and facilitators to data and technology adoption (construct 4), we similarly coded for negative and positive attitudes. A second coder (S.H.) independently applied the codebook to several 10% samples of interview excerpts. Both coders met multiple times to assess interrater reliability (IRR) and reconcile discrepancies until consensus was reached. A final IRR of K = 0.67 was achieved.
Priority use cases for hurricane and flood disaster preparedness
We used exploratory sequential mixed methods to analyze card sorts. An exploratory sequential mixed-methods analysis begins with a qualitative research phase in which findings are built on in a later quantitative phase.33 We first used thematic analysis by open coding to identify use cases from think-aloud transcripts.34 Then, we translated this analysis into data matrices to quantify relationships between information needs and use cases (Figure 1).
Figure 1.

Abstracting think-aloud card sorts into data matrices. (1) The participant completes the card sort identifying the subset of cards they perceive as useful, maybe useful, and not useful. (2) The participant describes the information uses of the cards and their groupings through think-aloud, which we identify as excerpts. (3) We applied thematic analysis to identify use cases described within the excerpts, then mapped the information cards associated with the use cases. (4) Last, the annotations are translated to a data matrix, which denote the participant’s perceived usefulness rating for each information card (rows) and given a score of 1 for each associated use case (columns). Thereafter, the data matrices are usable for quantitative analyses.
For thematic analysis, the first author (J.P.) used open coding in Dedoose to develop a code book that identified emerging themes reflecting different use cases. We define “use case” as goals discussed by participants through use of information represented by the cards.24 Like the interview transcripts, the second coder (S.H.) independently and iteratively applied the codebook to 10% samples of transcript excerpts from the think-aloud. Both analysts reconciled coding discrepancies until consensus was reached. A final IRR of K = 0.99 was achieved for the sample.
Next, we used descriptive statistics and cluster analysis to discover relationships between use cases and card sorts using a Python v3.6 Jupyter notebook. We translated each participant’s card sort into a sparse matrix, where information cards (row) discussed by the participant as related to a use case (column) were given a score of 1 (see Supplementary Appendix 3 for data matrices). We annotated the perceived usefulness ratings for each information card (ie, useful, maybe useful, not useful) and “addition” for nominated information. Each information card was summarized into a perceived usefulness score, the proportion of participant usefulness ratings. We then calculated Pearson’s correlation coefficients to estimate pairwise similarities in participants’ perceived information usefulness for research (see Supplementary Appendix 4 for the analysis notebook). We used hierarchical agglomerative clustering with Euclidean distance and Ward’s minimum variance method to detect clusters based on the Pearson’s correlation of perceived usefulness scores.35 The optimal k clusters was identified using the elbow method, in which additional clusters after k contribute a minimal reduction to the explained inertia.36
RESULTS
Participants
Fifteen eligible respondents consented to participate (P01-P15). Participants resided in the Territory of Puerto Rico (n = 2: P01, P02) and Washington State (n = 13: P04-P08, P11-P13, P16-P20). The small sample size and variability in research specialties limited place-specific comparisons.
Researcher role and expertise
Participants primarily worked in academia (n = 10) and government agencies (n = 5) with 13 types of research training and 22 areas of subject matter expertise (see Supplementary Appendix 5 for descriptive analyses). On average, participants reported 2 types of research training (range = 1-4), with the top 4 being epidemiology, environmental health, global health, and emergency management. On average, participants reported 6 areas of subject matter expertise (range = 1-12) with the top 4 being all-hazards emergency management, exposure hazard agents, health outcomes related to disasters, and disease surveillance systems. Participants described their analytical methods as primary data analysis (n = 5), secondary analysis (n = 4), and both primary and secondary analyses (n = 2). Four participants did not describe their analytic methods. Contexts of research with spatiotemporal data varied, but often had 1 or more time scales (eg, hourly, annual) and geospatial scales (eg, county, state, national).
Readiness for future hurricanes and floods
Thematic analysis identified 3 participant groupings for readiness for future hurricane and flood disaster research: planned and prepared (n = 6), experienced but not prepared (n = 7), and no experience (n = 2). Figure 2 compares readiness for population health research in future disasters by summarizing participants’ subject matter expertise by occupational setting.
Figure 2.

Participant subject matter expertise. Stratified by current occupational setting and readiness categories, the distribution displays the subject matters that are currently part of disaster management by government staff vs areas of research by academics.
Six participants (P02, P16-P20) self-identified as planned and prepared for disaster management, including 5 government staff and 1 academic. These participants collaborated within Federal Emergency Management Agency incident command teams: emergency medical services, situation awareness teams, and reconnaissance teams (eg, environmental health strike team, epidemiology response team). Participants indicated that some teams are activated continuously throughout disasters, while reconnaissance teams deploy on short rotations (eg, 3 weeks), typically after the disaster response, to collect data for applied health and hazard assessments.
In contrast, participants without plans for disaster management primarily sought new collaborations in support of disaster recovery needs. Seven participants (P01, P04, P06, P08, P11-P13) had prior experience with disaster management but no longer consider themselves prepared in their current role. Two participants (P05, P07) had no prior experience with disaster research and expressed needs for knowledgeable collaborators. These 9 participants described the need to navigate administrative barriers, such as finding collaborators with specific skills (eg, community stakeholders, data collectors, analysts, points of contact with local familiarity), developing research plans, seeking approvals, and obtaining funding.
Barriers and facilitators to hurricane and flood disaster preparedness
We identified 7 barriers and 6 facilitators to collaborative research and adoption of data and technology (Figure 3).
Figure 3.
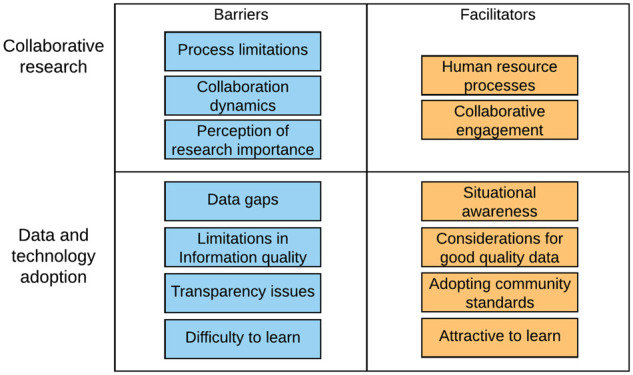
Barriers and facilitators of collaborative research and data and technology adoption.
Barriers and facilitators to collaborative research
Population health researchers expressed 3 barriers and 2 facilitators to collaborative research for disaster preparedness (Table 1).
Table 1.
Themes about collaborative research
| Barrier (participant prevalence) | Representative quotes |
|---|---|
| Process limitations (n = 12) | “How are we going to be sustainable… and, I mean sustainable in all of the senses of the word. Economically in terms of resources, personnel, and as an administration.” (P02) |
| “With the economic situation…, I wouldn’t be surprised if some of these people [new graduates] just migrated elsewhere.” (P01) | |
| “Once an event happens, it’s a little late… it would be great, you know, if this is the preparedness side of things, like if we were better prepared by sharing information before there’s an event.” (P06) | |
| Collaboration dynamics (n = 5) | “We recruited a community partner, and they ended up not implementing the thing that we had wanted them to implement… they were like ‘we don’t have time, we don’t have time, we didn’t have time’ and then they just -- you know, we ran out of time.” (P06) |
| “There were sort of territorial constraints over who got to control people’s time and allocating work. Um, and the human-level interactions got ugly as a result.” (P05) | |
| Perception of research importance (n = 5) | “They were trying to go directly to the recovery phase without going to the response phase. The response phase is always [the] immediate need… They were talking about developing strategies for the long-term. No, sir. … We are now in the response phase and people need essential services to survive.… most of the agencies were trying to develop strategies in the wrong phase.” (P02) |
| “Police, fire, EMTs – that’s your normal response… the part that’s unsung is recovery. So public health, in my mind and some of my counterparts’ minds, is we’re the day after people… you know, that’s where it gets to be difficult, because that’s where we see a difference in what we do versus what first responders [do].” (P18) | |
| Facilitators | |
| Collaborative engagement (n = 14) | “I think the reputation of the team is important. So, if they’ve successfully pulled this kind of thing off before, that’s--that adds to my confidence and probably, for better and for worse, diminishes the amount of time I would spend checking up on them somewhere else.” (P05) |
| “I think if the state had just done that in a vacuum, I don’t think the results would have been as well received by other local health jurisdictions. So by having a peer actually do that more -- that kind of study, it validated and gave maybe a little bit more credence I think with local decision makers.” (P18) | |
| “You have to have both a sort of an appreciation of the other person’s perspective, but also an appreciation of their approach. Their methodological training that’s relevant for them, how they think about the problem and -- and, respect. I mean, it requires a great deal of mutual respect.” (P08) | |
| Human resource processes (n = 14) | “You’d have to plan in advance for the data that you’re going to need and make sure that you’ve got the partnerships in place, so that you can get the access to the data and do the analysis quickly to get a sense of how big were the health consequences and where were the biggest health consequences.” (P11) |
| “We have a lot of plans, but a lot of it has to be exercised. That’s where you really are only going to find the gaps. So, the source of the data would be important and making sure that [it] can be sustainable.” (P20) | |
| “We are concerned that people are still going out in these disciplinary teams and they’re not incorporating public health or behavioral health or behavioral sciences or social sciences.” (P08) |
Barriers
Process limitations reflect the burden of rate-limiting logistics. In the aftermath of a hurricane, people migrate away because of evacuation or migrate to areas with better funding and capacity because of the “economic situation” (P01). For population-based research projects, this redistribution results in fewer people available to recruit as local collaborators or study participants. Participants emphasized that defining the scope of research is an intensive process that requires collaborative interest and momentum but complicated by other duplicate efforts. The situation and its time-sensitive events may evolve sooner than the time needed to set up research programs.
Collaboration dynamics may decline as tensions between collaborators escalate. Under stress of rigid time allocations, collaborators may run “out of time” (P06) to complete their contributions, resulting in delays. Collaborators may respond seeking to “control people’s time” (P05), overstepping professional boundaries and forming territorial rifts. These burdensome experiences present challenges to interpersonal communication, collaborative implementations, and difficulties maintaining ongoing collaborations.
Perception of research importance reflects the public’s view of disaster preparedness. There was a distinction between flexibility and a culture of improvisation as it relates to disaster planning. Flexibility is still operating within the guidance of a plan. Improvisation, seen as operating without plans or straying from plans, fragments coordinated efforts like “developing strategies in the wrong phase [of disaster management]” (P02). The desire to improvise may be based on misconceptions about vulnerabilities and consequences of error. These perceptions influence the preparations performed and information communicated, but they can also be divisive between collaborators who may not relate with the amount of coordinated efforts required.
Facilitators
Collaborative engagement was crucial to fostering working relationships proactively built on trust, respect, autonomy, and flexibility. Reputation can give “credence” (P18) for peer adoption of the product when it models how the community or decision makers might approach the problem and how the end product could be received. The process is a “dance” (P20). Collaborators will need to separate independent versus collaborative tasks, learn how to respect each other’s lanes, focus on mutual goals, and recognize how to solicit feedback. Building rapport through engagement should progress toward indications of “deep collaboration” (P06). Understanding how collaborators use these interactions enables more meaningful developments and supportive experiences.
Human resource processes facilitate building teams with the right traits. Collaboration between disaster management teams, local health officials, and civilian points of contact are critical mechanisms within the emergency management plans. Reconnaissance teams seek out collaborations and exchange information with data collectors, subject matter experts, and people with local familiarity and context knowledge. Disaster management agencies address staff shortages using their organizational infrastructure to find teams for rotations. Some participants found collaborators via social network platforms like LinkedIn. “Students” (P07) and “biology majors” (P18) with prerequisite training are desirable candidates for public health capacity development. However, such knowledge was not typically available prior to community deployment. Mechanisms to find subject matter experts and trainable personnel was thought to be beneficial, provided the information about these human resources are well maintained.
Barriers and facilitators to data and technology adoption
We identified 4 barriers and 4 facilitators to adoption of data and technology for disaster preparedness by population health researchers (Table 2).
Table 2.
Themes about data and technology adoption
| Barrier (participant prevalence) | Representative quotes |
|---|---|
| Data gaps (n = 14) | “One problem is that sometimes Puerto Rico is excluded from data generated for the United States, because it focused on the states.” (P01) |
| “‘Yeah, this is definitely giardia’. Uh, ‘this is not.’ ‘They missed three weeks of their metformin and now they're back on it.’ Those are the kinds of things that the emergency response does not separate or disaggregate for us.” (P18) | |
| “One of the things that came out of this forum is we have to really step up guidance to local people on the ground to collect baseline data, so we know the situation before [a disaster] and we know what it needs to get back to right after a disaster… biodiversity, a density of product, in some cases the baseline chemical analysis to, you know, what baseline contamination is.” (P19) | |
| Difficult to learn (n = 11) | “When the outbreak of leptospirosis occurred in Puerto Rico… they didn’t know how to deal with the paperwork or how to collect the data days after the hurricane without a [computer] system, even if it was considered in the plan.” (P02) |
| “There were links to the same map from different websites, but some of them worked and some of them didn’t. Or, they use some sort of platform… It was kind of frustrating. Some of them never would load.” (P17) | |
| “It was also in a totally separate application. So, I had to impute from this little map over here and figure out where to look.” (P17) | |
| Limitations in information quality (n = 14) | “They require a correction factor. And, it’s unknown if the correction factor works in really bad events.” (P13) |
| “It is not geo fenced. We can’t get data just for Houston or we can’t get data just for Santa Rosa. We get data for everyone and we don’t know where they’re from, so that wasn’t very helpful.” (P13) | |
| Transparency issues (n = 12) | “There’s not a lot of ways to track that data because it goes into the emergency response realm. It doesn’t come back to the public health realm.” (P18) |
| “Even right now, you can’t publish data with information about health conditions that have small counts, where people could be identified.” (P12) | |
| Facilitators | |
| Situational awareness (n = 13) | “We needed some way of showing ‘awareness’ and ‘activation’ in different parts of the forecasts and warning system… It’s very hard to show something this complex in a way that you can get an overview of. And so we wanted a graphic representation that will still give people some idea of the content.” (P08) |
| “We’re usually looking for acute impacts… E. coli, Salmonella or something, you know, like something that’s going to have a short term impact, we might monitor for an outbreak in patients residing in those areas.” (P17) | |
| “With local health jurisdictions, they know what’s going on in their communities in a way that we never could. They make observations all the time that we wouldn’t or couldn’t with the technical experts all around our agency.” (P16) | |
| Considerations for good quality data (n = 8) | “These studies always include a data analyst who’s at least half time on the project, whose job is to ensure that the data is coming in properly based on the software that we’re using for defining that collection.” (P04) |
| “When you’re talking about weather and health, you’ve got more data availability for weather data and it’s more granular… The challenge is usually finding health data at that granular level. So, the health data tends to determine the scale at which you can do your analysis.” (P12) | |
| Adopting community standards (n = 7) | “Probably the most popular one is CASPER… It’s published by the CDC. It’s been well validated in a variety of different disasters.” (P13) |
| “For some kinds of research [questions] you need data that is identified but for many other things you may just need de-identified data.” (P01) | |
| Attractive to learn (n = 9) | “Has its own disaster response research protocol that also collects exposure data… things like air quality or water quality or soil quality, hazardous material exposure, and then also some health information. You can customize the tools.” (P13) |
| “With epiR, you can adjust 20-, 30-, whatever number of rates by age, which used to be a real hassle. Once you learn how to do that, you just have a script ready.” (P01) | |
| “They bring this kit that is -- allows you to -- to do incubation for fecal enterococci and coliforms in this in situ system… it was very useful for communities to know if it was safe for them to use that water… Most of the labs were damaged.” (P02) |
Barriers
Data gaps obscure the representation of the situation. To understand health outcomes, participants leveraged platforms adopted by their stakeholders, including EHRs. During normal functions, data collection systems, including EHRs, may operate with different standards, giving rise to “incomplete entries” (P06) and incomparable data points, and it may be unclear when the systems “stopped acquiring data” (P02). During disasters with power loss, medical services strive to continue and may revert to paper-based records; gaps may arise when workflows change data capture becomes second priority. Participants agreed that data for status characterization have been insufficient to separate prevailing versus disaster-related impacts, needing more baseline information about exposures, mental health status, and access to care issues. Although certain strategies may fill data gaps, systemic problems with incompleteness and sensitivity to disruption may present new gaps over time.
Difficulty to learn was a prominent theme related to changing workflows, ranging from software updates to loss of electronic or Internet-based tools. Several participants associated new tools and workflows with a “learning curve” (P01). When relearning tasks or tools, participants wanted to ensure that the efforts are minimal but usable toward various tasks, which is limited if the tool is siloed by design and more difficult when also adopting prerequisite systems. Thus, collaborations need to consider the training strategy, diverse personal abilities, and the overall sustainability of the strategy.
Limitations in information quality reduce the trustworthiness and usability of information. Early into a crisis, situational information may be scarce and “knowingly inaccurate” (P16). Data collection is viewed as the critical time for quality and validity assurance, inspecting for information to denote geographic relevance, and noting inconsistencies, resolution concerns, and sample size issues.
Transparency issues were characterized by concerns about assurance of ethical use, timely access to data, and lag. During evacuations, populations may seek help from urgent care tents and places of refuge. Participants were unclear where evacuations were directed, whether information about help was documented, and whether information was directed into organizational “silos” (P18) that were unprepared to share. Participants were unclear on where to find information to locate vulnerable populations, as the term can be diversely defined. Access to data and transparency about how information is handled affected what questions researchers decided to pursue and how they conducted their research.
Facilitators
Situational awareness was described as information relevant to understanding a situation through the contextual factors. Participants sought information from reliable sources with authoritative knowledge, supplemented with “free text” (P20) information from key informants and credible sources who have perspectives of the situation on the ground. Once collected, geographic maps, such as “flooding dashboards” (P17), have been useful for broader mass communication and enabling community discussions on redevelopments, “scenarios of climate change” (P02), and “future urbanization plans” (P11).
Considerations for good-quality data reflected best practices to ensure validity and trustworthiness. Datasets are often created fit for purpose. To assess the data validity, participants looked for indicators that records are “robust” (P16) to replication, indicative of valid measurement, and that data provide high-resolution across time and space. Three participants asserted that collaborative projects should have a designated analyst to assure data quality immediately as data are received.
Adopting community standards was described as aligning with community best practices to avoid duplicating efforts. There were concerns that research tools continue to be “recreated all the time” (P06) without improving beyond current tools. To facilitate new data collections, participants recommended use of validated toolkits like CASPER and DR2 surveys. These tools were designed with field sampling strategies, multiple languages, a focus on health effects, portable dashboards, and collective inputs about human factors engineering from use in past disasters.
Attractive to learn reflects participants’ desire that efforts to learn technologies have a high return on investment. Participants desired tools with offline capacity for use during unreliable connectivity settings, such as water testing kits, Epi Info, CASPER surveys, and DR2 toolkits. Few tools provide “analogous paper systems” (P18) for data collection, then portable analyses on local dashboards with passive syncing capabilities. Participants also valued flexibility through customization, having control and process automation that reduce “hassles” (P01) in analysis supported with direct communication channels with data experts.
Priority use cases for hurricane and flood disaster preparedness
Thematic analysis of think-alouds during the card sort identified 79 unique information use cases, in which the median of 14 use cases identified per session (range, 5-29). The analysis revealed participants’ rationale for prioritizing information in envisioned workflows. For example, Figure 4 shows P18’s card sort as the needs of a reconnaissance team member for predeployment information and data collection goals over time to assess population health status. Although 18 use cases were identified from P18’s card sort, some reflect concise goals (eg, identify skilled personnel), while others are more complex, such as requiring information at regular intervals from multiple sources (eg, make regular assessments of individual and community well-being). The relationships and variability among participants in information needs and use cases were quantified in Supplementary Appendix 5.
Figure 4.

Card sort with P18 identified 18 potential use cases, of which 6 clusters prioritized by time sequence are visible in the loadings (1-6). P18 is an environmental health reconnaissance team member who focuses on disaster recovery. 1 and 2 summarize information about the accessible paths and the location of vulnerable populations, preferred prior to deployment. 3-5 establish preliminary assessments for fixes and disease surveillance needs once arrived and repeated to gather regular updates. Throughout the deployment, 6 provides a means to find and build research capacities. P18 nominated shelter and feeding stations and wastewater treatment [plants] and their capacity as nominated information (7).
Of the 79 total use cases, 15 were discussed by 5 or more participants (Table 3). These 15 use cases reflect the need for predisaster characterization of areas with vulnerable populations, areas with limited accessibility, potential risk factors, and estimates of the population size at risk. Several use cases began predisaster but lead into disaster response and recovery, including access to care and treatment, surveying individual and community well-being, and health outcomes, providing just-in-time training, and information sharing between disaster response and affected communities. Some use cases showed information that needs to be collected before disasters have occurred, which could expedite the efficiency in postdisaster data collection.
Table 3.
Information use cases discussed by 5 or more participants
| Use case (participant prevalence) | Definition | Relative time to the disaster |
|---|---|---|
| Locate and prioritize areas with vulnerable populations (n = 8) | Elderly individuals, children, frail individuals, and people who depend on devices to live. This may include knowledge of where are the nursing homes, intermediate care facilities, and the allied specialized healthcare facilities. | Before |
| Identify risk factors that will impact people in the area (n = 8) | Based on prior information about hazards, identify what risk factors are present on site and how they may have direct or indirect effects in understanding causal outcomes within the community. | Before |
| Assess pre-event conditions (n = 6) | Consider the status of resources vulnerable to change or damage before the disaster occurs. | Before |
| Characterize areas with limited accessibility (n = 6) | In the absence of telecommunication, areas with limited physical access would have difficulty seeking help. Document the status of roadways and transportation routes to characterize areas at risk of geographic isolation if damaged or blocked. | Before |
| Estimate the effect denominators for population size at risk (n = 5) | Based on the anticipated event, the number of people at risk should be estimated based on the population size that are residents, work in the area, and the rate and frequency of changes in such estimates. | Before |
| Assess access to care and treatment (n = 9) | Access to usual treatment was discussed with regard to chronic disease patients. | Before and after |
| Coordinate efforts with the administrative governance (n = 7) | Engage with administrative entities to understand their information needs and collaborative opportunities to make research useful to them. Consider how to plan project work and disaster management steps to avoid impeding each other. | Before and after |
| Estimate the expected rates of health outcomes (n = 5) | Based on knowledge of the population size and prior health outcome events, estimate the expectation for possible health outcomes and use those to compare with the rates of occurrence. | Before and after |
| Provide just-in-time training (n = 5) | During planning, the key players and human resources need to be identified. The skilled human resources may not be experts, but they may know enough to be trained quickly for technical tasks. | Before and after |
| Characterize the place and people in the community of focus (n = 5) | Assemble a debrief about the place and community situation. This can include the languages and choices for communication strategies, the demography and population size, and cohesiveness. This is prerequisite knowledge to start human-centered efforts. | Before and after |
| Characterize potential harms in water systems (n = 7) | Prioritized with knowledge about the affected areas, water system tests can be performed to get a sense of the chemical and microbial exposure harms to the local population. | After |
| Make regular assessments of individual and community well-being (n = 6) | Collect information on the physical health, mental health status, and hazards affecting communities. Make cross-sectional measures of the amount of damage and disrepair, the number of people that died or sustained health issues, and the prevalence of coping for emotional stressors. | After |
| Identify major acute health concerns (n = 5) | Surveil for concerns that may intensify into risks of acute death. Observing these health concerns would need preparation in order to recognize, mitigate, and contain early warning signs. | After |
| Identify roads that are operational (n = 5) | Identify roads and highways that were not damaged. This status is conditional, but the information is necessary as access ways for responder deployment and routing decisions. | After |
| Identify skilled personnel (n = 5) | Consider what kind of human resources are available and skill level. This could be anywhere and brought in or locally in the affected zone. | After |
Perceived usefulness of information in future hurricanes and floods information
Pearson’s correlation and cluster analysis found 6 clusters as the optimal number to explain perceived usefulness scores among the 31 information cards (Figure 5). The “time constraint (annual)” card was excluded because of lack of variation between perceived usefulness scores. Supplementary Appendix 4 provides the correlation and cluster analysis with interpretations for the intracluster correlations (see Supplementary Appendix 4 for the analysis notebook). Cluster 1 contains cards rated most useful, consisting of all spatial location information (blue cards), health outcomes by county, microbial presence testing, human resource, and time constraint (up to 2 weeks). Cluster 2 contains cards perceived as less useful than cluster 1, consisting of county- and tract-level demographics (green cards), geographic boundaries (orange cards), and logistic and context information (purple cards), such as time constraint (real time) and time constraint (monthly updates). Clusters 5 and 6 contain the cards perceived as least useful and include state- and territory-level information. These clusters explain the patterns in perceived usefulness, which information are more likely to have been shared, and measurable system utility to address use cases.
Figure 5.

Perceived usefulness scores and clusters of cards with similar usefulness ratings. The perceived usefulness scores are depicted as proportions of participant ratings in each category: useful, maybe useful, and not useful. Each card is clustered into a group (numbered box) that represents the most correlated group of cards based on the perceived usefulness cores. Cards with asterisks were sorted by at least 11 of the 15 participants.
Nominated information
Participants nominated 30 additional information types to supplement the original 31 cards. Nominated information ranged from care service locations, health vulnerabilities, and response protocols, to governmental or tribal infrastructure, and environmental data. Specialty care service locations, like dialysis clinics and allied health providers, are important for continued access to life-saving treatments, whereas doctor’s offices, clinics, and ambulatory surgery centers have resource preparations to be potential emergency surgical centers. Navigating access to care issues would need annotations and decision support about health vulnerabilities (eg, location of patients that depend on electrical devices, poison control, highly prevalent investigations of infectious disease), some of which may be contained within electronic health record information and econometric surveys and databases. Participants suggested clarifying annotations about response protocols such as the health system standard operating protocols, individual- and family-level preparedness, community cohesiveness, disposal plan for dead bodies, evacuation plans, and the shelter and feeding station locations. Tribal government jurisdiction, Insurance coverages, and government response infrastructure clarify the policies governing response actions and collaborations. Last, data communications would benefit from visualizations referencing community boundaries, neighborhood information, power source locations, and wastewater treatment capacities within watershed boundaries. These vocabulary provide a more relatable set of terms for population health research use, but more consideration is needed to explore data production and archival.
DISCUSSION
This needs assessment characterizes barriers, facilitators, and priority use cases of population health researchers for disaster preparedness in future hurricanes and floods. Population health researchers experience barriers to collaboration and adoption of data and technology that contribute to information gaps and limit disaster preparedness. The priority use cases we identified can help address those needs by informing the design of supportive research tools for disaster preparedness. Our findings also carry implications for research and practice.
Our findings inform the design of information technologies that can meet the needs of population health researchers in disaster preparedness, such as use of social media, geographic information systems, and offline data analysis tools. Participants described use cases related to county level as the spatial scale meaningful for disaster management and coordination. At a finer scale, use cases at a census tract, zip code, or census blocks provide community-level effects needed to allocate resources. Disrupted communication channels are common to hurricanes, but the spatial scale is the necessary knowledge toward directing a response. Studies using Twitter and Facebook aimed to survey possible emergencies by detecting crisis messages and connectivity coldspots.19,37 Variable functionalities to geofence impede the ability to determine the jurisdiction and spatial scale of effect. Corroboration with community experience of local displacement could enhance the utility of such methods, what O’Sullivan et al9 calls “let the community teach the responders.” Such tools should follow best practices in data collection, quality assurance, incorporate low learning barriers, and enable offline or analog capacities for use during electrical or telecommunication disruption. These spatial functionalities may transfer to other catastrophes, such as wildfires and pandemic.23 Future research should examine how community assessment surveys and response activities may integrate new inference methods.
Geographic information systems dashboards offer desirable visual representation of population health and disaster data, but there may be barriers to use in areas with low connectivity. CASPER surveys, DR2 toolkits, and Epi Info are common tools for epidemiologists, in which data can be collected then analyzed with online-offline synchronization. While few tools have built-in cloud synchronization, such tools like Epi Info may not provide the security features necessary for use with sensitive health datasets. Future research should explore tractable use of big datasets within portable platforms that incorporate flexible design to transfer observations between tools.
Our findings carry implications for research. By combining qualitative analysis of interviews and card-sort think-alouds with quantitative clustering of card sorts, we triangulated themes, prioritized use cases, and obtained more comprehensive insights than either method would have alone. Integrating qualitative expressions from open-ended inquiry with computational clustering enabled us to prioritize a breadth of rich perspectives while retaining nuanced understanding. For instance, there was a notion that many barriers to population health research originate in routine operations. The notion that hurricanes and floods exacerbate these barriers and diminishes facilitators was reinforced by the priority use cases, which highlight gaps in baseline knowledge about environmental, medical, and socioeconomic factors prior to a disaster, which informatics can address.24 Further, by asking participants to nominate information cards, we solicited research-specific terminology that can be used in future resources. Given the complex nature of data sharing and collaboration in disaster preparedness, mixed methods that integrate the open-ended nature of qualitative research with the numeric rigor of quantitative research provide an excellent avenue for advancing the field.
Our findings also carry implications for practice, such as training. Although collaboration is a central facilitator of disaster preparedness, consistently operating near capacity raised concerns about engagement and participation. Researchers with minimal bandwidth may opt out of training, thereby limiting disaster response capacity. For example, new and advanced methods are being developed that use real-time big datasets offered by social media platforms, like Twitter and Facebook.19,37 These tools introduce new approaches toward demography and crisis mapping as well as challenges for interpretations across space time and meaning from text-based sentiments, which elevates the importance of training. Because tasks during disasters are seldom accomplished by individual researchers, it is imperative that training programs reach the team to achieve preparedness, but this is conditional on each individual researcher’s capacity for training and development. Thus, supportive tools should be accompanied by practice recommendations and adoption of community standards that can support situational awareness, learning capacity, and human resource support necessary for collaborative disaster preparedness.
Study limitations include our small sample size and scoped interpretation. Owing to the ongoing disaster recovery situations, we were unable to recruit a large number of researchers from affected areas, which limited our ability to compare the needs of researchers in affected and nonaffected areas. Our findings may not be transferable to population health researchers in other areas or groups, such as local health jurisdictions and nonprofit organizations. We cannot discount the possibility of misinterpreting cards rated “not useful,” as some participants found certain information cards to be unclear. Given the 30 nominated information concepts, it is unknown what insights would have been discussed if the deck had included a more comprehensive variety of cards. Future studies could pursue a larger and representative sample to validate findings.
Despite these limitations, this study has a number of strengths, including its mixed-methods approach and implications for future research and supportive solutions to enhance population health in disaster preparedness. Interviews solicited insights from participants through a range of questions. In contrast, think-aloud card sorting allowed participants to fluidly voice their questions, concerns, ideas, and research objectives for future preparedness scenarios while enabling quantification and clustering of priorities.30,31 Our findings could further inform design of tools for other forms of widespread disruption, such as earthquakes, wildfires, and communicable disease pandemics.
CONCLUSION
Population health research has been broadly adopted as a framework to understand community-scale health outcomes, but there is a critical gap in preparing for research to support community resilience to disasters like hurricanes and floods. Owing to the difficulties in forming new collaborations and use of data and technologies in disaster settings, various stakeholders in population health have not been prepared to engage in disaster research, resulting in various unmet research needs. Our findings inform the design of datasets and information tools that (1) adapt to the evolving needs and standards in scientific research, (2) build consensus for practices in data collection and quality assurance, (3) establish accessible educational resources for teams, and (4) prepare contingencies for technology access, such as redundant workflows for limited access to electricity or telecommunications situations. Many of the barriers we identified can be addressed with a prospective focus on building collaborative partnerships and designing tools to meet collaborative workflows.
FUNDING
This work was supported by the National Science Foundation under a collaborative RAPID grant led by the University of Washington (OAC 1761673 to JP and CJB), with project support from the Consortium of Universities for the Advancement of Hydrologic Sciences, based on National Science Foundation grants for the development of HydroShare (ACI 1148453 and 1148090 to JP and CJB), National Center for Advancing Translational Sciences Institute for Translational Health Sciences grant (UL1-TR002319 to JP) and Clinical and Translational Sciences Award Program National Center for Data to Health grant (U24TR002306 to JP). We used REDCap surveys as a research instrument (supported by UL1 TR002319 grant from National Center for Advancing Translational Sciences/National Institutes of Health). Travel to Puerto Rico was provided by the ESIP Lab with support from the National Aeronautics and Space Administration, National Oceanic and Atmospheric Administration, and the U.S. Geological Survey. The content is solely the responsibility of the authors, and does not necessarily represent the official views of these funding agencies.
AUTHOR CONTRIBUTIONS
JP contributed to conception of the study design, data collection, analysis and interpretation of data, and drafting of the manuscript. KAS contributed to conception of the study design and drafting of the manuscript. CJB and SDM contributed to conception of the research project, funding acquisition, and drafting of the manuscript. SH, ALH, and PO contributed to analysis and interpretation of data and drafting of the manuscript.
SUPPLEMENTARY MATERIAL
Supplementary material is available at Journal of the American Medical Informatics Association online.
Supplementary Material
ACKNOWLEDGEMENTS
We thank Calvin Apodaca, Ross Lordon, Sonali Mishra, Bryant Karras, Derek Fulwiler, and the University of Washington Population Health Initiative for contributions to the early study design and participant recruitment. A special thank-you to Dr Graciela Ramirez-Toro and Inter American University of Puerto Rico for hosting a stakeholder workshop and the participants of the workshop early in the project design—see online resources at Bandaragoda et al.17 Our deepest appreciation goes to the participants for their willingness to share insights and their commitment to improving population health research.
CONFLICT OF INTEREST STATEMENT
None declared.
REFERENCES
- 1.Below R, Wallemacq P. Natural Disasters 2017. Brussels, Belgium: Centre for Research on the Epidemiology of Disasters; 2018. https://cred.be/sites/default/files/adsr_2017.pdf Accessed November 26, 2018.
- 2.Shultz JM, Galea S.. Preparing for the next Harvey, Irma, or Maria—addressing research gaps. N Engl J Med 2017; 377 (19): 1804–6. [DOI] [PubMed] [Google Scholar]
- 3.Tuckson RV, Dzau VJ, Lurie N.. Creating healthy communities after disasters. N Engl J Med 2017; 377 (19): 1806–8. [DOI] [PubMed] [Google Scholar]
- 4.Greenough PG, Lappi MD, Hsu EB, et al. Burden of disease and health status among Hurricane Katrina–displaced persons in shelters: a population-based cluster sample. Ann Emerg Med 2008; 51 (4): 426–32. [DOI] [PubMed] [Google Scholar]
- 5.Lane K, Charles-Guzman K, Wheeler K, et al. Health effects of coastal storms and flooding in urban areas: a review and vulnerability assessment. J Environ Public Health 2013; 2013: 913064. [DOI] [PMC free article] [PubMed] [Google Scholar]
- 6.Lowe D, Ebi K, Forsberg B.. Factors increasing vulnerability to health effects before, during and after floods. Int J Environ Res Public Health 2013; 10 (12): 7015–67. [DOI] [PMC free article] [PubMed] [Google Scholar]
- 7.Quinlisk P, Jones MJ, Bostick NA, et al. Results of rapid needs assessments in rural and urban Iowa following large-scale flooding events in 2008. Disaster Med Public Health Prep 2011; 5 (4): 287–92. [DOI] [PubMed] [Google Scholar]
- 8.Alderman K, Turner LR, Tong S.. Floods and human health: a systematic review. Environ Int 2012; 47: 37–47. [DOI] [PubMed] [Google Scholar]
- 9.O’Sullivan TL, Kuziemsky CE, Toal-Sullivan D, et al. Unraveling the complexities of disaster management: a framework for critical social infrastructure to promote population health and resilience. Soc Sci Med 2013; 93: 238–46. [DOI] [PMC free article] [PubMed] [Google Scholar]
- 10.Lindsay JR. The determinants of disaster vulnerability: achieving sustainable mitigation through population health. Nat Hazards 2003; 28 (2/3): 291–304. [Google Scholar]
- 11.Miller A, Yeskey K, Garantziotis S, et al. Integrating health research into disaster response: the new NIH disaster research response program. Int J Environ Res Public Health 2016; 13 (7): 676. [DOI] [PMC free article] [PubMed] [Google Scholar]
- 12.Gall M, Nguyen KH, Cutter SL.. Integrated research on disaster risk: is it really integrated? Int J Disaster Risk Reduct 2015; 12: 255–67. [Google Scholar]
- 13.Maini R, Clarke L, Blanchard K, et al. The sendai framework for disaster risk reduction and its indicators—where does health fit in? Int J Disaster Risk Sci 2017; 8 (2): 150–5. [Google Scholar]
- 14.Leaning J, Guha-Sapir D.. Natural disasters, armed conflict, and public health. N Engl J Med 2013; 369 (19): 1836–42. [DOI] [PubMed] [Google Scholar]
- 15.Arctur D. Harvey flood data collections. HydroShare, 2018. https://doi.org/10.4211/hs.12e69ee668124fdf833b29b5167e03c3 Accessed March 9, 2019.
- 16.Arctur D. Irma flood data collections. HydroShare, 2018. https://doi.org/10.4211/hs.db5883d16e874ee3b7edd666dbad7d03 Accessed March 9, 2019.
- 17.Bandaragoda C, Phuong J, Leong M. Hurricane Maria 2017 Collection. HydroShare, 2018. http://www.hydroshare.org/resource/97a696e7202d4ca98349a0742a725451 Accessed March 9, 2019.
- 18.Hart J, Bandaragoda C, Ramirez-Toro G.. Sharing data helps Puerto Ricans rebound after Hurricane Maria. Eos 2019; 100. [Google Scholar]
- 19.Maas P. Facebook disaster maps: aggregate insights for crisis response & recovery. In: proceedings of the 25th ACM SIGKDD International Conference on Knowledge Discovery & Data Mining—KDD ’19; 2019: 3173. doi: 10.1145/3292500.3340412
- 20.Lober WB. Roundtable on bioterrorism detection: information system-based surveillance. J Am Med Inform Assoc 2002; 9 (2): 105–15. [DOI] [PMC free article] [PubMed] [Google Scholar]
- 21.Stephens KA, Lee ES, Estiri H, et al. Examining researcher needs and barriers for using electronic health data for translational research. AMIA Jt Summits Transl Sci Proc 2015; 2015: 168–72. [PMC free article] [PubMed] [Google Scholar]
- 22.Reeves JJ, Hollandsworth HM, Torriani FJ, et al. Rapid response to COVID-19: health informatics support for outbreak management in an academic health system. J Am Med Inform Assoc 2020; 27 (6): 853–9. [DOI] [PMC free article] [PubMed] [Google Scholar]
- 23.Jakubicka T, Vos F, Phalkey R, et al. Health Impacts of Floods in Europe: Data Gaps and Information Needs From a Spatial Perspective. Brussels, Belgium: Centre for Research on the Epidemiology of Disasters (CRED; ); 2020. [Google Scholar]
- 24.Revere D, Turner AM, Madhavan A, et al. Understanding the information needs of public health practitioners: a literature review to inform design of an interactive digital knowledge management system. J Biomed Inform 2007; 40 (4): 410–21. [DOI] [PubMed] [Google Scholar]
- 25.Portier CJ, Tart KT, Carter SR, et al. A Human Health Perspective on Climate Change: A Report Outlining the Research Needs on the Human Health Effects of Climate Change. Research Triangle Park, NC: National Institute of Environmental Health Sciences; 2013. [Google Scholar]
- 26.Stephens KA, Anderson N, Lin C-P, et al. Implementing partnership-driven clinical federated electronic health record data sharing networks. Int J Med Inform 2016; 93: 26–33. [DOI] [PMC free article] [PubMed] [Google Scholar]
- 27.Cutter SL, Ash KD, Emrich CT.. The geographies of community disaster resilience. Global Environ Change 2014; 29: 65–77. [Google Scholar]
- 28.Lindell MK, Prater CS.. Assessing community impacts of natural disasters. Nat Hazards Rev 2003; 4 (4): 176–85. [Google Scholar]
- 29.Johanning E, Auger P, Morey PR, et al. Review of health hazards and prevention measures for response and recovery workers and volunteers after natural disasters, flooding, and water damage: mold and dampness. Environ Health Prev Med 2014; 19 (2): 93–9. [DOI] [PMC free article] [PubMed] [Google Scholar]
- 30.Spencer D, Warfel T.. Card sorting: a definitive guide. Box Arrows 2004; 2. https://boxesandarrows.com/card-sorting-a-definitive-guide/ Accessed August 12, 2019. [Google Scholar]
- 31.Eccles DW, Arsal G.. The think aloud method: what is it and how do I use it? Qual Res Sport Exerc Health 2017; 9 (4): 514–31. [Google Scholar]
- 32.Brooks J, McCluskey S, Turley E, et al. The utility of template analysis in qualitative psychology research. Qual Res Psychol 2015; 12 (2): 202–24. [DOI] [PMC free article] [PubMed] [Google Scholar]
- 33.Creswell JW. Research Design: Qualitative, Quantitative, and Mixed Methods Approaches. 3rd ed. Thousand Oaks, CA: Sage; 2009. [Google Scholar]
- 34.Braun V, Clarke V.. Using thematic analysis in psychology. Qual Res Psychol 2006; 3 (2): 77–101. [Google Scholar]
- 35.Fraley C. How many clusters? Which clustering method? Answers via model-based cluster analysis. Comp J 1998; 41 (8): 578–88. [Google Scholar]
- 36.Salvador S, Chan P. Determining the number of clusters/segments in hierarchical clustering/segmentation algorithms. In: proceedings of the 16th IEEE International Conference on Tools with Artificial Intelligence; 2004: 576–84. doi: 10.1109/ICTAI.2004.50
- 37.Longueville BD, Smith RS, Luraschi G. “OMG, from here, I can see the flames!”: A use case of mining location based social networks to acquire spatio-temporal data on forest fires. In: proceedings of the 2009 International Workshop on Location Based Social Networks; 2009: 73–80.
- 38.Agency for Healthcare Research and Quality. Use case. https://digital.ahrq.gov/health-it-tools-and-resources/evaluation-resources/workflow-assessment-health-it-toolkit/all-workflow-tools/use-case Accessed August 12, 2019.
Associated Data
This section collects any data citations, data availability statements, or supplementary materials included in this article.