

Abstract
Background:
Many animal studies suggested that the uremic toxin indoxyl sulphate can add to renal damage following induced nephrotoxicity and this effect has not been proved in patients with such complication.
Methods:
This is a prospective, case-control, and an observational study conducted on 74 critically ill patients with acute nephrotoxicity. It was designed to measure serum levels of indoxyl sulphate on the day of enrollment and over the course of their illness using high performance liquid chromatography (HPLC-UV) and to test the correlation between these levels and patient’s demographics, clinical characteristics, physiological variables, and their outcomes.
Results:
Critically ill patients with acute nephrotoxicity had significantly higher total (tIS) and free (fIS) indoxyl sulphate than healthy controls and significantly lower than patients with end-stage renal disease (ESRD). Although, no correlation was found between tIS or fIS and mortality, among survivors, tIS, fIS, creatinine and eGFR were independently associated with no renal recovery.
Conclusion:
Serum indoxyl sulphate levels were elevated in critically ill patients with acute nephrotoxicity. There is an association between high levels of indoxyl sulphate and no renal-recovery outcome among survivors of acute nephrotoxicity. Early removal of indoxyl sulphate from patients’ blood may improve their outcomes.
Key Words: HPLC, Indoxyl sulphate, Mortality, Prognosis, Toxic acute kidney injury
Introduction
Acute kidney injury (AKI) is a common disorder in critical care medicine (CCM), characterized by an abrupt decrease in renal function with retention of body’s waste products and electrolyte disturbance (1-2). Toxins affecting the kidney are called nephrotoxins; are responsible for about 20% of hospital acquired AKIs hence the name toxic AKI. Nephrotoxins may be exogenous or endogenous; drugs, radiocontrast materials and environmental pollutants are the most common nephrotoxins encountered (3,4). AKI mechanisms differ according to the type of nephrotoxin. Nephrotoxins cause renal parenchymal damage, acute tubular necrosis, acute interstitial nephritis, or renal arterioles vasoconstriction and pre-renal ischemia (2,4). After AKI, renal function can be completely or partially recovered, or may be chronically lost, according to severity and time of injury and generation capacity of the kidneys (5-7). AKI is a major health problem accompanied by high resources utilization, with a growing interest in providing tools for early diagnosis and prognosis (8) and for achieving such goals, kidney structure and function should be linked by the gold standard; renal biopsy which is impractical in acutely ill patients, so novel renal imaging techniques and panels of biomarkers might help (9-13). AKI can be detected in line with RIFLE, or AKIN definitions (9,13,14).
When kidney function decreases, serum levels of some endogenous solutes were found to be elevated (5,7). Those interacting with biological functions were called uremic toxins and were classified into small water soluble, middle, and protein-bound toxins (15,16). Indoxyl sulphate (IS) is a small protein-bound uremic toxin synthetized in liver from indole, a sulphate conjugate of tryptophan produced by action of intestinal flora on dietary-derived proteins. Circulating IS is 90% bound to plasma proteins with a strong albumin binding at Sudlow II site and it is cleared from blood through renal proximal tubular secretion (17). Normal concentrations reported for free indoxyl sulphate (fIS) was 0.0- 0.2 µmol/l) and for total indoxyl sulphate (tIS) was 0.7- 6.3 µmol/l (18). High concentrations of IS were identified among elders, men and those with lower renal functions (19).
Survivors from AKI may suffer from adverse short-term renal outcomes, in the form of delayed renal recovery, dependence on renal replacement therapy, or progression to RIFLE stages L (Loss of kidney function) or E (End-stage renal disease). The increased levels of cytokines, uremic toxins and other circulating mediators may explain the adverse effects following AKI (7, 20-22).
In uremia, the role of the uremic toxin indoxyl sulphate (IS) was extensively studied and high levels were found to promote the progression to renal failure (23-25). Elevated IS levels were reported in animal models of AKI (26-27). Nevertheless, high IS levels were shown to add to tubular injury and delayed renal recovery through induction of tubulo-interstitial fibrosis and glomerular sclerosis, production of intra-renal free radicals, induction of oxidative stress in endothelial cells after injury (28, 29). Otherwise, the role of such toxin in patients with AKI is not yet understood.
The current study aimed at identifying serum levels and short-term predictive role of indoxyl sulphate in critically ill patients with toxic AKI.
Materials and Methods
Study cohort
This study was a prospective, case-control observational study conducted at Alexandria University hospital, Egypt, (March 2017 to January 2019) after approval of the Ethics Committee and obtaining written consents.
Study protocol
Selection of the studied population
This study was conducted on seventy-four patients in the critical care medicine (CCM) department diagnosed as toxic AKI (group I).
Patients were excluded from the study if; below 20 or above 60 years, pregnant, unable to give a written consent, with AKI due to other causes or combined causes, received renal replacement therapy (RRT) due to non-renal causes, or have a history of chronic kidney disease (CKD), liver disease or renal transplant.
Forty patients with end stage renal disease (ESRD), on maintenance hemodialysis for at least three months, were selected as controls (group II), in addition to forty healthy individuals as healthy control subjects (group III).
Controls were excluded if; not age matched (20-60 years), pregnant, had recent infection or recent intake of antibiotics or immunosuppressive agents.
Definition and staging of AKI
AKI was defined and staged according to abrupt and sustained (>24 hours) rise in serum creatinine level by 1.5-fold or more the baseline value, which is known in the last 6 months, and by a decrease in glomerular filtration rate (GFR) by 25% or more, as defined by RIFLE criteria (Table 1) (14).
Table 1.
RIFLE criteria for classification and prognostication of AKI.
| Stage | Serum Creatinine or Gfr | Urine Output |
|---|---|---|
| Risk (R) | Increase in serum creatinine 1.5 x of baseline or GFR decrease> 25% | < 0.5 ml/kg/h for> 6 consecutive hours |
| Injury (I) | Increase in serum creatinine 2 x of baseline or GFR decrease> 50% | < 0.5 ml/kg/h for>12 consecutive hours |
| Failure (F) | Increase in serum creatinine 3 x of baseline or increase in serum creatinine to≥ 354 µmol/L with an acute rise> 44 µmol/L or GFR decreased>75% | < 0.3 ml/kg/h for> 24 consecutive hours or anuria for 12 hours |
| Loss (L) | Persistent AKI= complete loss of kidney function> 4 weeks | |
| End-Stage Renal Disease (E) | ESRD> 3 months | |
GFR, glomerular filtration rate.
Staging of patients was based on the rise in serum creatinine and decrease in GFR and not on the urine output (12). A threshold value of serum creatinine was set at 150 µmol/L for men and 120 µmol/L for women beyond which it was considered as raised.
Defining the patients’ outcomes
Primary outcome will be mortality and secondary outcome will be no-renal recovery (in the form of partial renal recovery or on maintenance RRT).
Complete renal recovery was defined by fall of serum creatinine below threshold.
Partial renal recovery was defined by serum creatinine above threshold but not on maintenance RRT.
Estimated GFR (eGFR) was calculated for each patient using Modification of Diet in Renal Disease 4-variable (MDRD) formula.
eGFR (ml/min/1.73m2)= 186 x (Creatinine (µmol/l) /88.4)-1.154 x (age)-0.203 x 0.742 [if female] x 1.212 [if black]
Measurement of indoxyl sulphate (29-31) Sample collection and storage
Morning blood samples were withdrawn on serum separator tubes from group I patients within 48 hours after defining toxic AKI then followed by two serial measurements at week 1 and week 2 (or as ended earlier), from group II controls once just before dialysis, and from group III controls once at their routine laboratory visit, then serum was aliquoted and stored at -80 °C till analysis time.
2-naphthalenesulphonic acid (NSA) (0.2 mmol/L) was used as the internal standard, prepared in ultrapure water, and was stable for at least four weeks at 4 °C.
Sample preparation
For total indoxyl sulphate (tIS): serum was deproteinized by adding a double volume (1:2) of acetonitrile, vortex mixing for 1 minute, centrifuged at 14,049 G for 15 minutes, then supernatant was filtered by 0.22 mm filters to remove large particles, then 200 µl of NSA was added to each 600 µl of the prepared serum in a 2 ml auto-sampler tube vials.
For free indoxyl sulphate (fIS): ultrafiltrates were obtained from ultrafiltration of 500 µl of serum using Amicon ultra 0.5 centrifugal filter devices, 30 kDa (Milipore sigma, Taunton, USA), and this was facilitated by centrifugation at 14,049 G for 10 minutes at room temperature, then serum was deproteinized as was done for tIS.
2-naphthalenesulphonic acid (NSA) was used as the internal standard and was added after deproteinization because it was only water soluble.
High performance liquid chromatography (HPLC)
Chromatography was performed using a Waters separation module series 2690 with an autosampler, empower 3 software data station, and an UV/Visible Waters detector series 2489.
HPLC conditions were: Zorbax C18, 5 µm (4.6 x 250 mm) column (Agilent instruments, Wilmington, DE, USA), Mobile phase: an isocratic elution system was used as; 80% buffer A (Formic acid adjusted to pH 4 with ammonium hydroxide) and 20% acetonitrile. Run time was 8 minutes for tIS and 6 minutes for fIS. Injection volume was 10 µl for both tIS and fIS with flow rate maintained at 1 mL/min. Column temperature was 35 °C and the UV absorbance was monitored at 280 nm. Indoxyl sulphate peak was identified by superimposing the sulphate potassium salt in methanol. Peak heights of tIS were expressed as relative to the peak height of internal standard in order to obtain results independent of variations in sample size and detector sensitivity (Fig. 1).
Fig. 1.
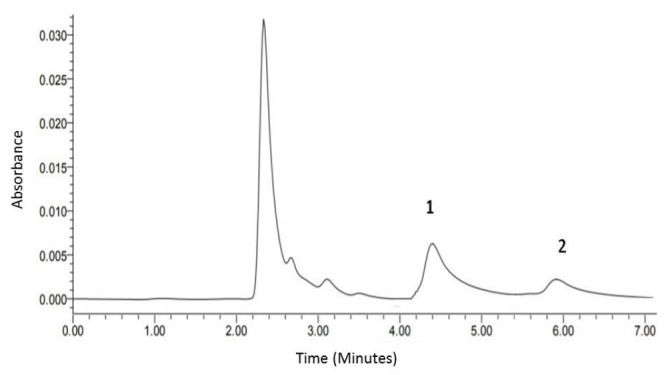
HPLC chromatogram of pooled normal serum spiked with 200 µmol/l 3-indoxyl sulphate potassium salt in methanol buffer (peak 1) and internal standard (peak 2). Under these conditions, tIS was eluted at ∼ 4.45 minutes, fIS at ∼ 4.5 minutes and the internal standard at ∼ 6 minutes. (N.B. These are mean elution times for total and free IS, as not all samples were analyzed in the same day).
Statistical analysis
All tests of significance were two-sided, and differences were considered significant when p value< 0.05.
Data were statistically analyzed and graphed using Graph Pad Prism 7 for windows.
Serum levels of tIS and fIS were highly skewed and then non-parametric statistics were used or they were log-transformed before inference testing.
Linear regression model analysis generalized linear model analysis, multivariable analysis, mixed effect models and binary logistic regression of models were analyzed using R version 3.5.2 (2018-12-20) -- "Eggshell Igloo".
The trends of tIS, fIS and creatinine over time were estimated using mixed-effect model which was selected based on Akaike’s information criterion.
Results
Patients’ characteristics
The demographics and clinical characteristics of patients with toxic AKI according to prognosis at hospital discharge are summarized in Table 2.
Table 2.
Demographics and clinical characteristics of patients with toxic AKI according to prognosis at hospital discharge.
| Demographics and clinical characteristics | Total N= 74 | Survivors N= 57 | p1 value | Non-survivors N= 17 | p2 value | |
|---|---|---|---|---|---|---|
| Recovery N= 36 | No-recovery N= 21 | |||||
| Age (years), median (range) | 59(20-60) | 59(21-60) | 60(22-60) | 0.443 a | 60(35-60) | 0.863a |
| Male, n (%) | 44(59.5) | 20(55.6) | 15(71.4) | 0.235b | 9(52.9) | 0.532b |
| Smokers, n (%) | 17(22.9) | 6(18.8) | 5(23.8) | 0.656b | 6(35.3) | 0.128b |
| Alcohol drinkers, n (%) | 4(5.4) | 1(3.1) | 2(9.5) | 0.324b | 1(5.8) | 0.001b |
| Hospital stays (days), median (range) | 11(2-70) | 14(3-70) | 10(3-30) | 0.111a | 12(2-30) | 0.096a |
| RIFLE criteria, n (%) | ||||||
| RIFLE class R | 15(20.3) | 13(36.1) | 1(4.8) | 0.025b | 1(5.9) | 0.020b |
| RIFLE class I | 28(37.8) | 12(33.3) | 12(57.2) | 4(23.5) | ||
| RIFLE class F | 31(41.9) | 11(30.6) | 8(38) | 12(70.6) | ||
| APACHE II score, mean (SD) | 17.8(7.8) | 16.6(6.2) | 16.6(5.8) | 0.890 c | 24(9.2) | < 0.001c |
| Renal replacement therapy (RRT), n (%) | 14(18.9) | 2(6.2) | 5(23.8) | 0.064b | 7(41.3) | 0.012b |
| Co-morbid conditions, n (%) | ||||||
| Diabetes mellitus | 25(33.8) | 11(30.6) | 7(33.3) | 0.937b | 8(47.1) | 0.330b |
| Cardiac disease | 46(62.1) | 24(66.7) | 11(52.4) | 0.398 b | 12(70.6) | 0.489 b |
| Pulmonary disease | 17(23) | 10(27.8) | 3(14.3) | 0.160 b | 5(29.4) | 0.685 b |
| Malignancy | 8(10.8) | 2(5.6) | 4(19) | 0.150 b | 2(11.8) | 0.960 b |
| End organ failure, n (%) | ||||||
| Sepsis | 5(7.1) | 3(9.4) | 0 | -- | 3(17.6) | 0.124b |
| DIC | 1(1.4) | 0 | 0 | -- | 1(5.9) | -- |
| Thrombosis | 2(2.8) | 2(6.3) | 0 | -- | 0 | -- |
| Mortality day, median (range) | 12(2-30 | |||||
| CCM mortality, n (%) | 14(82.4) | |||||
| 30-day mortality, n (%) | 17(100) | |||||
RIFLE criteria, (risk of renal dysfunction (R), injury to kidney (I), failure of kidney function (F), loss of kidney function (L), end-stage kidney disease (E); APACHE II score, Acute Physiology and Chronic Health Evaluation score; DIC, disseminated intravascular coagulation; CCM, critical care medicine; RIFLE class L, loss of kidney function> 4 weeks; RIFLE class E, End-stage renal disease (ESRD)>3 months; N; number of patients in each group. p1 value: between recovery and no-recovery groups. p2 value: between survivors and non-survivors.
Denotes p value derived from Mann-Whitney, (significant< 0.05).
Denotes p value derived from Chi-square test, (significant< 0.05).
Denotes p value derived from unpaired t-test, (significant< 0.05).
Defining outcomes
The patients' outcome at discharge and after 3 months follow up is outlined in Figure 2.
Fig. 2.
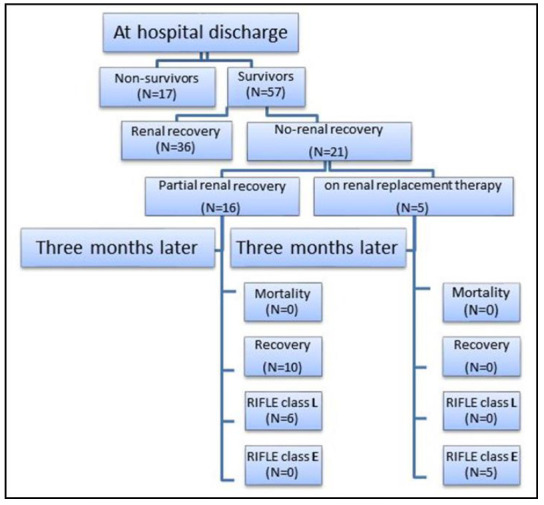
Flow chart of outcomes at hospital discharge and three months of follow up.
Basal serum indoxyl sulphate levels
The basal tIS and fIS levels measured in serum of critically ill patients with toxic AKI (group I) were significantly lower than those with ESRD (group II) (p< 0.0001) and significantly higher than those levels measured in serum of healthy controls (group III) (p< 0.0001) (Fig. 3).
Fig. 3.
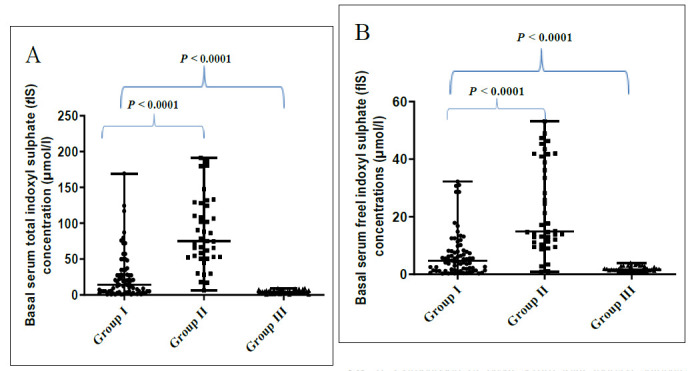
Comparison of basal serum total indoxyl sulphate (tIS) concentrations (A) and basal serum free indoxyl sulphate (fIS) concentrations (B) among the three studied groups. Data were analyzed using Kruskal-Wallis test between the all groups: p value is significant at< 0.05, and Klomogorov-Simirnov test between groups (I versus II) and (I versus III): p value is significant at< 0.05.
As summarized in Table 3; among the studied patients with toxic AKI, basal serum levels of both tIS and fIS showed significant positive correlations with each other (p< 0.0001), with serum creatinine (p< 0.0001 for both) and with BUN (p= 0.042 for tIS and p= 0.028 for fIS), and a significant negative correlation with eGFR (p< 0.0001 for both).
Table 3.
Correlations between both of basal serum levels of tIS and fIS and patients’ demographics and physiological variables among studied toxic AKI patients.
| Demographics and clinical characteristics | tIS (µmol/l) | fIS (µmol/l) |
|---|---|---|
| Age (years) | r= 0.044 | r= 0.037 |
| p= 0.708 | p= 0.753 | |
| APACHE II score | r= 0.123 | r= 0.153 |
| p= 0.293 | p= 0.191 | |
| Length of hospital stay (days) | r= 0.027 | r= -0.001 |
| p= 0.819 | p= 0.991 | |
| Laboratory data: | ||
| Serum creatinine (µmol/l) | r= 0.490 | r= 0.503 |
| p< 0.0001* | p< 0.0001* | |
| Blood urea nitrogen (mmol/l) | r= 0.236 | r= 0.254 |
| eGFR (ml/min/1.73m2) | p= 0.042* | p= 0.028* |
| r= -0.534 | r= -0.526 | |
| p< 0.0001* | = 0.0001* | |
| tIS (µmol/l) | ------ | r = 0.920 |
| p< 0.0001* | ||
tIS, total indoxyl sulphate; fIS, free indoxyl sulphate; eGFR, estimated glomerular filtration rat. Data were presented as spearman correlation coefficient r above and p value below, p significant at< 0.05.
As depicted in Figure 4; among patients with toxic AKI, basal serum levels of both tIS (p= 0.005) and fIS (p< 0.001) were significantly higher among patients who received RRT than among who did not.
Fig. 4.
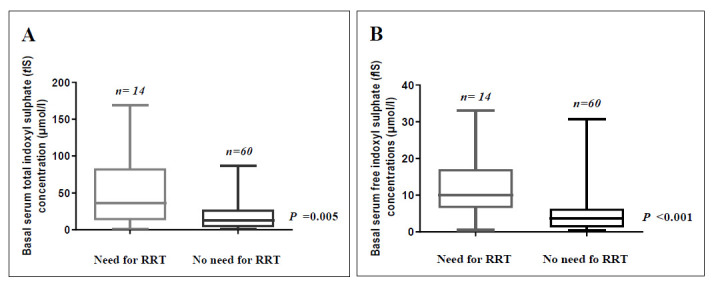
Basal serum total indoxyl sulphate (tIS) (A) and basal serum free indoxyl sulphate (fIS) (B) concentrations among patients with toxic AKI according to need for renal replacement therapy (RRT). Bars and error bars represent median and range for each group. Data were analyzed using Mann-Whitney test; p value is significant at< 0.05.
Basal serum levels of tIS and fIS showed statistically significant differences when compared among the studied patients with toxic AKI according to the RIFLE classes (p<0.001 and p= 0.002, respectively) (Fig. 5).
Fig. 5.
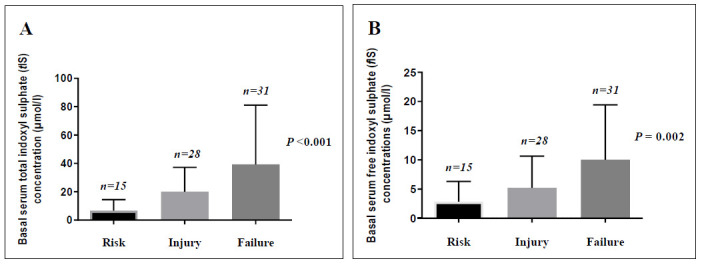
Basal serum total indoxyl sulphate (tIS) (A) and basal serum free indoxyl sulphate (fIS) concentrations (B) among patients with toxic AKI according to RIFLE classes. Bars and error bars represent median and range for each stage. Data were analyzed using Kruskal-Wallis test; P value is significant at< 0.05.
In this study, AKI was due to exogenous nephrotoxins in sixty-eight (91.9%) patients, while six patients (8.1%) had AKI due to endogenous nephrotoxins; light chains, myoglobin and high uric acid. Figure 6 shows the major causes of AKI among the studied groups and shows that basal serum levels of tIS and fIS did not differ significantly when compared among the studied patients with toxic AKI according to the most frequent nephrotoxins.
Fig. 6.
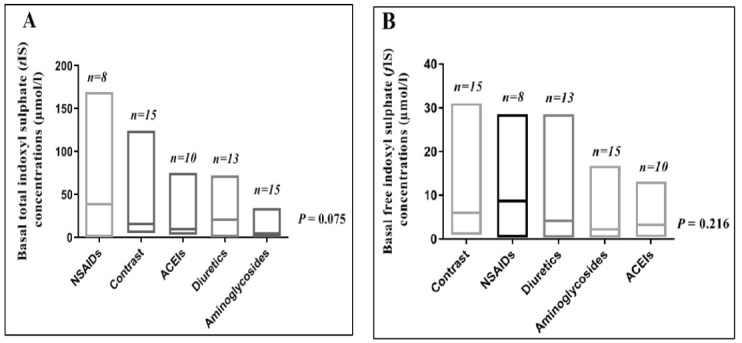
Basal serum total indoxyl sulphate (tIS) (A) and basal serum free indoxyl sulphate (fIS) (B) concentrations among patients with toxic AKI according to the nephrotoxin type. Bars represent range with line at median for each nephrotoxin. Data were analyzed using Kruskal-Wallis test; P value is significant at< 0.05.
What can indoxyl sulphate levels predict, mortality (primary outcome) or no recovery (secondary outcome) among patients of toxic AKI?
Patients’ basal laboratory data according to prognosis at hospital discharge are summarized in Table 4, where basal serum levels of creatinine were significantly higher and eGFR were significantly lower among no-recovery than among recovery groups (p= 0.003 and p= 0.001 respectively), and among non-survivors than among survivors (p= 0.047, p= 0.001 respectively). Moreover, basal serum levels of both tIS and fIS were significantly higher among no-recovery than among recovery groups (p= <0.001, p= 0.005 respectively), while there was no statistically significant difference in these levels among survivors and non-survivors.
Table 4.
Patients’ basal laboratory data according to prognosis at hospital discharge.
| Basal laboratory data | Survivors N= 57 | p1 value | Non-survivors N=17 | p2 value | |
|---|---|---|---|---|---|
| Recovery N= 36 | No-recovery N=21 | ||||
| Serum creatinine (µmol/l), mean (SD) | 249.1(141.2) | 462(83.7) | 0.003 a | 294.7(293.6) | 0.047a |
| BUN (mmol/l), mean (SD) | 39.4(50.5) | 24.6(10.5) | 0.096 a | 25.0(13.9) | 0.119a |
| eGFR (ml/min/1.73m2), mean (SD) | 40.4(14.9) | 24.8(12.4) | 0.001 a | 21.3(9.7) | 0.001a |
| Serum tIS (µmol/l), median (range) | 5.4(0.7-79.6) | 27.4(0.8-124) | <0.001b | 14(0.8-169) | 0.826b |
| Serum fS (µmol/l), median (range) | 2.5(0.3-30.7) | 6.4(0.4-33) | 0.005b | 5.5(0.4-23) | 0.876b |
BUN, blood urea nitrogen; eGFR, estimated glomerular filtration rate; tIS, total indoxyl sulphate; fIS, free indoxyl sulphate. p1 value: between recovery and no-recovery groups. p2 value: between survivors and non-survivors.
Denotes p value derived from unpaired t-test, (significant< 0.05).
Denotes p value derived from Mann-Whitney, (significant< 0.05)
Role of indoxyl sulphate as a predictor of no-recovery among survivors of toxic AKI
Using generalized linear models (GLM), neither age, sex, smoking, alcohol drinking, co-morbid conditions, BUN nor APACHE II score had significant association with no-recovery, while tIS, fIS, creatinine and eGFR were independently associated with no-recovery (p= 0.04, p= 0.04, p= 0.04, p= 0.01 respectively).
Using multiple variable analysis, both of tIS and fIS had no significant association with either of age, sex, smoking, alcohol drinking, co-morbid conditions, APACHE II score, creatinine, BUN or eGFR, while both of tIS and fIS have significant positive association with each other (p< 0.001), and significant negative association with the associated liver disease (p= 0.044 for tIS and p= 0.049 fIS).
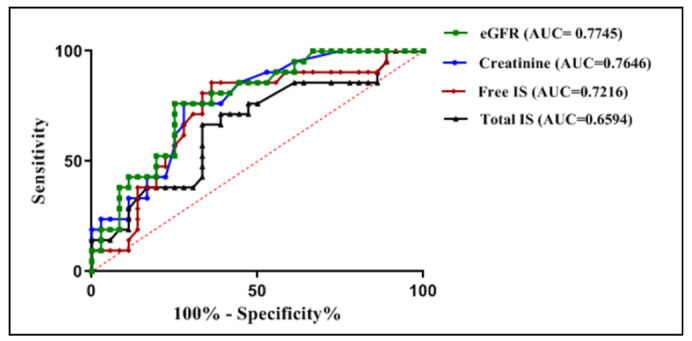
ROC curve analysis denoted cut-off values; for estimated glomerular filtration rate= 29.4 ml/min/1.73m2, for creatinine= 245 µmol/l, for tIS =13.25 µmol/l and for fIS= 4.0 µmol/l (Fig. 7).
Fig. 7.
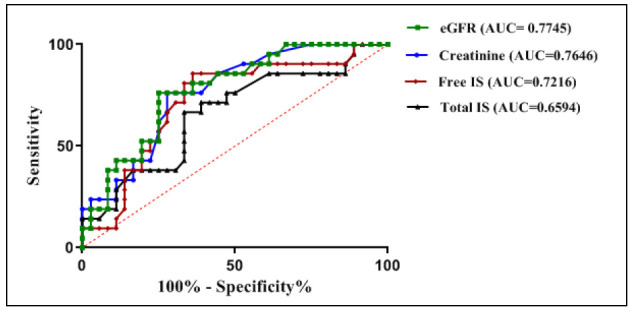
Receiver-operating characteristics (ROC) curve of weight for comparison of the performance of eGFR, creatinine, free IS and total IS in prediction of no-recovery among survivors of toxic AKI patients. The cut-off values were defined by calculating Youden index scores and were chosen as the closest scores to 1.
Based on the previous cut-off values, the positive predictive value for prediction of no-recovery among survivors of toxic AKI patients of creatinine, eGFR, fIS, and tIS were respectively 63%, 59%, 58% and 52%.
Using binary logistic regression of models as depicted in Figure 8, in model 2; tIS added a value of 0.0152 to the original model (model 1), while in model 3; fIS did not add any value to the original model, otherwise, in model 4; adding both tIS and fIS to the original model added a value of 0.0614.
Fig. 8.
Receiver-operating characteristics (ROC) curve of weight for comparison of models in prediction of no-recovery among survivors of patients with toxic AKI.
Model 1= creatinine + eGFR, AUC= 0.7785
Model 2= creatinine + eGFR + tIS, AUC= 0.7937
Model 3= creatinine + eGFR + fIS, AUC= 0.7778
Model 4= creatinine + eGFR + tIS + fIS, AUC= 0.8399
Changes of total and free indoxyl sulphate among survivors of toxic AKI patients over time
As presented in Table 5, serum levels of tIS and fIS over two weeks were significantly higher among no-recovery than among recovery groups (p< 0.001 and p< 0.004 respectively). Moreover, changes in serum levels of tIS and fIS over two weeks were significantly different when compared among recovery and no-recovery groups (p= 0.007 and p= 0.041 respectively).
Table 5.
Relationship of changes in serum levels of total and free indoxyl sulphate over two weeks to renal status at hospital discharge.
| Total N | pRecovery | No-recovery | pp value | |||
|---|---|---|---|---|---|---|
| N | N | |||||
| tIS (µmol/l) median (range) | <0.001a | |||||
| Basal | 57 | 36 | 5.4(0.7-79.6) | 21 | 27.4(0.8-124) | 0.006b |
| First week | 15 | 9 | 14.1(0.8-58.8) | 6 | 53.4(7.6-153) | |
| Second week | 7 | 3 | 30.8(0.8-35) | 4 | 51.4(19.9-61.2) | |
| fIS (µmol/l) median (range) | 0.004a | |||||
| Basal | 57 | 36 | 2.5(0.3-30.7) | 21 | 6.4(0.4-33.0) | |
| First week | 15 | 9 | 6.8(0.6-19.4) | 6 | 7.1(0.45-19.6) | 0.041b |
| Second week | 7 | 3 | 7.6(1.4-7.8) | 4 | 7.3(5.6-17.3) | |
tIS, total indoxyl sulphate; fIS, free indoxyl sulphate; N, number of patients at each point of time. Both of tIS and fIS had non-parametric distribution and were log transformed before analysis.
Denotes p value derived from linear regression model for comparison of each of tIS and fIS over two weeks among recovery and no-recovery groups, (significant< 0.05).
Denotes p value derived from mixed-effect model for changes in indoxyl sulphate concentrations over two weeks, (significant< 0.05).
Three months of follow up of the no-recovery group (N= 21)
After three months of follow up following hospital discharge, ten (47.6%) patients had renal recovery (recovery) and eleven (52.4%) patients did not have and were classified according to RIFLE classes into class L or class E (no-recovery).
As presented in Table 6; basal serum levels of creatinine, tIS and fIS were significantly higher and eGFR were significantly lower among the group with no-renal recovery than the group who had renal recovery (p= 0.043, p= 0.013, p= 0.019 and p< 0.0001 respectively).
Table 6.
Relationships between basal laboratory data and renal outcome (Secondary outcome) of no-recovery group after three months of follow up following hospital discharge.
| Basal laboratory data | Recovery N= 10 | No-recovery N= 11 | p value |
|---|---|---|---|
| Serum creatinine (µmol/l), mean (SD) | 425 (85) | 711 (410) | 0.043a |
| BUN (mmol/l), median (range) | 18.2 (12.1-40.3) | 27.8 (8.9-44.3) | 0.081b |
| eGFR (ml/min/1.73m2), mean (SD) | 33.4 (10.1) | 17.1 (8.64) | <0.001a |
| Serum tIS (µmol/l), median (range) | 20.45 (0.8-49.8) | 48.2 (3.1-6.2) | 0.013b |
| Serum fS (µmol/l), median (range) | 5.1 (0.4-13.1) | 9.8 (4.1-32) | 0.019b |
BUN, blood urea nitrogen; eGFR, estimated glomerular filtration rate; tIS, total indoxyl sulphate; fIS, free indoxyl sulphate.
Denotes p value derived from unpaired t-test (significant< 0.05).
Denotes p value derived from Mann-Whitney test (significant< 0.05).
Discussion
Despite of the reported significant role of high levels of indoxyl sulphate in in-vitro models of AKI, its in-vivo role is still obscure. In this study we observed that the IS levels were significantly higher in patients with toxic AKI than those measured in age and sex matched healthy subjects and were significantly lower than those measured in age and sex matched patients with ESRD. Those results matched with those reported by Veldman et al (2019) in a recent in-vivo study, on 194 patients admitted to intensive care unit with sepsis, as they found a significant increase in levels of IS in patients with sepsis who developed AKI than in those who did not, moreover, these levels were significantly lower than those measured in serum creatinine matched CKD patients (32).
Indoxyl sulphate levels were observed to correlate significantly with renal function in general population and in uremia (19,24,25). In accordance, among the studied toxic AKI patients, we proved that basal serum levels of tIS and fIS correlated significantly to the basal renal function.
An increased incidence of mortality was observed following AKI in critically ill patients (8,20,21). Similarly, the in-hospital mortalities were 31.4% and 70.6% in RIFLE class F which matched with the rates previously reported (14,33,34,35). In the current study, the non-survivors had significantly higher basal creatinine and significantly lower glomerular filtration rates, and 70.6% of them were classified as RIFLE class F with significantly different distribution of classes when compared to the survivors, besides, 41.3% of them needed RRT that differed significantly than the survivors. However, no significant difference was noticed in basal levels of either tIS or fIS among the two groups. Subsequently, severe AKI can be deduced to be a leading cause of death in the studied patients and indoxyl sulphate could not be considered as a predictor of mortality among such patients.
In uremia, indoxyl sulphate was linked to the morbidity following CKD (36-38). Despite of high rate of reversibility of AKI, increased morbidity was also observed, and it is a great health and money costing problem. Deterioration of renal functions and other end-organ failures may follow AKI and are still unexplainable. In the current study, we tried to raise an answer to the question; is the short-term exposure of the renal tissues to accumulating IS after AKI will affect the progression of renal disease and cause adverse renal outcomes? We observed among the survivors of toxic AKI that basal levels of creatinine, tIS and fIS were significantly higher and eGFR were significantly lower among no-recovery than among recovery groups at hospital discharge and changes in serum levels of tIS and fIS over two weeks were significantly different among such groups. Nevertheless, basal serum levels of tIS, fIS creatinine and eGFR were independent predictors of no-recovery. Moreover, basal serum levels of tIS and fIS were significantly lower among patients with associated liver disease than among those who had not. Besides, measurement of tIS, fIS, creatinine and eGFR at time of enrollment was more accurate in prediction of no-recovery than measuring creatinine and eGFR only. Moreover, after three months of follow up of the no-recovery group following hospital discharge, basal serum levels of creatinine, tIS and fIS were still significantly higher among no-recovery (RIFLE classes L and E) than among recovery outcomes. The results recently reported by Veldeman et al after studying patients with sepsis who developed AKI showed harmony with our observations whereas it was reported that basal levels of creatinine and IS measured in patients with sepsis who developed AKI were significantly higher among the group with unfavorable evolution than that with favorable one and changes in serum levels of creatinine and IS correlated significantly to the evolution in renal function (32).
Limitations to this study are First: the small sample size and so the numbers of followed up patients were progressively decreasing. Second, all patients were enrolled from one medical center. Third; causes of nephrotoxicity were heterogeneous and therefore, we could not assess the relation between indoxyl sulphate levels and the pathology of AKI. Fourth; We did not compare indoxyl sulphate levels in patients who were exposed to nephrotoxins and did not develop AKI to those who developed. Finally, in order to establish IS as a prognostic marker, its clinical significance must be validated further by researchers. We recommend future studies to investigate the role of IS in other AKI populations besides, the role of reduction of serum concentration of IS in improving clinical outcomes of AKI.
In conclusion, serum indoxyl sulphate levels were elevated in critically ill patients with toxic AKI and at time of diagnosis, and measurement of creatinine, eGFR, tIS and fIS together can be used as a model for early prediction of no-renal recovery outcome in patients with toxic AKI.
Acknowledgements
We appreciate the support from Eslam M. A. Abdelrahman from HPLC laboratory in Medical Research Center, Faculty of Medicine, University of Alexandria, Egypt.
References
- 1.Mehta RL, Pascual MT, Soroko S, Savage BR, Himmelfarb J, Ikizler TA, et al. Spectrum of acute renal failure in the intensive care unit: the PICARD experience. . Kidney Int. 2004;66(4):1613, 21. doi: 10.1111/j.1523-1755.2004.00927.x. [DOI] [PubMed] [Google Scholar]
- 2.Patzer L. Nephrotoxicity as a cause of acute kidney injury in children. . Pediatr Nephrol. 2008;23(12):2159, 73. doi: 10.1007/s00467-007-0721-x. [DOI] [PMC free article] [PubMed] [Google Scholar]
- 3.Jha C, Kamath SU, Dash S, Attur RP, Ramachandra L, Kallya RS. Ischemia-Modified Albumin, Creatinine, And Paraoxonase-1 Levels in Serum of Patients Undergoing Intravenous Contrast-Enhanced Computed Tomography and Its Association with Contrast-Induced Nephropathy. . Rep Biochem Mol Biol. . 2019;8(1):72, 78. [PMC free article] [PubMed] [Google Scholar]
- 4.Howse ML, Bell GM. Drugs and toxins that damage the kidney. . Medicine. . 2007;35(7):399–403. [Google Scholar]
- 5.Herget-Rosenthal S, Glorieux G, Jankowski J, Jankowski V. Uraemic toxins in acute kidney injury. . Semin Dial. . 2009;22(4):445–8. doi: 10.1111/j.1525-139X.2009.00598.x. [DOI] [PubMed] [Google Scholar]
- 6.Chawla LS. Acute kidney injury leading to chronic kidney disease and long-term outcomes of acute kidney injury: The best opportunity to mitigate acute kidney injury?. . Contrib Nephrol. 2011;174:182–190. doi: 10.1159/000329396. [DOI] [PubMed] [Google Scholar]
- 7.Okusa MD. The changing pattern of acute kidney injury: from one to multiple organ failure. . Contrib Nephrol. . 2010;165:153–158. doi: 10.1159/000313754. [DOI] [PubMed] [Google Scholar]
- 8.Schrier RW, Wang W, Pool B, Mitra A. Acute renal failure: definition, diagnosis, pathogenesis, and therapy. . J Clin Invest. . 2004;114(1):5–14. doi: 10.1172/JCI22353. [DOI] [PMC free article] [PubMed] [Google Scholar]
- 9.Devarajan P. Review: neutrophil gelatinase-associated lipocalin: a troponin-like biomarker for human acute kidney injury. . Nephrology (Carlton). . 2010;15(4):419–28. doi: 10.1111/j.1440-1797.2010.01317.x. [DOI] [PubMed] [Google Scholar]
- 10.Soto K1, Coelho S, Rodrigues B, Martins H, Frade F, Lopes S, et al. Cystatin C as a marker of acute kidney injury in the emergency department. . Clin J Am Soc Nephrol. 2010;5:1745–54. doi: 10.2215/CJN.00690110. [DOI] [PMC free article] [PubMed] [Google Scholar]
- 11.Bennett MR, Ravipati N, Ross G, Nguyen MT, Hirsch R, Beekman RH, et al. Using proteomics to identify preprocedural risk factors for contrast induced nephropathy. . Proteomics Clin Appl. 2008;2(7-8):1058–1064. doi: 10.1002/prca.200780141. [DOI] [PMC free article] [PubMed] [Google Scholar]
- 12.Portilla D, Dent C, Sugaya T, Nagothu KK, Kundi I, Moore P, et al. Liver fatty acid-binding protein as a biomarker of acute kidney injury after cardiac surgery. Kidney Int. . 2008;73(4):465–72. doi: 10.1038/sj.ki.5002721. [DOI] [PubMed] [Google Scholar]
- 13.Parikh CR, Mishra J, Thiessen-Philbrook H, Dursun B, Ma Q, Kelly C, et al. Urinary IL-18 is an early predictive biomarker of acute kidney injury after cardiac surgery. . Kidney Int. 2006;70:199–203. doi: 10.1038/sj.ki.5001527. [DOI] [PubMed] [Google Scholar]
- 14.Hoste EA, Kellum JA. RIFLE criteria provide robust assessment of kidney dysfunction and correlate with hospital mortality. . Crit Care Med. 2006;34(7):2016–7. doi: 10.1097/01.CCM.0000219374.43963.B5. [DOI] [PubMed] [Google Scholar]
- 15.Vanholder R, De Smet R, Glorieux G, Argilés A, Baurmeister U, Brunet P, et al. Review on uremic toxins: Classification, concentration, and interindividual variability. Kidney Int. 2003;63(5):1934–43. doi: 10.1046/j.1523-1755.2003.00924.x. [DOI] [PubMed] [Google Scholar]
- 16.Duranton F, Cohen G, Smet RD, Rodriguez M, Jankowski J, Vanholder R, et al. Normal and pathologic concentrations of uremic toxins. . J Am Soc Nephrol. . 2012;23(7):1258–70. doi: 10.1681/ASN.2011121175. [DOI] [PMC free article] [PubMed] [Google Scholar]
- 17.Leong SC, Sirich TL. Indoxyl Sulfate—Review of Toxicity and Therapeutic Strategies. . Toxins (Basel). . 2016;8(12):358. doi: 10.3390/toxins8120358. [DOI] [PMC free article] [PubMed] [Google Scholar]
- 18.Pretorius CJ, McWhinney BC, Sipinkoski B, Johnson LA, Rossi M, Campbell KL, et al. Reference ranges and biological variation of free and total serum indoxyl- and p-cresyl sulphate measured with a rapid UPLC fluorescence detection method. . Clin Chim Acta. 2013;419:122–126. doi: 10.1016/j.cca.2013.02.008. [DOI] [PubMed] [Google Scholar]
- 19.Viaene L, Thijs L, Jin Y, Liu Y, Gu Y, Meijers B, et al., editors. Heritability and clinical determinants of serum indoxyl sulphate and p-cresyl sulphate, candidate biomarkers of the human microbe enterotype. PloS ONE. . 2014;9(5):e79682. doi: 10.1371/journal.pone.0079682. [DOI] [PMC free article] [PubMed] [Google Scholar]
- 20.Lisowska-Myjak B. Serum and urinary biomarkers of acute kidney injury. . Blood Purif. . 2010;29(4):357–65. doi: 10.1159/000309421. [DOI] [PubMed] [Google Scholar]
- 21.Taylor J. Acute kidney injury. . Health Service Journal. . 2011. [Google Scholar]
- 22.Talaat A, Elshahawy E, El- Hammady A, El- Assal M, Abdullah S. Epidemiology, clinical characteristics and outcome of acute kidney injury in intensive care units in Egyptian patients. . Life Science Journal. 2014;11(7):220–224. [Google Scholar]
- 23.Lisowska-Myjak B. Uremic toxins and their effects on multiple organ systems. . Nephron Clin Pract. . 2014;128(3-4):303–11. doi: 10.1159/000369817. [DOI] [PubMed] [Google Scholar]
- 24.Nataatmadja M, Cho Y, Campbell K, Johnson DW. The Roles of Indoxyl Sulphate and p-Cresyl Sulphate in Patients with Chronic Kidney Disease: A Review of Therapeutic Options. . Chronic kidney disease. [Google Scholar]
- 25.Bartreto FC, Barreto DV, Liabeuf S, Meert N, Glorieuxet G, Temmar M, et al. Serum indoxyl sulphate is associated with vascular disease and mortality in chronic kidney disease patients. . Clin J Am Soc Nephrol. . 2009;4(10):1551–8. doi: 10.2215/CJN.03980609. [DOI] [PMC free article] [PubMed] [Google Scholar]
- 26.Wei Q, Xiao X, Fogle P, Dong Z. Changes in metabolic profiles during acute kidney injury and recovery following ischemia/reperfusion. . PLoS One. 2014;9(9):e106647. doi: 10.1371/journal.pone.0106647. [DOI] [PMC free article] [PubMed] [Google Scholar]
- 27.Zgoda-Pols JR, Chowhury S, Wirth M, Milburn MV, Alexander DC, Alton KB. Metabolomics analysis reveals elevation of 3-indoxyl sulphate in plasma and brain during chemically-induced acute kidney injury in mice: Investigations of nicotininc acid receptor agonists. . Toxicol Appl Pharmacol. 2011;255(1):48–56. doi: 10.1016/j.taap.2011.05.015. [DOI] [PubMed] [Google Scholar]
- 28.Shen WC, Liang CJ, Huang TM, Liu CW, Wang SH, Young GH, et al. Indoxyl sulfate enhances IL-1β-induced E-selectin expression in endothelial cells in acute kidney injury by the ROS/MAPKs/NFκB/AP-1 pathway. . Arch Toxicol. . 2016 ;90(11):2779–2792. doi: 10.1007/s00204-015-1652-0. [DOI] [PubMed] [Google Scholar]
- 29.Shu C, Chen X, Xia T, Zhang F, Gao S, Chen W. LC-MS/MS method for simultaneous determination of serum p-cresyl sulphate and indoxyl sulphate in patients undergoing peritoneal dialysis. . Biomed Chromatogr. . 2016;30:1782–1788. doi: 10.1002/bmc.3753. [DOI] [PubMed] [Google Scholar]
- 30.Arund J, Tanner R, Uhlin F, Fridolin I. Do only small uremic toxins, chromophores, contribute to the online dialysis dose monitoring by UV absorbance?. . Toxins (Basel). . 2012;4(10):849–861. doi: 10.3390/toxins4100849. [DOI] [PMC free article] [PubMed] [Google Scholar]
- 31.Lin CJ, Wu CJ, Pan CF, Chen YC, Sun FJ, Chen HH. Serum concentration of p-cresol and indoxyl sulfate in elderly hemodialysis patients. . International Journal of Gerontology. . 2011;5(2):80–83. [Google Scholar]
- 32.Veldman L, Vanmassenhove J, Van Biesen W, Massy ZA, Liabeuf S, Glorieux G, et al. Evolution of protein-bound uremic toxins indoxyl sulphate and p-cresyl sulate in acute kidney injury. . Int Urol Nephrol. . 2019;51(2):293–302. doi: 10.1007/s11255-018-2056-x. [DOI] [PubMed] [Google Scholar]
- 33.Ali T, Khan I, Simpson W, Prescott G, Townend J, Smith W, et al. Incidence and outcomes in acute kidney injury: a comprehensive population-based study. . J Am Soc Nephrol. . 2007;18(4):1292–8. doi: 10.1681/ASN.2006070756. [DOI] [PubMed] [Google Scholar]
- 34.Uchino S, Kellum JA, Bellomo R, Doig GS, Morimatsu H, Morgera S, et al. Acute renal failure in critically ill patients: a multinational, multicenter study. . JAMA. 2005;294(7):813–8. doi: 10.1001/jama.294.7.813. [DOI] [PubMed] [Google Scholar]
- 35.Thakar CV, Christianson A, Freyberg R, Almenoff P, Render ML. Incidence and outcomes of acute kidney injury in intensive care units: a Veterans Admistiration study. . Crit Care Med. . 2009;37(9):2552–8. doi: 10.1097/CCM.0b013e3181a5906f. [DOI] [PubMed] [Google Scholar]
- 36.Wu W, Hsu KH, Lee CC, Sun CY, Hsu HJ, Tsai CJ, et al. P-Cresyl sulphate and indoxyl sulphate predict progression of chronic kidney disease. . Nephrol Dial Transplant. . 2011;26(3):938–47. doi: 10.1093/ndt/gfq580. [DOI] [PMC free article] [PubMed] [Google Scholar]
- 37.Lida S, Kohono K, Yoshimora J, Ueda S, Usui M, Miyazaki H, et al. Carbonic-adsorbent AST-120 reduces overload of indoxyl sulphate and the plasma level of TGF-beta1 in patients with chronic renal failure. . Clin Exp Nephrol. . 2006;10(4):262–7. doi: 10.1007/s10157-006-0441-8. [DOI] [PubMed] [Google Scholar]
- 38.Akizawa T, Asano Y, Morita S, Wakita T, Onishi Y, Fukuhara S, et al. Effect of carbonaceous oral adsorbent on the progression of CKD: a multicenter, randomized, controlled trial. . Am J Kidney Dis. 2009;54(3):459–467. doi: 10.1053/j.ajkd.2009.05.011. [DOI] [PubMed] [Google Scholar]