

Abstract
Objective:
Despite improvements in treatment, stroke remains a leading cause of mortality and long-term disability. In this study, we leveraged administrative data to build predictive models of short- and long-term post-stroke all-cause-mortality.
Methods:
The study was conducted and reported according to the Transparent Reporting of a multivariable prediction model for Individual Prognosis Or Diagnosis (TRIPOD) guideline. We used patient-level data from electronic health records, three algorithms, and six prediction windows to develop models for post-stroke mortality.
Results:
We included 7,144 patients from which 5,347 had survived their ischemic stroke after two years. The proportion of mortality was between 8%(605/7,144) within 1-month, to 25%(1,797/7,144) for the 2-years window. The three most common comorbidities were hypertension, dyslipidemia, and diabetes. The best Area Under the ROC curve(AUROC) was reached with the Random Forest model at 0.82 for the 1-month prediction window. The negative predictive value(NPV) was highest for the shorter prediction windows – 0.91 for the 1-month – and the best positive predictive value(PPV) was reached for the 6-months prediction window at 0.92. Age, hemoglobin levels, and body mass index were the top associated factors. Laboratory variables had higher importance when compared to past medical history and comorbidities. Hypercoagulation state, smoking, and end-stage renal disease were more strongly associated with long-term mortality.
Conclusion:
All the selected algorithms could be trained to predict the short and long-term mortality after stroke. The factors associated with mortality differed depending on the prediction window. Our classifier highlighted the importance of controlling risk factors, as indicated by laboratory measures.
Keywords: Ischemic Stroke, Mortality, Outcome Prediction, Machine Learning, Artificial Intelligence, EHR, Electronic Health Record
1. Introduction:
Despite improvements in treatment, stroke remains a leading cause of mortality and long-term disability.1,2 Post-stroke risk of death is the highest within the first 30 days while average mortality is reported at a rate of 10% per year thereafter.3,4 Patient prognosis can potentially help healthcare providers individualize aggressive treatment or palliative approach based on predicted life expectancy and clinical trajectory. Optimal allocation of available resources is fundamental to the provision of health care.5,6
Current stroke prognostic models vary widely in quality,7 while prediction models of post-stroke mortality to date are limited by their sample size, breadth of clinical variables, and overall clinical utility; many of such studies also lack basic reporting standards.8–10 Nonetheless, an abundance of overlooked patient-related information exists in electronic health records (EHR) that can, in part, facilitate the prediction of patients’ prognosis.11 Machine-learning (ML)-enabled algorithms can help close the care gap by extracting insights from the data that is readily available in EHRs. By leveraging the data and the technologies, assistive tools can be designed to support an actionable plan tailored for each patient, improving patients’ outcomes, experience and optimize the healthcare resources.12
Herein, we aimed to leverage data from EHR and interpretable ML algorithms to build prediction models for short and long-term mortality after an acute ischemic stroke (AIS). We further aimed to identify associated factors and their importance that could potentially be targeted in establishing more personalized management.
2. Method:
The study was conducted and reported according to the transparent reporting of a multivariable prediction model for individual prognosis or diagnosis (TRIPOD) guideline.13 The Supplemental Material includes the TRIPOD checklist for prediction model development and validation.
2.1. Data
Database description and processing:
This study was based on the extracted data, from September 2003 to May 2019, from the Geisinger’s Electronic Health Record (EHR) system, Geisinger Quality database, and the Social Security Death database to build a stroke registry called “Geisinger NeuroScience Ischemic Stroke (GNSIS)”.14,15 This study was based on 37 features – complete list of variables is provided in the Supplemental Material. The study was reviewed and approved by the Geisinger Institutional Review Board to meet “Non-human subject research”, for using de-identified information.
Data pre-processing:
Units were verified and reconciled if needed and distributions of variables were assessed over time to ensure data stability. The range for the variables was defined according to expert knowledge and available literature—and outliers were assessed and removed. Quantitative laboratory variables for each patient were based on the last observation before, or first observation after the index date (date of ischemic stroke), within a 3 year window, whichever was closest. Collinearity among quantitative variables was assessed using the Pearson correlation. Filters were applied to ensure that relevant variables were captured within the desired time-frame, and order of events was maintained. Data from inpatient, outpatient and emergency department encounters were included to ensure the comprehensiveness of follow-up data. The last encounter of the patients was recorded to ensure that the patients were active. In cases of multiple ischemic stroke events, the first event date was considered the index date. The National Institute of Health Stroke Scale (NIHSS) was extracted from the quality data and merged with the de-identified data. Lastly, a manual validation of 125 random patients in GNSIS was done via manual chart review and brain MRI imaging which indicated a specificity of 100% for the diagnosis of acute ischemic stroke. The details of data extraction and pre-processing have previously been published.14,15
2.2. Data Availability
The patient-level data analyzed in this study may be shared with a third party upon execution of data sharing agreement for reasonable requests. All the codes can be found at: https://github.com/TheDecodeLab/GNSIS_v1.0/tree/master/ModelingStrokeMortality
2.3. Study Population:
Patients were included in the study if they were at least 18 years old, they had a discharge diagnosis of ischemic stroke, brain MRI during their encounter, and an encounter duration of 24 hours or more. For this study, patients were excluded if we could not confirm all-cause mortality within two years or confirm “alive status” more than two years after the index stroke. Figure 1A summarizes the seven different groups created for this study.
Figure 1.
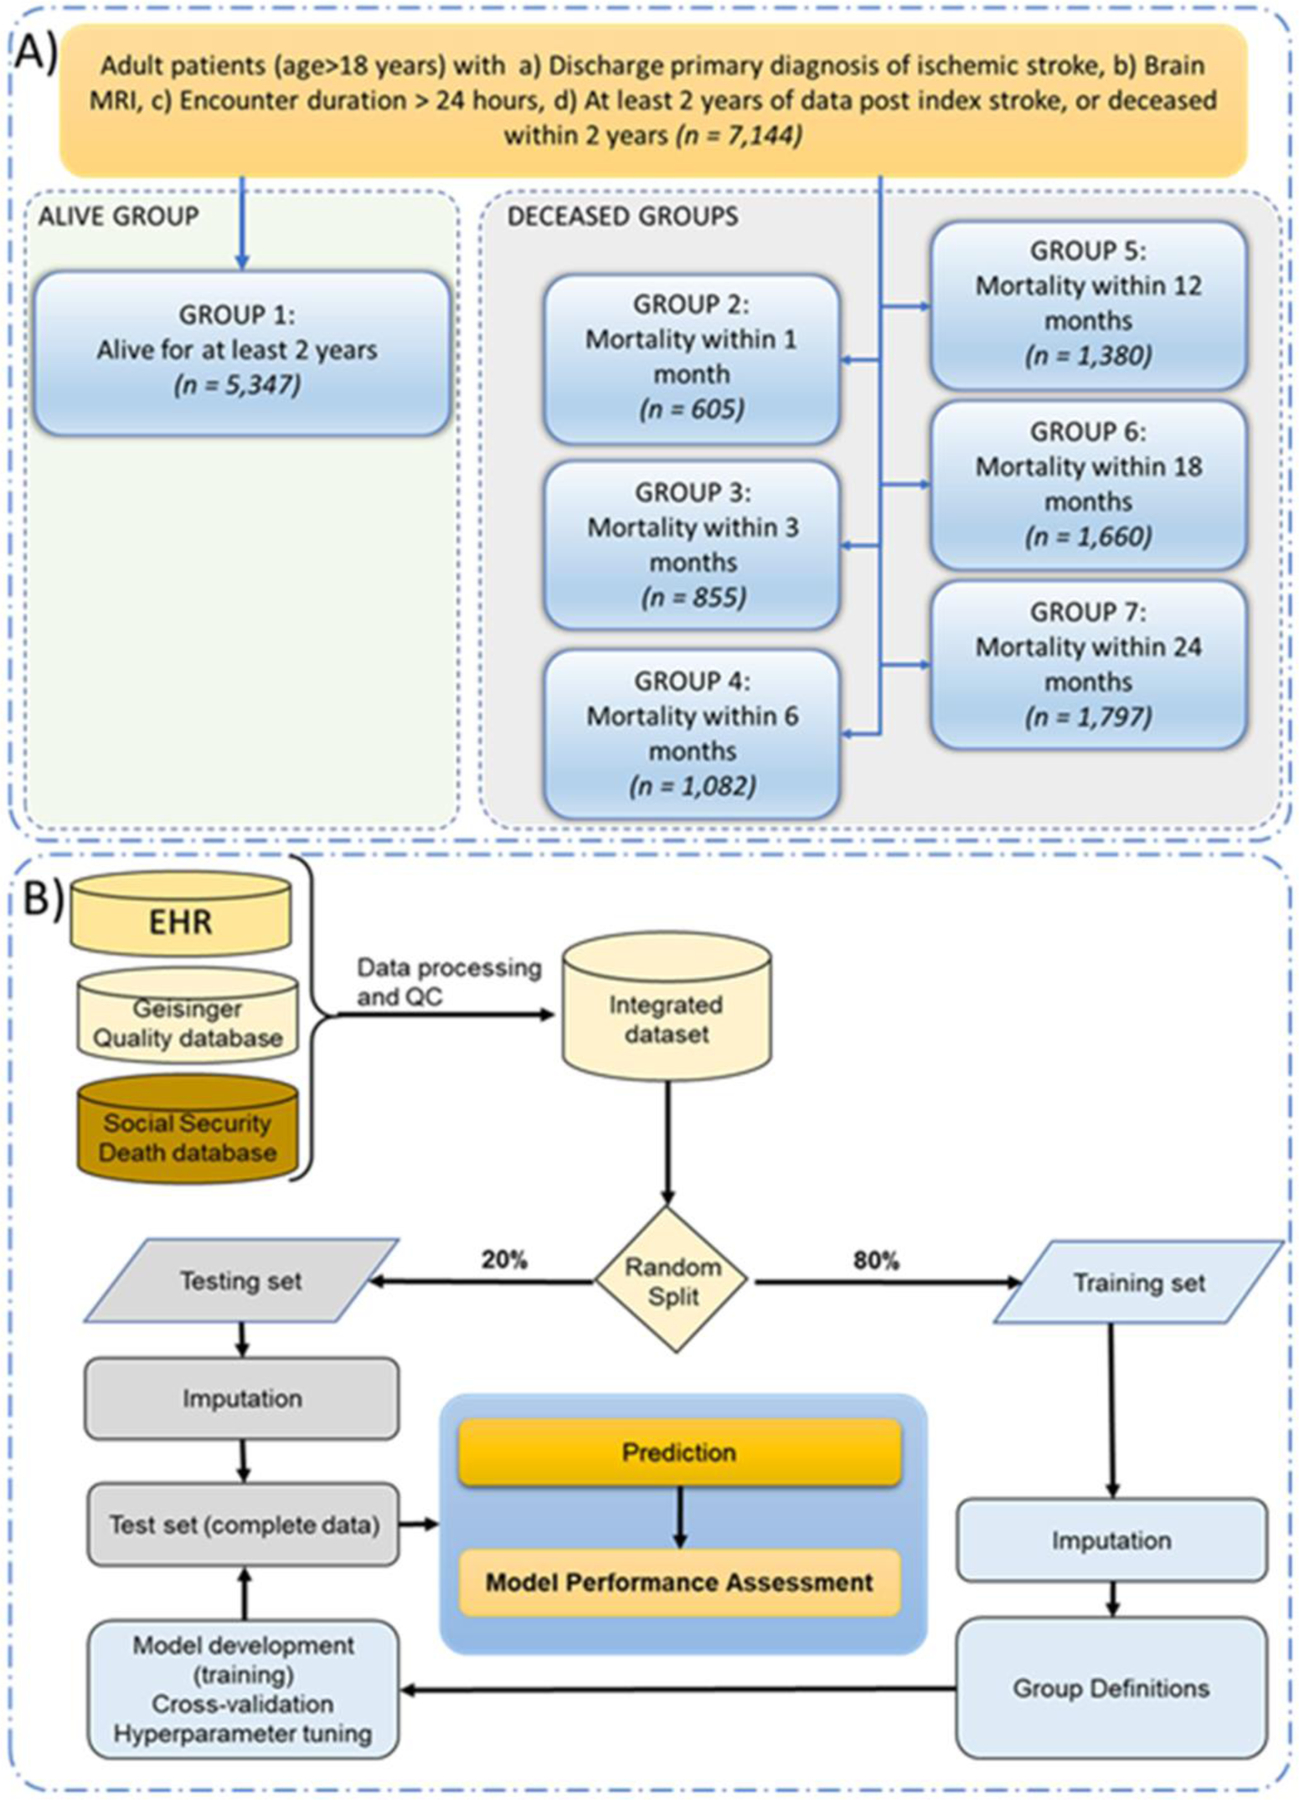
Study population (Panel A) and model development pipeline (Panel B).
2.4. Data processing
Training-testing set.
The dataset was randomly split into an 80:20 training and testing set.
Imputation.
A total of 37 features including demographic data, past medical history, laboratory data, and family history were used in this study. We also assessed the availability of the National Institutes of Health Stroke Scale(NIHSS). Table 1 includes data on the missingness percentage for different features. Imputation was performed separately on training and testing sets using the MICE(Multivariate Imputation by Chained Equations) package,16 for all the variables except the NIHSS; the latter had 78.9% missingness and was excluded from modeling. The quality of the imputations was examined using t-test, summary statistics, as well as strip and density plots of the missing features to ensure distribution of the variables was comparable before and after imputation. We have previously shown that for missingness in the range in this study MICE is an adequate choice for EHR data.17
Table 1.
Patient demographics, past medical and family history in different groups.
| Patient characteristics | % missing | Alive group | Deceased groups | P-value (Alive vs. 24 months) | |||||
|---|---|---|---|---|---|---|---|---|---|
| 1-month | 3-months | 6-months | 12-months | 18-months | 24-months | ||||
| Total patients | 5347 | 605 | 855 | 1082 | 1380 | 1606 | 1797 | <0.001 | |
| Age in years, mean(SD) | 68(13) | 77(13) | 77(12) | 77(12) | 77(12) | 77(12) | 77(11) | <0.001 | |
| Female, n(%) | 2518(47%) | 302(50%) | 442(52%) | 563(52%) | 718(52%) | 839(52%) | 935(52%) | <0.001 | |
| Body mass index in kg/m2, mean(SD) | 7.3% | 30(7) | 27(7) | 27(7) | 27(7) | 27(7) | 27(7) | 27(7) | <0.001 |
| Diastolic Blood Pressure, mean(SD) | 32.1% | 75(12) | 71(13) | 71(13) | 72(13) | 71(13) | 72(13) | 72(13) | 0.0032 |
| Systolic Blood Pressure, mean(SD) | 32.1% | 137(23) | 135(24) | 135(24) | 135(24) | 134(24) | 135(24) | 135(24) | <0.001 |
| Creatinine (Unit: mg/dL), mean(SD) | 4.7% | 1.02(0.56) | 1.22(0.84) | 1.23(0.95) | 1.26(0.97) | 1.27(0.97) | 1.27(0.96) | 1.28(0.99) | <0.001 |
| Current smoker, n(%) | 796(15%) | 63(10%) | 88(10%) | 115(11%) | 150(11%) | 179(11%) | 204(11%) | <0.001 | |
| Hemoglobin (Unit:g/dL), mean(SD) | 2.5% | 13.77(1.78) | 12.89(2.27) | 12.75(2.24) | 12.68(2.20) | 12.67(2.14) | 12.70(2.11) | 12.71(2.11) | <0.001 |
| Hemoglobin A1c (Unit: %), mean(SD) | 26.4% | 6.56(1.71) | 6.40(1.52) | 6.44(1.55) | 6.43(1.53) | 6.43(1.52) | 6.45(1.54) | 6.48(1.57) | 0.8801 |
| With insurance, n(%) | - | 5189(97%) | 579(96%) | 818(96%) | 1036(96%) | 1327(96%) | 1548(96%) | 1732(96%) | 0.1874 |
| Low-density lipoprotein (Unit: mg/dL), mean(SD) | 9.6% | 102(40) | 89(41) | 88(40) | 88(40) | 88(40) | 89(41) | 89(41) | <0.001 |
| Platelet count (Unit: 103/uL), mean(SD) | 2.6% | 232(77) | 227(101) | 227(100) | 226(100) | 226(100) | 227(100) | 227(98) | <0.001 |
| National Institutes of Health Stroke Scale (NIHSS), median[IQR] | 78.9% | 3[2–6] | 11[4–20] | 9[3–19] | 7[3–17] | 6[3–15] | 6[3–14] | 5[3–13] | <0.001 |
| Medical history, n(%) | |||||||||
| Atrial fibrillation /flutter | 986(18%) | 214(35%) | 301(35%) | 387(36%) | 467(34%) | 532(33%) | 587(33%) | <0.001 | |
| Alcohol dependence | 240(4%) | 23(4%) | 27(3%) | 35(3%) | 47(3%) | 54(3%) | 62(3%) | 0.0680 | |
| Alteplase therapy | 308(6%) | 39(6%) | 54(6%) | 68(6%) | 83(6%) | 94(6%) | 98(5%) | 0.6694 | |
| Congestive heart failure | 519(10%) | 154(25%) | 224(26%) | 286(26%) | 364(26%) | 432(27%) | 477(27%) | <0.001 | |
| Chronic kidney disease | 741(14%) | 168(28%) | 240(28%) | 315(29%) | 425(31%) | 498(31%) | 556(31%) | <0.001 | |
| Chronic liver disease | 145(3%) | 19(3%) | 25(3%) | 31(3%) | 40(3%) | 52(3%) | 56(3%) | 0.4152 | |
| Chronic lung diseases | 1032(19%) | 143(24%) | 211(25%) | 273(25%) | 357(26%) | 429(27%) | 479(27%) | <0.001 | |
| Cirrhosis | 25(<1%) | 8(<1%) | 11(<1%) | 14(<1%) | 18(<1%) | 23(<1%) | 24(<1%) | <0.001 | |
| Diabetes | 1667(31%) | 188(31%) | 277(32%) | 359(33%) | 475(34%) | 569(35%) | 646(36%) | <0.001 | |
| Dyslipidemia | 3354(63%) | 316(52%) | 463(54%) | 602(56%) | 801(58%) | 942(59%) | 1065(59%) | 0.0097 | |
| Epilepsy | 146(3%) | 29(5%) | 38(4%) | 49(5%) | 60(4%) | 67(4%) | 74(4%) | 0.0042 | |
| End-stage renal disease | 33(<1%) | 16(3%) | 27(3%) | 40(4%) | 53(4%) | 62(4%) | 74(4%) | <0.001 | |
| Hypercoagulable state | 63(1%) | 5(1%) | 8(1%) | 16(1%) | 23(2%) | 30(2%) | 32(2%) | 0.0703 | |
| Hypertension | 3974(74%) | 443(73%) | 628(73%) | 812(75%) | 1051(76%) | 1233(77%) | 1394(78%) | 0.0064 | |
| Myocardial infarction | 530(10%) | 124(20%) | 159(19%) | 195(18%) | 247(18%) | 281(17%) | 311(17%) | <0.001 | |
| Migraine | 263(5%) | 8(1%) | 14(2%) | 17(2%) | 24(2%) | 29(2%) | 35(2%) | <0.001 | |
| Mood disorder | 1282(24%) | 132(22%) | 196(23%) | 259(24%) | 352(26%) | 417(26%) | 466(26%) | 0.1016 | |
| Neoplasm | 690(13%) | 127(21%) | 215(25%) | 276(26%) | 358(26%) | 423(26%) | 462(26%) | <0.001 | |
| Peripheral vascular disease | 781(15%) | 102(17%) | 152(18%) | 208(19%) | 284(21%) | 339(21%) | 381(21%) | <0.001 | |
| Patent foramen ovale | 503(9%) | 14(2%) | 24(3%) | 33(3%) | 45(3%) | 60(4%) | 72(4%) | <0.001 | |
| Rheumatologic disease | 188(4%) | 24(4%) | 42(5%) | 58(5%) | 81(6%) | 91(6%) | 102(6%) | <0.001 | |
| Syncope | 300(6%) | 56(9%) | 85(10%) | 107(10%) | 146(11%) | 177(11%) | 204(11%) | <0.001 | |
| Thrombectomy | 45(1%) | 46(8%) | 56(7%) | 62(6%) | 63(5%) | 66(4%) | 70(4%) | <0.001 | |
| Family History, n (%) | |||||||||
| Heart disease | 2044(38%) | 149(25%) | 218(25%) | 291(27%) | 394(29%) | 474(30%) | 542(30%) | <0.001 | |
| Stroke | 783(15%) | 51(8%) | 69(8%) | 88(8%) | 126(9%) | 153(10%) | 184(10%) | <0.001 | |
2.5. Model development, validation, and testing
For this study, we split the data for each of the six designs into a training(80%) and testing set (20%). We used three different algorithms to develop a classification model for six prediction windows. All the 37 features were included in the model development. The algorithms in this study included Logistic Regression(LR),18 extreme gradient boosting(XGB),19 and Random Forest(RF).20 We have previously successfully used XGB,21–23 RF,22,23 and LR22,23 for EHR-based modeling. We used RF, and LR as these could provide benchmarking metrics as well as better flexibility in terms of implementation into cloud-based EHR vendors. A parameter grid was built to train the model with 5-fold repeated cross-validation(CV) with 10 repeats. Model tuning was performed by an automatic grid search with 10 different values to try for each algorithm parameter randomly. For each model, we used 20% of the data for model testing and calculated positive predictive value(PPV), negative predictive value(NPV), AUROC, and model accuracy. The modeling pipeline is summarized in Figure 1B.
3. Results
3.1. Patient characteristics
A total of 7,144 patients met the inclusion criteria, from which 5,347 had survived their stroke after two years while 605 patients died within 1 month, 1,380 within 1 year, and 1,797 within 2 years. Table 1 includes the patients’ demographics and clinical characteristics. In inferential statistical analysis, there was a significant difference between the patients who died before or survived after two years in terms of age, body mass index(BMI), many of the included laboratory variables and comorbidities, and family history of heart disease and stroke(Table 1). Collinearity, assessed using the Pearson correlation, did not show a high correlation among the quantitative features (Figure S1).
3.2. Prediction of the post-stroke mortality
In total, 18 models of post-stroke mortality were built. All three ML models were able to predict short- and long-term mortality after ischemic stroke. The average model AUROC on the testing dataset varied from 0.76 to 0.81. The RF-based model at 1-month reached the best performance (AUROC=0.82). The negative predictive value (NPV) was highest for the shorter prediction window(best NPV was 0.91 with XGB for the 1-month). The positive predictive value (PPV) was highest for the 6-month window with the RF model(0.92); while model accuracy was highest for the shorter prediction window (best model is based on XGB with an accuracy of 0.89, 1-month window) and decreases monotonically as the prediction window increases. Figure 2 illustrates the models’ performance and Supplemental Material includes the details of performance metrics. Model performance, in terms of AUROC, applied to the test and train datasets were comparable. The Supplemental Material summarizes the model parameters for the best performing model during model training using the 5-fold cross-validation design.
Figure 2.
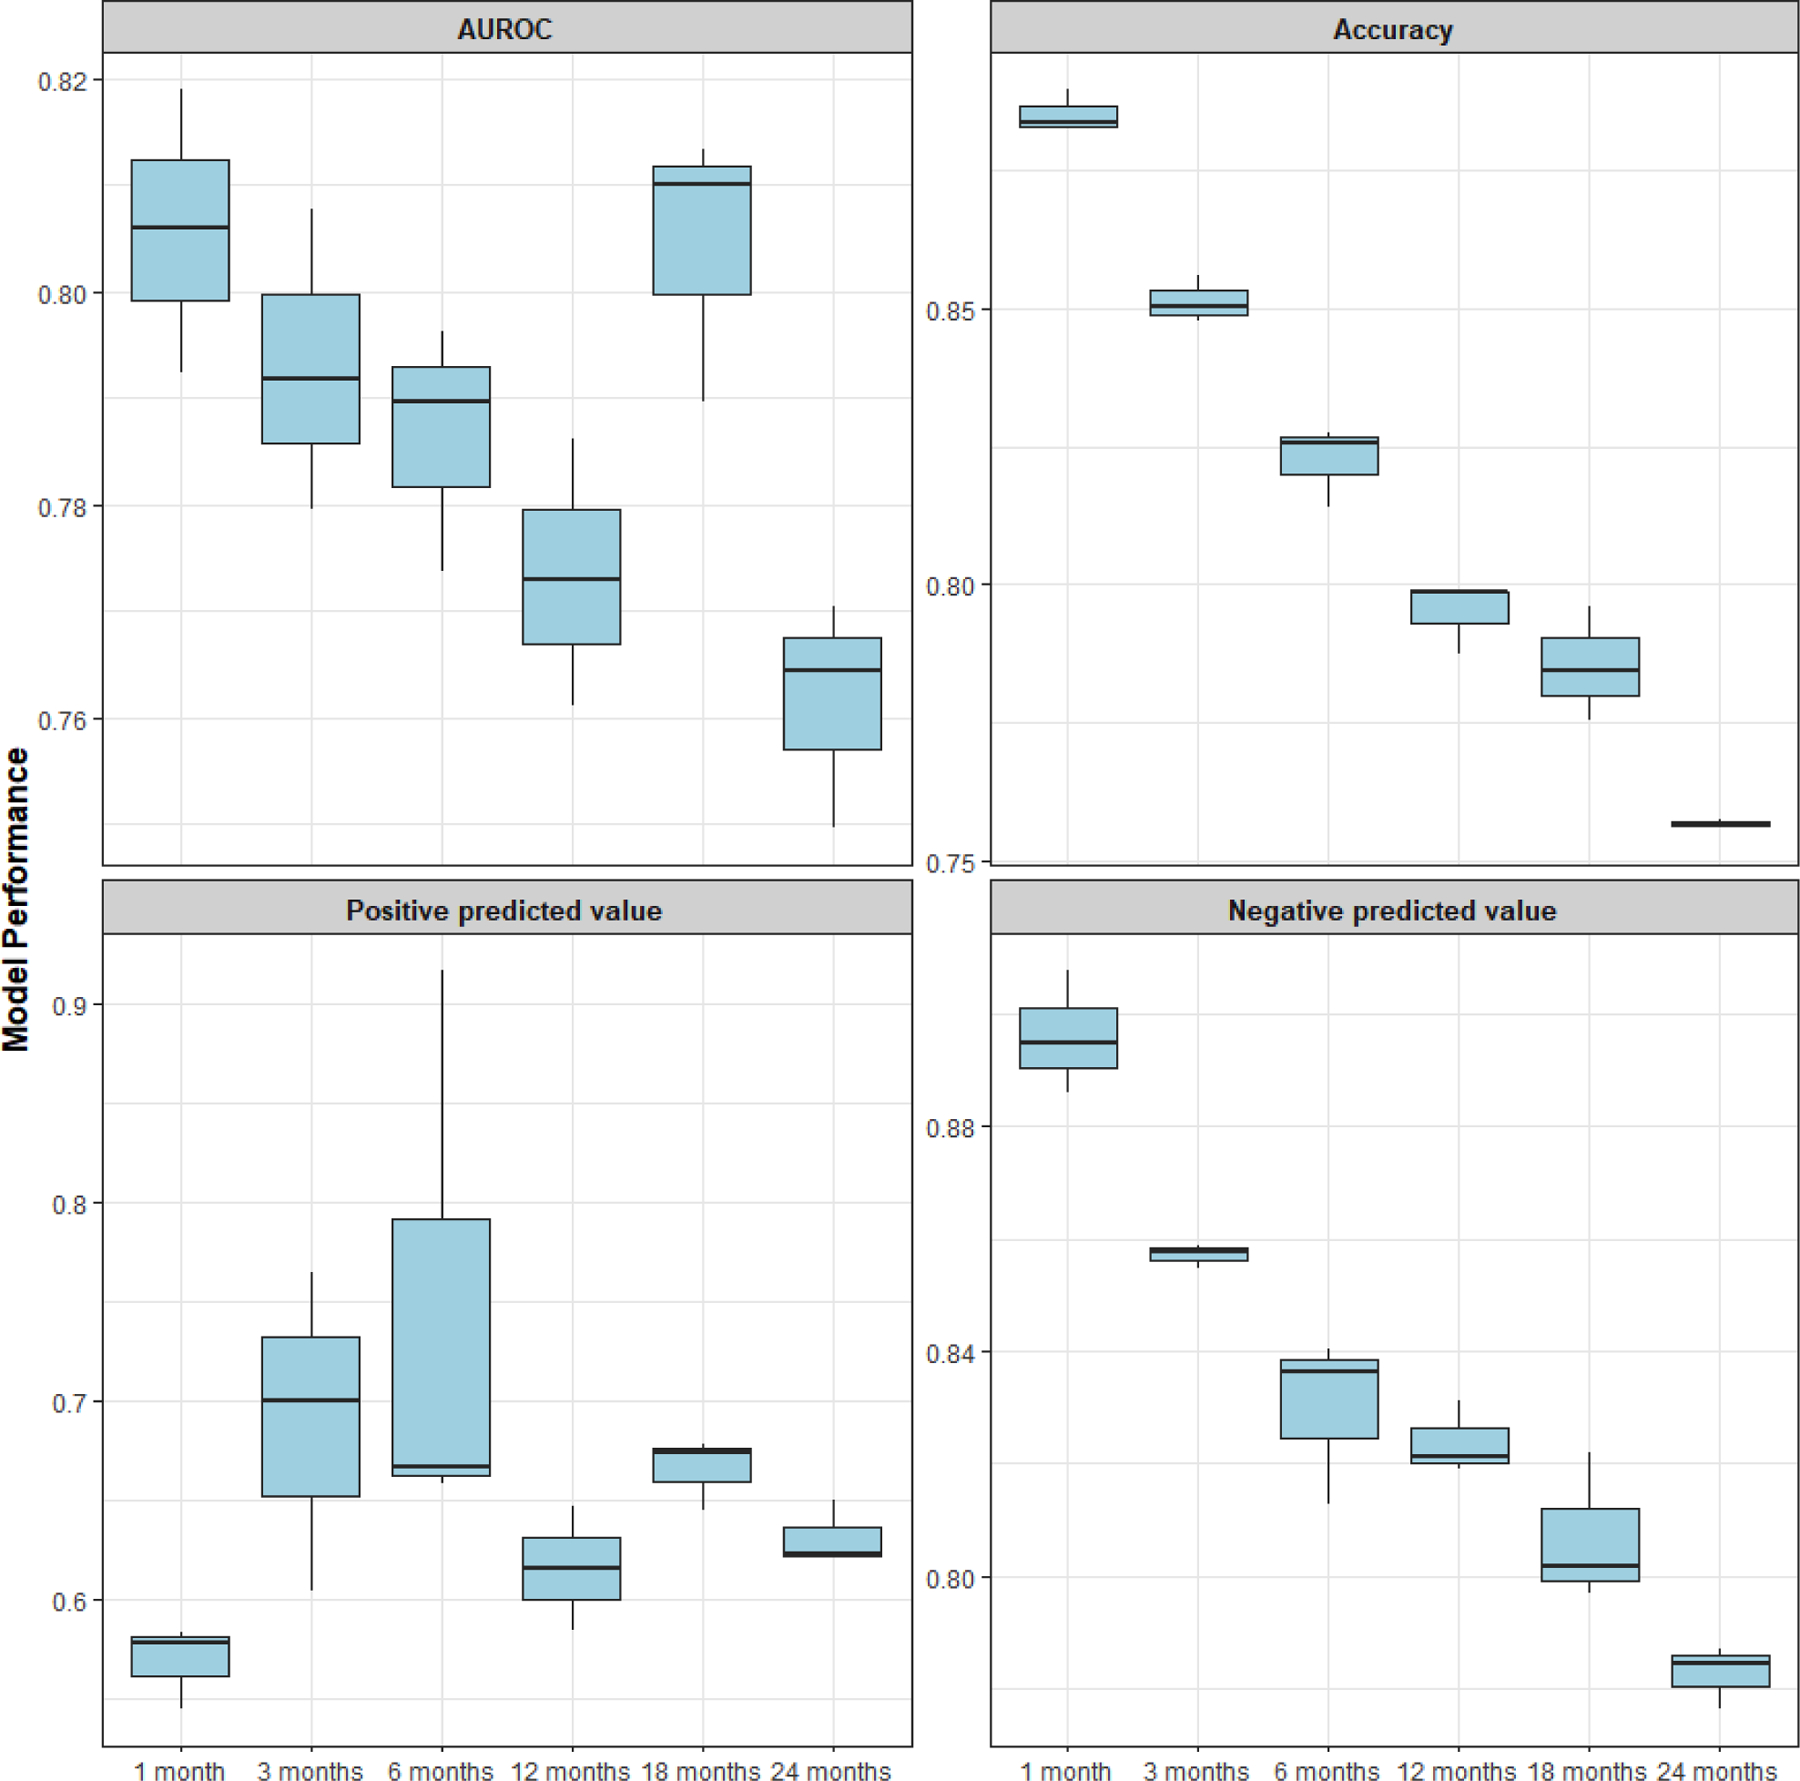
Average model performance for the 18 models of post-stroke all-cause mortality.
3.3. Clinical factors associated with post-stroke mortality
This study was designed using interpretable machine learning models. Clinical factors associated with the best model performance were extracted for the different models. Overall, results from the analysis corroborated that age, hemoglobin levels, and BMI are the top three associated factors across the different prediction windows with average overall importance at 96.3%, 68.2%, and 55.5% respectively. Results also highlighted that in general, many of the laboratory variables had higher importance when compared to the past medical history and comorbidities. Some variables had a higher association with long-term mortality while others were associated more strongly with shorter-term mortality. For instance, hypercoagulation state(feature importance: 14% at 18-months, 0.5% at 1-month) and smoking(feature importance: 2% at 1-month, 9% at 18-months) had stronger association with long-term mortality. On the other hand, thrombectomy (feature importance: 54% at 1-month, 33% at 24-months), platelet levels (feature importance: 43% at 3-month, 32% at 24-months), and diastolic blood pressure (feature importance: 34% at 3-month, 20% at 18-months) were more strongly associated with shorter terms mortality. Figure 3 illustrates the feature importance and Supplemental Material includes the relative values for the six prediction windows, averaged for the three ML models.
Figure 3.
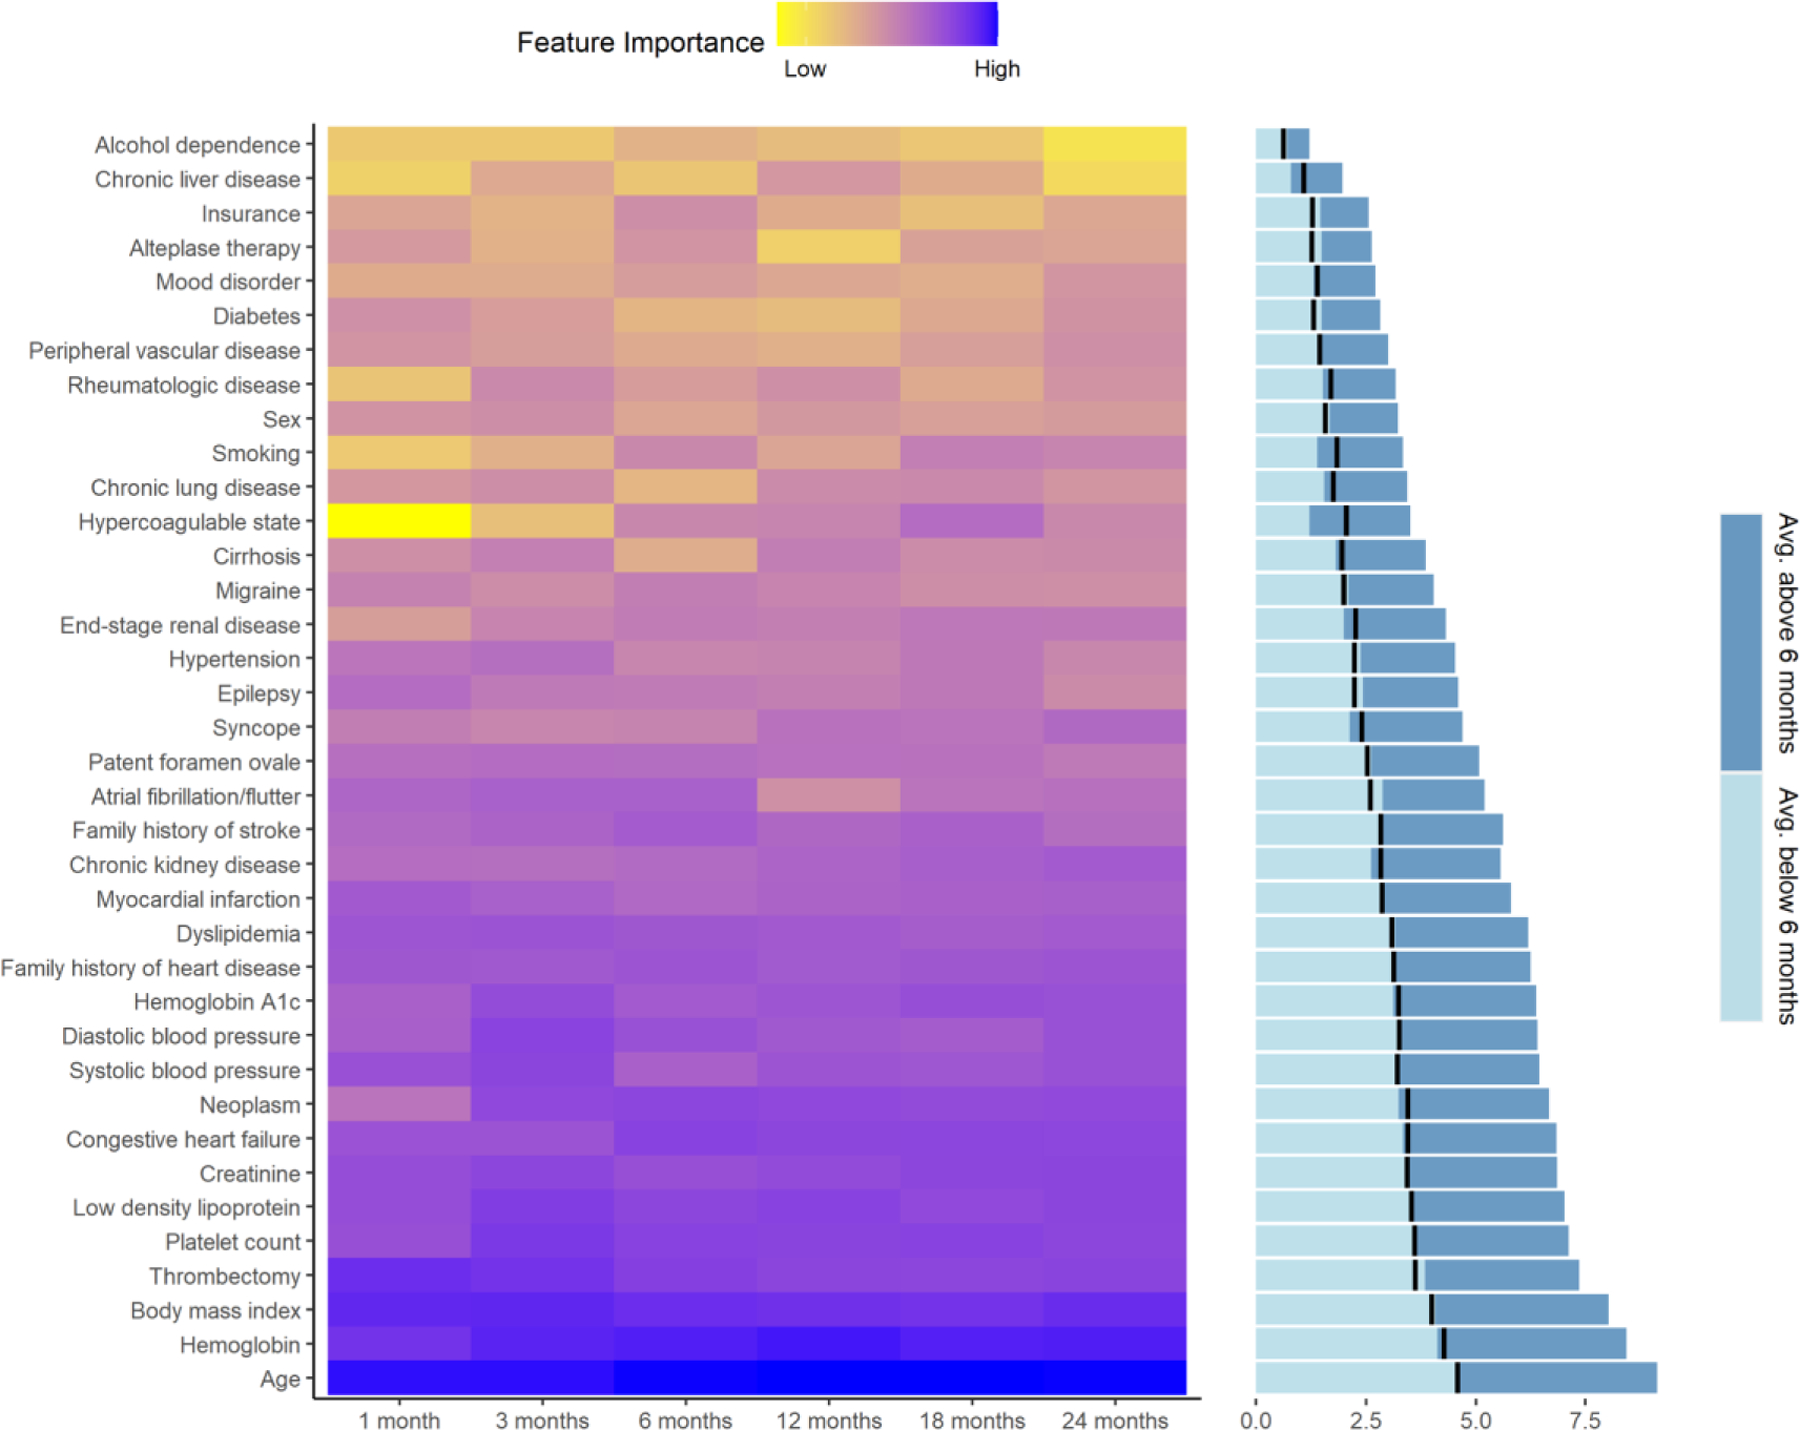
Average feature importance based on six different prediction windows. Bar graph panel shows the average importance for the short term (light blue for 1, 3, and 6 months) and long term (dark blue for 12, 18, and 24 months) prediction window; the black line represents the mid-level for each feature.
4. Discussion
4.1. Prediction of the post-stroke mortality
This is the first study to leverage EHR data to build prediction models of short- and long-term post-stroke mortality utilizing ML algorithms. Machine learning algorithms can include higher-order interactions among variables, handle multicollinearity, and improve predictions when applied to large and high-dimensional datasets.24 Nonetheless, we have assessed the correlation among the quantitative variables and did not detect any need to further refine the feature set based on highly correlated variables(Figure S1). This study was also based on interpretable models,25 that ensured variables important for the predictions could be extracted to improve transparency, especially when such models are designed to be integrated into clinical decision support systems embedded within the EHRs as assistive tools.
Predicting short- or long-term mortality can help the providers to further tailor the post-discharge care for individual patients. For instance, for patients with predicted short-term mortality, care providers could consider more aggressive and timely follow-ups, and in some cases even consider a consultation with palliative care, hospice services, better family involvement, or spiritual care as needed. By contrast, with a long-term mortality outlook, the focus could shift to patient education; risk mitigation, especially if actionable risk factors can be identified; managing disabilities; rehabilitation; and specialty care.26,27
4.2. Comparison with other studies
Our study is the largest study to date, in terms of sample size, and captures the longest prediction window. Various studies have attempted to predict mortality in patients with stroke. In 2010, Peng et al designed an RF algorithm predicting 30 days mortality in only spontaneous intracerebral hemorrhage patients in a cohort of 423 patients.28 In 2020, Bacchi et al leveraged a large Australian retrospective cohort of 2,407 patients for predicting in-hospital mortality.29 The study by Kruppa et al leveraged ML to predict long-term(100-days) mortality.30 Monteiro et al used 152 variables and a sample size of 425 to develop a model for the prediction of 3-month mortality. The latter, based on limited sample size and a large set of variables, may not generalize well as the model may suffer from overfitting. Finally, Ho et al built models to predict discharge mortality, with a sample size of only 190 and 26 features. Our study is based on a sample size of 7,144 with 37 features. Our prediction window varied between 30 days to 2 years and our performance metrics were dependent on the prediction window, reaching an AUROC of 0.82 for the 1-month prediction window. Table 2 summarizes the relevant studies for comparison. Overall, our results show that RF is the best performing model based on AUROC. Most studies excluded patients with missing data, except Bacchi et al, where median imputation was used. Excluding patients due to missingness can cause selection bias as missingness in clinical data tends to be not completely at random.17 Selection of features for prediction modeling is an important step, as it can lead to sparsity and ultimately bias. The number of features used in previous studies ranged from 15231 to 1133 and in some instances, a lack of basic reporting standards was noted. In the majority of studies, authors rely on a k-fold CV to assess the model performance; however, Kruppa et al used temporal and external validation to assess their model performance.30 In our study, we created a training and testing set and applied 5-fold CV on the training set, and assessed the model performance on the test set. Our performance metrics are comparable to the study by Kruppa et al, although, in that study, authors predict only 100 days mortality, and patients with missing data were excluded.30
Table 2.
Studies predicting post-stroke mortality.
| Study | Sample size | Number of features | Outcome measures | Handling of missing data | Validation | Best Algorithm | Compared Algorithms | Performance measures |
|---|---|---|---|---|---|---|---|---|
| Current study | 7144 | 37 | 1, 3,6,12, 18, and 24 months | Imputation using MICE | 20:80 train & test set split; 5-fold CV for training | Based on AUROC 1 m: RF 3 m: RF 6 m: RF 12 m: XGB 18 m:XGB,RF 24 m: RF |
LR, RF, XGB | AUROC / NPV / PPV (test data) 1 m: 0.82 / 0.89 / 0.58 3 m: 0.81 / 0.85 / 0.70 6 m: 0.80 / 0.81 / 0.92 12 m: 0.79 / 0.82 / 0.62 18 m: 0.81 / 0.82 / 0.67 24 m: 0.77 / 0.79 / 0.62 |
| Monteiro et al. 2018 31 | 425 | 152 | 3-months mortality | Patients and features with missingness excluded | 10-fold CV | RF for AUC | RF, DT, SVM, XGB, LR | AUC: 0.93 |
| Easton et al, 2014 33 | 933 | 11 | Model 1: 1–7 days; Model 2: 8–93 days |
N/A | N/A | NB | NB, LR, DT | AUC/Sensitivity/Specificity Model 1: 0.858 / 0.93 / 0.69 Model 2: 0.897 / 0.83 / 0.71 |
| Kruppa et al, 2014 30 | 3184 | 49 | 100-days mortality | Patients with complete data were selected. | Temporal and external validation | SVM-linear for AUC | k-NN, b-NN, RF, SVM, LR | AUC: Temporal validation=0.86; External validation = 0.85 |
| Çelik et al, 2014 9 | 340 | N/A | 10-days mortality | N/A | 5-fold CV | LR | Multilayer perceptron ANN model; Multivariate DA; LR | Sensitivity: 0.86; Specificity: 0.76; Accuracy: 0.81 |
| Ho et al, 2014 32 | 190 | 26 | Discharge mortality | Patients and features with missingness excluded (original dataset 778 patients) | 10-fold CV | SVM for c-static and F score | NB, SVM. DT, LR, RF, (PCA + SVM) | C-statistic: 0.78; F1 score: 0.50 |
| Peng et al, 2010 28 | 423 | N/A | 30-days mortality after SICH | No missingness; patients with missing data excluded | 4-fold CV | RF | ANN, SVM, LR, RF | AUC: 0.87; Sensitivity: 0.79; Specificity: 0.78; Accuracy: 0.78 |
| Bacchi et al, 2020 29 | 2407 | N/A | In-hospital mortality | Patient with missing outcome excluded; median imputation for other variables | 5-fold CV | LR | RF, DT, ANN, LR | AUC: 0.90; Sensitivity: 0.81; Specificity: 0.86; Accuracy: 0.82 |
ANN: artificial neural network; b-NN: bagged nearest neighbors; CV: cross-validation; DA: discriminant analysis; m: month; DT: decision tree: k-NN: k-nearest neighbors; LR: logistic regression; NB: Naive Bayes; PCA: principal component analysis; NPV: negative predictive value; PPV: positive predictive value; RF: random forest; SICH: symptomatic intracranial hemorrhage; SVM: support vector machine; XGB: XGBoost.
4.3. Clinical features associated with short- and long-term mortality
Age was the most prominent feature predicting both short-term and long-term mortality. Patients with older age are generally at higher risk for stroke and stroke-related morbidity and mortality.34 At above 60 years, in-hospital mortality following stroke raises above 3% increasing to more than 18% at above 90 years of age.35 Aside from the direct risk of older age, a higher prevalence of comorbidities can be considered as contributing factors.36
Besides, age, our results indicated that laboratory-based variables have higher importance when compared to the presence or absence of comorbidities. For instance, diabetes has lower importance when compared to the HbA1C variable(overall 4% versus 24% feature importance) (Figure 3), indicating that management of modifiable risk factors is essential. These observations highlight the value of incorporating quantitative laboratory-based features in the models and the need for imputation to reduce selection bias due to missingness in the EHR.17 Our model also showed hemoglobin level was an important feature for predicting post-stroke mortality. Lower hemoglobin level in stroke patients has also been shown to be associated with higher 1-year37 and 5-year36 mortality. Patients with the diagnosis of anemia are at a higher risk of in-hospital mortality following acute stroke.38 Anemia can act as a surrogate for a more severe form of chronic diseases. Anemia could also potentially impair tissue perfusion post-stroke, which can result in a worse outcome.39 Additional information from the past medical history of the patient, including congestive heart failure (CHF), dyslipidemia, myocardial infarction, are also key for the prediction of post-stroke mortality. CHF patients have a two to three times higher chance of experiencing stroke40 and the ones who had a stroke, also had more than two times chance of succumbing to death.41
Our results indicated that patients in the alive group had a higher BMI compared to deceased stroke patients. Moreover, our model illustrated BMI as the third most important predictor of post-stroke mortality. Patients with lower BMI have been shown to have higher 3-month38 and 5-year36 mortality post-stroke. We have previously conducted a comprehensive analysis in first-time AIS patients and found better survival in overweight (BMI:25–29.9) and obese (BMI≥30) patients compared to non-overweight patients (BMI<25).42 A meta-analysis of 15 studies suggested that obesity can have a protective effect on post-stroke mortality.43 These results further support the phenomenon of the “Obesity Paradox”. The exact mechanism on how higher BMI might exert its protective effect on mortality is still unclear; however contributing factors may include hypoxic preconditioning,44,45 increased systemic neuroendocrine imbalances, pro-inflammatory cytokines, radical overload leading to a catabolic state,46,47 as well as a potentially protective effect of adipose tissue which could be due to its secretion of soluble TNF-α receptors.48
Another important clinical feature associated with post-stroke mortality was the presence or absence of thrombectomy; the latter could be a proxy for the severity of stroke due to large vessel occlusions. Our results showed that hypercoagulable state is associated more with long-term mortality; the hypercoagulable state is likely indirectly associated with mortality, likely through patient’s comorbidities. Hypercoagulability is particularly prevalent among patients with a diagnosis of cancer. A combination of an inflammatory response, cancer cell procoagulants, comorbidities, and chemotherapeutics has been suggested as potential mechanisms.49–52 Consequently, a higher risk of thrombosis can result in stroke and higher stroke mortality among patients with cancer.52–54 We observed both neoplasm and the hypercoagulable state as indicators of short- and long-term mortality in stroke patients. Hypercoagulability was more associated with long-term mortality post-stroke. In our dataset both the conditions co-occurred in only 0.1% of patients in the alive group while this co-occurrence ranged from 0.3% in 2-months deceased group to 1.1% in the deceased group in the 24-month window. The chronic character of both the disorders –neoplasm and hypercoagulability– in addition to the cumulative effect of comorbidities and chemotherapeutics could be potential contributing factors.
4.4. Study strengths, limitations, and future directions
The administrative data in the form of EHR used in model development was comprehensive. However, given the nature of such data, there are some inherent limitations, such as selection bias and lack of information regarding stroke severity. Missingness in the NIHSS score is beyond the level for reasonable imputation. Given that NIHSS tend to be highly missing in structured EHR in general, its utility for automated ML models will be limited. We also did not have information about stroke subtypes. Nevertheless, our models still had a good performance. Our study was based on data from one healthcare system and may not generalize without further fine-tuning.
As future directions, we are expanding this study by expanding our GNSIS registry14,15 with additional layers of data and variables, including more comprehensive laboratory variables, medication information, and information from clinical notes such as signs and symptoms and history of present illness. We are also improving the model and model optimization by 1) improving the imputation for laboratory variables17 which can further enhance patient representation and reduce algorithmic bias; 2) applying natural language processing to expand the feature set from unstructured sources, and 3) integrating polygenic risk score55 using the available genetic information. Moreover, as NIHSS becomes more readily available in EHR systems, it will be important to include this variable in the models of mortality to improve the model performance. Finally, we are planning on developing models that account for the competing risk of death and other major vascular events in addition to ischemic stroke.
In conclusion, predicting post-stroke mortality is an unmet need with a high clinical impact for improved outcomes. Using longitudinal clinical data from EHR and optimized machine learning models, we have been able to develop models to predict short- and long-term post-stroke mortality. The factors associated with mortality differed depending on the prediction window. Our classifier further highlighted the importance of controlling risk factors, as indicated by laboratory measures.
Supplementary Material
Funding
Vida Abedi has financial research support from the NIH grant no. R56HL116832 sub-awarded to Geisinger during the study period. Ramin Zand has financial research support from Bucknell University Initiative Program, Roche—Genentech Biotechnology Company, the Geisinger Health Plan Quality fund, and receives institutional support from the Geisinger Health System during the study period. This study was in part supported by the NIH grant no. R56HL116832. Funders had no role in study design, data collection, and analysis, decision to publish, or preparation of the manuscript.
Footnotes
Publisher's Disclaimer: This is a PDF file of an unedited manuscript that has been accepted for publication. As a service to our customers we are providing this early version of the manuscript. The manuscript will undergo copyediting, typesetting, and review of the resulting proof before it is published in its final form. Please note that during the production process errors may be discovered which could affect the content, and all legal disclaimers that apply to the journal pertain.
Disclosures
Nothing to disclose.
References:
- 1.Writing Group Members, Mozaffarian D, Benjamin EJ, Go AS, Arnett DK, Blaha MJ, et al. Heart Disease and Stroke Statistics-2016 Update: A Report From the American Heart Association. Circulation. 2016;133:e38–360. [DOI] [PubMed] [Google Scholar]
- 2.Wang G, Zhang Z, Ayala C, Dunet DO, Fang J, George MG. Costs of Hospitalization for Stroke Patients Aged 18–64 Years in the United States. J. Stroke Cerebrovasc. Dis 2014;23:861–868. [DOI] [PMC free article] [PubMed] [Google Scholar]
- 3.Brønnum-Hansen H, Davidsen M, Thorvaldsen P. Long-Term Survival and Causes of Death After Stroke. Stroke [Internet]. 2001;32:2131–2136. Available from: https://www.ahajournals.org/doi/10.1161/hs0901.094253 [DOI] [PubMed] [Google Scholar]
- 4.Singh R-J, Chen S, Ganesh A, Hill MD. Long-term neurological, vascular, and mortality outcomes after stroke. Int. J. Stroke 2018;13:787–796. [DOI] [PubMed] [Google Scholar]
- 5.Olver I, Dodds S, Kenner J, Kerridge I, McGovern K, Milligan E, et al. Ethical considerations relating to healthcare resource allocation decisions. Intern. Med. J 2019;49:1364–1367. [DOI] [PubMed] [Google Scholar]
- 6.Radley DC, Schoen C. Geographic Variation in Access to Care — The Relationship with Quality. N. Engl. J. Med 2012;367:3–6. [DOI] [PubMed] [Google Scholar]
- 7.Counsell C, Dennis M. Systematic Review of Prognostic Models in Patients with Acute Stroke. Cerebrovasc. Dis 2001;12:159–170. [DOI] [PubMed] [Google Scholar]
- 8.Wang W, Kiik M, Peek N, Curcin V, Marshall IJ, Rudd AG, et al. A systematic review of machine learning models for predicting outcomes of stroke with structured data. PLoS One. 2020;15:e0234722. [DOI] [PMC free article] [PubMed] [Google Scholar]
- 9.Çelik G, Baykan ÖK, Kara Y, Tireli H. Predicting 10-day mortality in patients with strokes using neural networks and multivariate statistical methods. J. Stroke Cerebrovasc. Dis 2014;23:1506–12. [DOI] [PubMed] [Google Scholar]
- 10.Ong CJ, Orfanoudaki A, Zhang R, Caprasse FPM, Hutch M, Ma L, et al. Machine learning and natural language processing methods to identify ischemic stroke, acuity and location from radiology reports. PLoS One. 2020;15:e0234908. [DOI] [PMC free article] [PubMed] [Google Scholar]
- 11.Adane K, Gizachew M, Kendie S. The role of medical data in efficient patient care delivery: a review. Risk Manag. Healthc. Policy 2019;12:67–73. [DOI] [PMC free article] [PubMed] [Google Scholar]
- 12.Noorbakhsh-Sabet N, Zand R, Zhang Y, Abedi V. Artificial Intelligence Transforms the Future of Health Care. Am. J. Med. [Internet] 2019. [cited 2019 Apr 1];132:795–801. Available from: https://www.sciencedirect.com/science/article/pii/S0002934319301202 [DOI] [PMC free article] [PubMed] [Google Scholar]
- 13.Collins GS, Reitsma JB, Altman DG, Moons KGM. Transparent reporting of a multivariable prediction model for individual prognosis or diagnosis (TRIPOD): The TRIPOD statement. Ann. Intern. Med 2015; [DOI] [PubMed] [Google Scholar]
- 14.Chaudhary D, Khan A, Shahjouei S, Gupta M, Lambert C, Avula V, et al. Trends in ischemic stroke outcomes in a rural population in the United States. J. Neurol. Sci 2021;422:117339. [DOI] [PubMed] [Google Scholar]
- 15.Lambert C, Chaudhary D, Olulana O, Shahjouei S, Avula V, Li J, et al. Sex disparity in long-term stroke recurrence and mortality in a rural population in the United States. Ther. Adv. Neurol. Disord 2020;13. [DOI] [PMC free article] [PubMed] [Google Scholar]
- 16.van Buuren S, Groothuis-Oudshoorn K. mice: Multivariate imputation by chained equations in R. J. Stat. Softw 2011;45:1–67. [Google Scholar]
- 17.Abedi V, Li J, Shivakumar MK, Avula V, Chaudhary DP, Shellenberger MJ, et al. Increasing the Density of Laboratory Measures for Machine Learning Applications. J. Clin. Med 2021;10:103. [DOI] [PMC free article] [PubMed] [Google Scholar]
- 18.Kuhn M caret: Classification and Regression Training [Internet]. R Packag. version 6.0-86. 2020;Available from: https://cran.r-project.org/package=caret
- 19.Chen T, He T, Benesty M, Khotilovich V, Tang Y, Cho H, et al. xgboost: Extreme Gradient Boosting [Internet]. R Packag. version 1.1.1.1. 2020;Available from: https://cran.r-project.org/package=xgboost
- 20.Liaw A, Wiener M. Classification and Regression by randomForest. R News. 2002;2:18–22. [Google Scholar]
- 21.Misra D, Avula V, Wolk DM, Farag HA, Li J, Mehta YB, et al. Early Detection of Septic Shock Onset Using Interpretable Machine Learners. J. Clin. Med 2021;10:301. [DOI] [PMC free article] [PubMed] [Google Scholar]
- 22.Darabi N, Hosseinichimeh N, Noto A, Zand R, Abedi V. Machine Learning-Enabled 30-Day Readmission Model for Stroke Patients. Front. Neurol. [Internet] 2021;12. Available from: https://www.frontiersin.org/articles/10.3389/fneur.2021.638267/full [DOI] [PMC free article] [PubMed] [Google Scholar]
- 23.Abedi V, Avula V, Chaudhary D, Shahjouei S, Khan A, Griessenauer CJ, et al. Prediction of Long-Term Stroke Recurrence Using Machine Learning Models. J. Clin. Med. [Internet] 2021;10:1286. Available from: https://www.mdpi.com/2077-0383/10/6/1286 [DOI] [PMC free article] [PubMed] [Google Scholar]
- 24.Friedman J, Hastie T, Tibshirani R. The elements of statistical learning. Springer series in statistics New York; 2001. [Google Scholar]
- 25.Murdoch WJ, Singh C, Kumbier K, Abbasi-Asl R, Yu B. Definitions, methods, and applications in interpretable machine learning. Proc. Natl. Acad. Sci. U. S. A 2019; [DOI] [PMC free article] [PubMed] [Google Scholar]
- 26.Creutzfeldt CJ, Holloway RG, Walker M. Symptomatic and Palliative Care for Stroke Survivors. J. Gen. Intern. Med 2012;27:853–860. [DOI] [PMC free article] [PubMed] [Google Scholar]
- 27.Molidor S, Overbaugh KJ, James D, White CL. Palliative Care and Stroke. J. Hosp. Palliat. Nurs 2018;20:358–367. [DOI] [PubMed] [Google Scholar]
- 28.Peng SY, Chuang YC, Kang TW, Tseng KH. Random forest can predict 30-day mortality of spontaneous intracerebral hemorrhage with remarkable discrimination. Eur. J. Neurol 2010;17:945–950. [DOI] [PubMed] [Google Scholar]
- 29.Bacchi S, Oakden-Rayner L, Menon DK, Jannes J, Kleinig T, Koblar S. Stroke prognostication for discharge planning with machine learning: A derivation study. J. Clin. Neurosci 2020;79:100–103. [DOI] [PubMed] [Google Scholar]
- 30.Kruppa J, Liu Y, Diener HC, Holste T, Weimar C, König IR, et al. Probability estimation with machine learning methods for dichotomous and multicategory outcome: Applications. Biometrical J. 2014;56:564–583. [DOI] [PubMed] [Google Scholar]
- 31.Monteiro M, Fonseca AC, Freitas AT, Pinho E Melo T, Francisco AP, Ferro JM, et al. Using Machine Learning to Improve the Prediction of Functional Outcome in Ischemic Stroke Patients. IEEE/ACM Trans. Comput. Biol. Bioinforma 2018;15:1953–1959. [DOI] [PubMed] [Google Scholar]
- 32.Ho KC hun,, Speier W, El-Saden S, Liebeskind DS, Saver JL, Bui AAT, et al. Predicting discharge mortality after acute ischemic stroke using balanced data. AMIA Annu. Symp. Proc 2014;2014:1787–1796. [PMC free article] [PubMed] [Google Scholar]
- 33.Easton JF, Stephens CR, Angelova M. Risk factors and prediction of very short term versus short/intermediate term post-stroke mortality: A data mining approach. Comput. Biol. Med 2014;54:199–210. [DOI] [PubMed] [Google Scholar]
- 34.Gattringer T, Posekany A, Niederkorn K, Knoflach M, Poltrum B, Mutzenbach S, et al. Predicting Early Mortality of Acute Ischemic Stroke. Stroke. 2019;50:349–356. [DOI] [PubMed] [Google Scholar]
- 35.Purroy F, Vena A, Forné C, de Arce AM, Dávalos A, Fuentes B, et al. Age- and Sex-Specific Risk Profiles and In-Hospital Mortality in 13,932 Spanish Stroke Patients. Cerebrovasc. Dis 2019;47:151–164. [DOI] [PubMed] [Google Scholar]
- 36.Chen C-M, Lee M, Yang Y-H, Huang S-S, Lin C-H. Association between Clinical and Laboratory Markers and 5-year Mortality among Patients with Stroke. Sci. Rep 2019;9:11521. [DOI] [PMC free article] [PubMed] [Google Scholar]
- 37.Barlas RS, Honney K, Loke YK, McCall SJ, Bettencourt-Silva JH, Clark AB, et al. Impact of Hemoglobin Levels and Anemia on Mortality in Acute Stroke: Analysis of UK Regional Registry Data, Systematic Review, and Meta-Analysis. J. Am. Heart Assoc 2016;5. [DOI] [PMC free article] [PubMed] [Google Scholar]
- 38.Kubo S, Hosomi N, Hara N, Neshige S, Himeno T, Takeshima S, et al. Ischemic Stroke Mortality Is More Strongly Associated with Anemia on Admission Than with Underweight Status. J. Stroke Cerebrovasc. Dis 2017;26:1369–1374. [DOI] [PubMed] [Google Scholar]
- 39.van Bommel J, Trouwborst A, Schwarte L, Siegemund M, Ince C, Henny CP. Intestinal and cerebral oxygenation during severe isovolemic hemodilution and subsequent hyperoxic ventilation in a pig model. Anesthesiology. 2002;97:660–70. [DOI] [PubMed] [Google Scholar]
- 40.Kang S-H, Kim J, Park JJ, Oh I-Y, Yoon C-H, Kim H-J, et al. Risk of stroke in congestive heart failure with and without atrial fibrillation. Int. J. Cardiol 2017;248:182–187. [DOI] [PubMed] [Google Scholar]
- 41.Witt BJ, Brown RD, Jacobsen SJ, Weston SA, Ballman KV, Meverden RA, et al. Ischemic stroke after heart failure: a community-based study. Am. Heart J 2006;152:102–9. [DOI] [PubMed] [Google Scholar]
- 42.Chaudhary D, Khan A, Gupta M, Hu Y, Li J, Abedi V, et al. Obesity and mortality after the first ischemic stroke: Is obesity paradox real? PLoS One. 2021; [DOI] [PMC free article] [PubMed] [Google Scholar]
- 43.Huang K, Liu F, Han X, Huang C, Huang J, Gu D, et al. Association of BMI with total mortality and recurrent stroke among stroke patients: A meta-analysis of cohort studies. Atherosclerosis. 2016;253:94–101. [DOI] [PubMed] [Google Scholar]
- 44.Brzecka A, Ejma M. Obesity paradox in the course of cerebrovascular diseases. Adv. Clin. Exp. Med 2015; [DOI] [PubMed] [Google Scholar]
- 45.Ozeke O, Ozer C, Gungor M, Celenk MK, Dincer H, Ilicin G. Chronic intermittent hypoxia caused by obstructive sleep apnea may play an important role in explaining the morbidity-mortality paradox of obesity. Med. Hypotheses 2011; [DOI] [PubMed] [Google Scholar]
- 46.Scherbakov N, Dirnagl U, Doehner W. Body weight after stroke lessons from the obesity paradox. Stroke. 2011; [DOI] [PubMed] [Google Scholar]
- 47.Doehner W, Clark A, Anker SD. The obesity paradox: Weighing the benefit. Eur. Heart J 2010; [DOI] [PubMed] [Google Scholar]
- 48.Coutinho T, Goel K, Corrêa De SD, Kragelund C, Kanaya AM, Zeller M, et al. Central obesity and survival in subjects with coronary artery disease: A systematic review of the literature and collaborative analysis with individual subject data. J. Am. Coll. Cardiol 2011; [DOI] [PubMed] [Google Scholar]
- 49.Falanga A, Schieppati F, Russo D. Cancer Tissue Procoagulant Mechanisms and the Hypercoagulable State of Patients with Cancer. Semin. Thromb. Hemost 2015;41:756–64. [DOI] [PubMed] [Google Scholar]
- 50.Caine GJ, Stonelake PS, Lip GYH, Kehoe ST. The hypercoagulable state of malignancy: pathogenesis and current debate. Neoplasia. 4:465–73. [DOI] [PMC free article] [PubMed] [Google Scholar]
- 51.Falanga A Thrombophilia in cancer. Semin. Thromb. Hemost 2005;31:104–10. [DOI] [PubMed] [Google Scholar]
- 52.Abt NB, Bydon M, De la Garza-Ramos R, McGovern K, Olivi A, Huang J, et al. Concurrent neoadjuvant chemotherapy is an independent risk factor of stroke, all-cause morbidity, and mortality in patients undergoing brain tumor resection. J. Clin. Neurosci 2014;21:1895–900. [DOI] [PubMed] [Google Scholar]
- 53.Dardiotis E, Aloizou A-M, Markoula S, Siokas V, Tsarouhas K, Tzanakakis G, et al. Cancer-associated stroke: Pathophysiology, detection and management (Review). Int. J. Oncol 2019;54:779–796. [DOI] [PMC free article] [PubMed] [Google Scholar]
- 54.Green KB, Silverstein RL. Hypercoagulability in cancer. Hematol. Oncol. Clin. North Am 1996;10:499–530. [DOI] [PubMed] [Google Scholar]
- 55.Li J, Chaudhary DP, Khan A, Griessenauer C, Carey DJ, Zand R, et al. Polygenic Risk Scores Augment Stroke Subtyping. Neurol. Genet. [Internet] 2021;7:e560. Available from: http://ng.neurology.org/lookup/doi/10.1212/NXG.0000000000000560 [DOI] [PMC free article] [PubMed] [Google Scholar]
Associated Data
This section collects any data citations, data availability statements, or supplementary materials included in this article.
Supplementary Materials
Data Availability Statement
The patient-level data analyzed in this study may be shared with a third party upon execution of data sharing agreement for reasonable requests. All the codes can be found at: https://github.com/TheDecodeLab/GNSIS_v1.0/tree/master/ModelingStrokeMortality