

Abstract
Transmembrane protein 30A (TMEM30A) maintains the asymmetric distribution of phosphatidylserine, an integral component of the cell membrane and ‘eat-me’ signal recognized by macrophages. Integrative genomic and transcriptomic analysis of diffuse large B-cell lymphoma (DLBCL) from the British Columbia population-based registry uncovered recurrent biallelic TMEM30A loss-of-function mutations, which were associated with a favorable outcome and uniquely observed in DLBCL. Using TMEM30A-knockout systems, increased accumulation of chemotherapy drugs was observed in TMEM30A-knockout cell lines and TMEM30A-mutated primary cells, explaining the improved treatment outcome. Furthermore, we found increased tumor-associated macrophages and an enhanced effect of anti-CD47 blockade limiting tumor growth in TMEM30A-knockout models. By contrast, we show that TMEM30A loss-of-function increases B-cell signaling following antigen stimulation—a mechanism conferring selective advantage during B-cell lymphoma development. Our data highlight a multifaceted role for TMEM30A in B-cell lymphomagenesis, and char-acterize intrinsic and extrinsic vulnerabilities of cancer cells that can be therapeutically exploited.
DLBCL is the most common lymphoma subtype worldwide, accounting for 40% of all non-Hodgkin lymphomas1. DLBCL presents as an aggressive disease requiring immediate treatment, and current standard of care for patients treated with curative intent is multiagent chemotherapy in combination with rituximab, an anti-CD20 antibody (R-CHOP; rituximab, cyclophosphamide, doxorubicin, vincristine and prednisone)2,3. Although considerable improvement in outcome has been achieved, ~40% of patients still experience treatment failure. We contend that further improvement of treatment outcome relies on elucidating the molecular determinants related to treatment response and survival in homogenously treated cohorts that are representative of patients encountered in clinical practice.
Two major molecular subtypes of DLBCL are recognized, based on cell-of-origin (COO) classification: activated B-cell-like (ABC) and germinal center B-cell-like (GCB) subtypes. The COO subtypes have distinct underlying biology, clinical behavior and genetic features4–6. Several sequencing studies have identified candidate driver genes implicated in the differential pathogenesis of COO subtypes7–10. The most recent genomic landscape studies also suggested genetic subtypes of this entity11–13, however, functional characterization and clinical correlates of genetic alterations are rarely available.
Here, we characterized the recurrent genetic alterations and transcriptomic signatures in diagnostic biopsies from a population-registry-based cohort of 347 patients with de novo DLBCL uniformly treated with R-CHOP. This analysis revealed biallelic TMEM30A mutations to be associated with favorable treatment outcome and loss of function. Using TMEM30A-mutant systems, we have discovered that TMEM30A loss is associated with increased B-cell receptor (BCR) signaling, and is correlated with increased BCR mobility. In addition, TMEM30A loss leads to increased drug accumulation and an increase in tumor-associated macrophage infiltration, potential molecular mechanisms underlying the favorable clinical outcomes associated with these mutations. We furthermore uncovered increased efficacy of CD47 blockade in TMEM30A mutant models, driving increased tumor-cell phagocytosis and improved survival. Our study identifies an important role of TMEM30A in lymphomagenesis, and elucidates new mutation-associated vulnerabilities that sensitize lymphoma cells to immunochemotherapy.
Results
Specific gene mutations are associated with outcome in DLBCL.
We analyzed diagnostic biopsies from the British Columbia Cancer registry-based population of 347 patients with de novo DLBCL treated with R-CHOP. The baseline characteristics and outcomes in the study cohort were similar to those of the entire population of patients with DLBCL (n = 1,177) treated with curative intent in BC during the study period (Supplementary Fig. 1). We catalogued the genetic alterations and transcriptomic signatures using deep-targeted amplicon sequencing (n = 57 genes), SNP6.0 arrays and RNA sequencing (RNA-seq) (Extended Data Fig. 1a,b, Supplementary Fig. 2 and Supplementary Tables 1–3).
First, we assessed the influence of individual recurrent genetic alterations on time to progression (TTP) and overall survival (OS) (Extended Data Fig. 2 and Supplementary Table 4). Mutations in TMEM30A, BTG anti-proliferation factor 1 (BTG1) and tumor protein p53 (TP53), as well as deletions in beta-2-microglobulin (B2M) and gain/amplifications in nuclear factor of activated T cells 1 (NFATC1) were significantly associated with both TTP and OS in the entire cohort, and this was retained when controlling for the International Prognostic Index (IPI) and COO subtype (Fig. 1a and Supplementary Table 5). Furthermore, other genetic alterations were also significantly associated with both TTP and OS within only one COO subtype: microRNA 15a (MIR15a) and MIR16-1 deletion in ABC-DLBCL, and gain and/or amplifications of cytochrome P450 family 2 subfamily E member 1 (CYP2E1) and MYC, and TP53 mutation in GCB-DLBCL (Fig. 1b,c).
Fig. 1 |. Impact of genetic alterations on prognosis and gene expression in DLBCL.
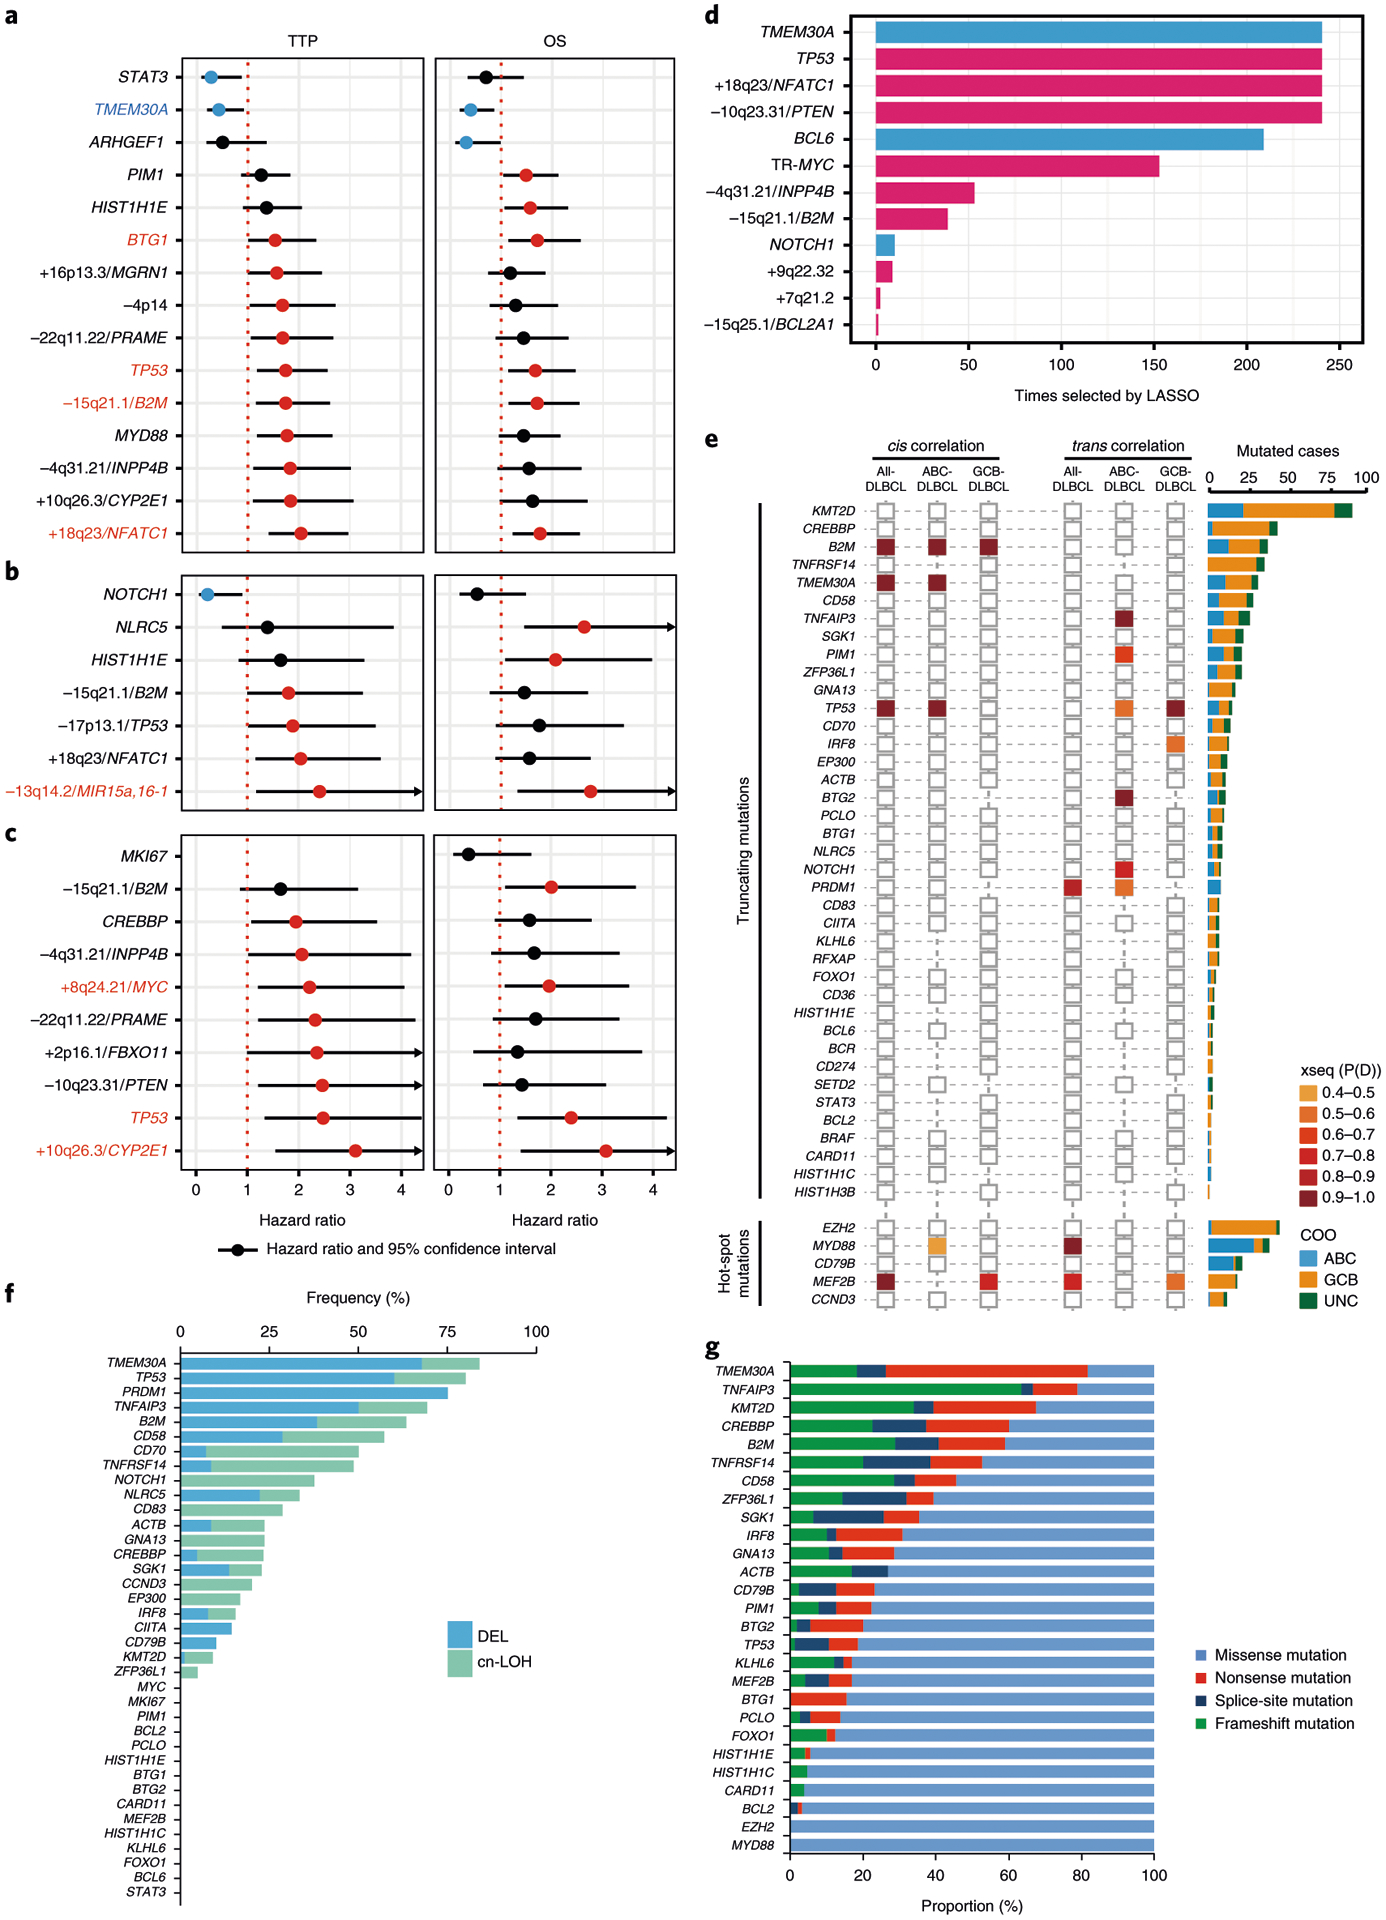
a,b,c, Forest plots summarize the results of univariate analyses (TTP and OS) for mutated genes and representative copy-number alterations (CNAs) within GISTIC regions, which are significantly associated with prognosis (unadjusted P value < 0.05), in all-DLBCL (n = 347) (a), in ABC-DLBCL (n = 104) (b) and GCB-DLBCL (n = 183) (c). Hazard ratios and 95% confidence intervals are shown. Colored circles represent significant hazard ratios, and colored genes are significantly associated with both TTP and OS (blue, favorably prognostic; red, unfavorably prognostic). d, Frequency of selection of the genetic feature by the Cox–lasso predictive models generated in 238 iterations of leave-one-out cross validation. COO and IPI are included as control variables in all models. The bar plot (blue, favorable outcome; red, unfavorable outcome) shows the genes repeatedly selected in the 238 models. e, xseq-derived cis and trans effects of loss-of-function and hotspot mutations in all DLBCL tumors and each COO subtype (left). P(D) represents the probability that a recurrently mutated gene influences gene expression across the population of patients. A larger P(D) value represents a stronger inferred effect. Histogram (right) shows the number of each mutation in COO subtypes. f, Frequencies of occurrence of hemizygous deletion or copy-neutral loss of heterozygosity (cnLOH) in the loss-of-function mutated tumors. g, Proportions of mutation type in recurrently mutated genes. Mutated genes with frequency >10% are depicted.
We also developed a prognostic model based on the selection and combination of genetic alterations using a stringent statistical methodology based on an adaptive lasso estimator for Cox’s proportional-hazards model (Cox–lasso). Results demonstrate that the selected genetic alterations contained additional signals informative of TTP beyond COO and IPI. Genetic alterations that were repeatedly selected in most crossvalidation training sets included mutations of TMEM30A, BCL6 and TP53, deletions of INPP4B, PTEN and B2M, gain/amplification of NFATC1, and MYC translocation (Fig. 1d).
Integrative analysis revealed TMEM30A as a putative tumor-suppressor gene.
We next performed an integrated mutation-gene expression analysis using xseq14, and identified loss-of-function mutations in TMEM30A that strongly influence expression in cis in the whole DLBCL cohort (Fig. 1e). Notably, more than 80% of tumors with TMEM30A mutations show hemizygous deletions and/or copy-neutral loss of heterozygosity, which was the most frequent co-occurrence among analyzed genes (Fig. 1f). In addition, most of the TMEM30A mutations (82%) are nonsense, splice-site and frameshift mutations, amounting to the highest proportion of truncating mutations among all evaluated genes (Fig. 1g). The inactivation pattern of TMEM30A mutations, in conjunction with the observed association with superior outcome, prompted us to further investigate the genetic, clinical and functional features in detail.
TMEM30A (CDC50A) encodes the beta-subunit of phospholipid flippase (P4-ATPase) and a component of flippase, which regulates translocation of phosphatidylserine (PS) from the outer to the inner leaflet of the plasma membrane, maintaining an asymmetric distribution of the phospholipid15,16. In our cohort, TMEM30A mutations were scattered across all coding exons (Fig. 2a). Notably, 95% of TMEM30A mutations were located in the transmembrane and extracellular domains17,18 (Fig. 2b). We confirmed the somatic nature of the mutations in all five patients with available germline DNA. TMEM30A was mutated in 38/347 (11%) DLBCL patients, with similar frequency in ABC-DLBCL (12%) and GCB-DLBCL (11%). In total, TMEM30A genetic alterations were observed in 27% of DLBCL patients, including 31 patients with biallelic alterations (Fig. 2c,d).
Fig. 2 |. Genetic characterization of TMEM30A.

a, TMEM30A protein domain and the locations of 42 mutations identified in this study, affecting 38 DLBCL tumors, as well as 5 mutations found in transformed folllicular lymphoma (FL) samples in our previous study20. Multiple mutations affecting the same position are annotated. b, Schematic structure of the P4-ATPase and TMEM30A subunits consisting of two membrane-spanning domains with a large extracellular loop; 95% of variants are localized to extracellular domains, which are required for assembly with P4-ATPase. Flippase activities are annotated with colored stars. c, Distribution of DLBCL tumors harboring TMEM30A mutations, heterozygous deletions (Het-Del), and cnLOH, TMEM30A mutation without CNAs and heterozygous deletion without mutations. d, Heterozygous deletions were validated using fluorescence in situ hybridization (FISH) assays in all nine analyzed samples. Two-color FISH assays use a red probe interrogating TMEM30A and a green probe interrogating PIM1 on the chromosomal 6p arm as a reference. e, SNP6.0 copy-number heat map illustrating broad deletions affecting TMEM30A, EPHA7, PRDM1 and TNFAIP3 locus (dense blue line and arrow) on chromosome 6q11-24 in representative DLBCL tumors. f, Distribution of recurrent mutations, COO subtypes and IPI groups in 38 TMEM30A-mutated DLBCL tumors (left). The header includes the status of TMEM30A mutation and CNAs. Histograms (right) show the frequency of each alteration within TMEM30A mutated (dark gray) and non-mutated tumors (light gray). Two-sided Fisher’s exact test was used to compare these frequencies according to the two groups. *P < 0.05, ***P < 0.001. g, Evaluating the evolutionary timing of TMEM30A mutations and 6q deletions. Each column depicts an evolutionary timing scenario for TMEM30A mutations and 6q deletions.
A number of missense mutations in TMEM30A have been previously investigated, and were shown to result in a reduction in correct localization and flippase activity19. We similarly examined the ability of TMEM30A mutants, co-expressed with ATP8A2 in HEK293T cells, to heterodimerize and actively flip PS within the plasma membrane (Extended Fig. 3a). Using immunoprecipitation to test for complex formation, we observed that truncated TMEM30A mutants (R226X, R290X, R307X) did not precipitate with ATP8A2, suggesting a failure to form a complex. Missense TMEM30A mutants (C94R, D181Y) were precipitated with ATP8A2, though there was an absence of higher-molecular-weight banding, suggesting a reduction in glycosylation—a modification necessary for normal complex formation and activity17. These missense mutants also demonstrated a reduction in flippase activity (Extended Fig. 3b).
TMEM30A mutations are correlated with concurrent loss of tumor-suppressor genes in chromosome 6q.
GISTIC analysis identified chromosome 6q14.1, including the TMEM30A locus, as a significantly deleted site (Extended Fig. 1b and Supplementary Table 3). Of note, broad heterozygous deletions of chromosome 6q were found in the vast majority of affected patients, which includes other known tumor-suppressor genes in B-cell lymphoma, including EPHA7, PRDM1 and TNFAIP3 (Fig. 2e). Overall, 82% (31/38) of tumors with TMEM30A mutations and 95% (76/80) of heterozygous deletions had concomitant genetic alterations of EPHA7, PRDM1 and TNFAIP3 (Extended Fig. 3c). Furthermore, among recurrent mutations found in DLBCL, TNFAIP3 and PRDM1 mutations were significantly enriched in TMEM30A mutated tumors (P = 0.0002 and P = 0.02, respectively; Fisher’s exact test) (Fig. 2f and Extended Fig. 3d).
We also calculated relative cancer-cell fraction (CCF), which compares TMEM30A copy number (CN) and mutation, revealing that CCF of 6q deletion was significantly higher than that of TMEM30A mutation (P = 0.003: one-sample t-test). Specifically, among assessable events, 15 out of 22 (68%) 6q deletions had higher CCFs than the TMEM30A mutation, while CCFs with TMEM30A mutation were higher in only 6/22 (27%) (Fig. 2g). This analysis suggests that 6q deletions precede TMEM30A mutations in the majority of DLBCL patients.
TMEM30A mutation uniquely occurs in DLBCL and confers favorable outcome.
Next, we searched publicly available datasets and found that TMEM30A mutations were recurrently found in aggressive B-cell lymphomas (DLBCL, transformed follicular lymphoma (tFL) and primary CNS lymphoma) with similar mutation patterns as in our dataset. In contrast, mutations were rarely observed in Burkitt lymphoma and FL, and absent in other hematologic malignancies (Fig. 3a). In non-hematological malignancies, TMEM30A was exceedingly rarely mutated (0.3% of nearly 10,000 patients) (Supplementary Table 6).
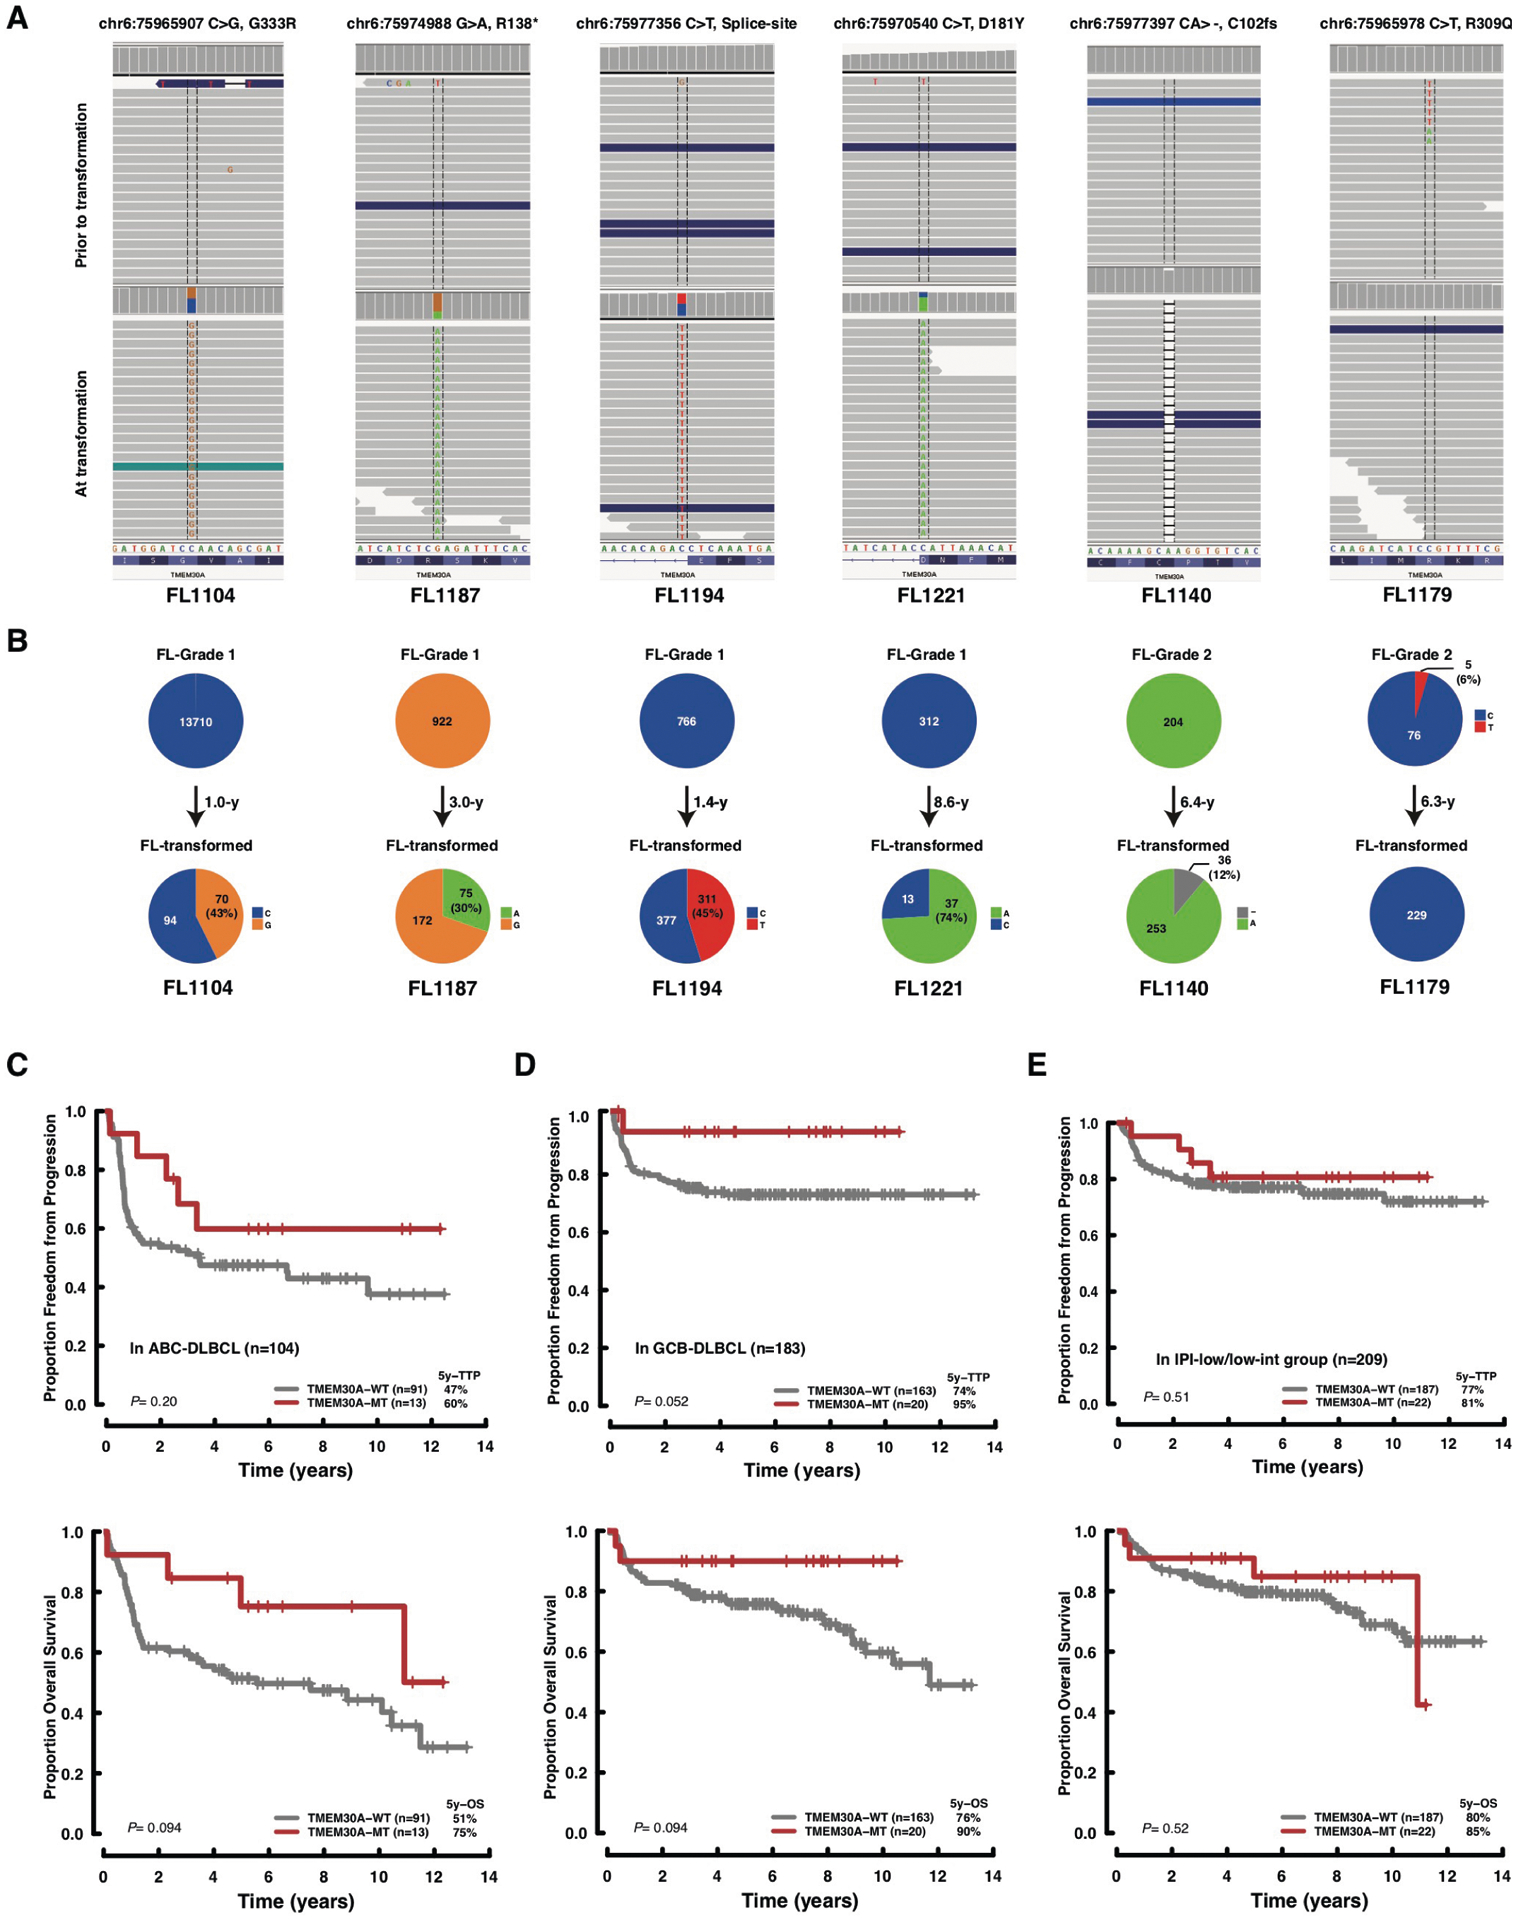
Fig. 3 |. Prevalence and clinical impact of TMEM30A mutation.

a, Bar plot showing the frequencies of TMEM30A mutation in lymphomas and other hematological malignancies, based on the previous literature and publicly available datasets. b, Deep targeted sequence data of a representative transformed FL case (FL1004) for the affected position of the TMEM30A visualized in integrative genomics viewer (left) and variant allelic frequency visualized in pie chart (right), demonstrating the proportion of variant reads (variation indicated in green) at the time of diagnosis (FL-Grade 1), transformation (DLBCL) and relapse after transformation (FL-Grade 2). The time between initial diagnosis (FL-Grade1) and first relapse (FL-transformed) and between first relapse and second relapse (FL-Grade 2) is shown in years (y). c–e, Kaplan–Meier curves represent TTP (top) and OS (bottom) according to TMEM30A mutation in all DLBCL (c), in IPI-high/high-intermediate group (d) and according to TMEM30A genetic status in all DLBCL (e). P values were derived from two-sided log-rank test (c,d) and Cox proportional-hazards model (e).
Our previous analysis of 118 patients with paired diagnostic and transformed FL specimens showed that TMEM30A mutations were found at the time point of transformation to DLBCL (T2), but not at primary diagnosis (T1) in 6 patients20 (Fig. 3b and Extended Data Fig. 4a,b). Moreover, in 1 case of FL recurrence after transformation, TMEM30A mutation was found with a low allele frequency (1.6%) at the time of recurrence (T3; histology of FL). These data demonstrate that TMEM30A mutations were acquired during transformation and not found in FL.
Tumors harboring TMEM30A mutations were significantly associated with a favorable outcome in our cohort (Fig. 3c,and Extended Fig. 4c,d). Notably, the prognostic effect of TMEM30A mutations was particularly evident when examining the outcomes in patients with high IPI scores (Fig. 3d and Extended Fig. 4e). In addition, patients with TMEM30A biallelic alteration showed significantly longer TTP compared to those with the wild type (P = 0.035; log-rank test), whereas patients with monoallelic alterations had similar outcomes to those with wildtype TMEM30A (Fig. 3e). There were no significant differences in clinical and phenotypic characteristics according to TMEM30A biallelic mutations (Supplementary Table 7). Interestingly, TMEM30A mutations were detected as a significant component of mutation-defined, genetic subtypes with favorable outcomes in two recent studies (BN2 and C1 groups)12,13.
Basal phosphatidylserine exposure is unchanged in DLBCL TMEM30A-knockout cells.
These results suggest that TMEM30A is a previously unknown tumor suppressor in DLBCL, whose loss is associated with favorable outcome in patients. To characterize functional mechanisms at play, we generated TMEM30A knockout cell lines (TMEM30A−/−) using CRISPR–Cas9 genome editing in two GCB-DLBCL cell lines (DOHH-2, Karpas422), and one ABC-DLBCL cell line (NU-DUL-1) (Supplementary Table 8 and Extended Data Fig. 5a). As an established control, we also generated TMEM30A−/− in Jurkat, a T-cell lymphoblastic line21. In the absence of a reliable TMEM30A antibody, we verified lower messenger RNA and protein expression by qPCR, RNA-seq and global proteomics analysis (Extended Data Fig. 5b–d and Supplementary Table 9). Expression levels of P4-ATPases, TMEM30B and TMEM30C in wildtype and TMEM30A−/− cell lines using RNA-seq, were found to be unchanged (Extended Fig. 5d).
We examined PS extracellular exposure in cycling, untreated TMEM30A−/− cells with annexin V binding. As previously established, TMEM30A loss of function in Jurkat cells showed a significant increase in PS exposure21 (Fig. 4a). Comparatively, PS exposure was only minimally increased or absent in DLBCL TMEM30A−/− cells.
Fig. 4 |. BCR mobility and B-cell signaling is increased in B-cell lymphoma lines with TMEM30A loss-of-function mutation.

a, Abundance of externalized PS was measured through flow cytometry by annexin V-APC binding in Jurkat, DOHH-2, Karpas422 and NU-DUL-1 under optimal growth conditions, comparing wild type (red) and TMEM30A−/− (blue). b–e, BCR mobility and clustering in Karpas422 as measured by single-particle tracking analysis. All experiments were repeated independently three times with similar results. b, Cells were labeled with anti-IgG Fab–Cy3, settled onto poly-l-lysine-coated coverslips and imaged for 10 s at 33 Hz by total internal reflection microscopy. A representative experiment with Karpas422 is shown here. Single-state diffusion coefficients were calculated for all tracks, and cumulative frequency curves are shown. The dots on the curves indicate the median values and are reported in brackets. The total numbers of tracks analyzed were 5,098 (wild type), 4,230 (control), 4,250 (mutant 1) and 2,704 (mutant 6). c, The cumulative frequency curves of the confinement diameters with the median values (dots on the curves) indicated in brackets. d, BCR tracks were analyzed using a two-state HMM model to subdivide trajectories into slow-diffusing (red) and fast-diffusing (blue) segments, with dynamic transitions between these two inferred behaviors. Depicted are representative static trajectories of IgG BCRs that were segmented into inferred slow and fast states. The fraction of fast states from all tracks is indicated in blue. Scale bar, 5 μm. e, The transition rates (Kslow→fast, Kfast→slow) between the two states are shown. The dots indicate median values; lines indicate 95% confidence intervals (n = 3). f, Effects of overnight antigen stimulation by F(ab)2 fragments on (i) PS exposure in TMEM30A−/− and wild-type control cells, measured by annexin V–APC binding, (ii) induction of surface markers CD69 (Karpas422) and (iii) phosphorylation of AKT (NU-DUL-1), measured by flow cytometry. Graphs represent mean values ± s.d. ((i) n = 8 (Karpas422), n = 9 (DOHH-2), n = 6 (NU-DUL-1), (ii) n = 9 and (iii) n = 6). All P values are based on an unpaired two-tailed Student’s t-test. g, Alterations in PS externalization following (i) ionomycin and (ii) F(ab)2 fragment stimulation following TMEM16F knockdown in NU-DUL-1 wild-type and TMEM30A−/− cells. Graphs represent mean values ± s.d. (n = 6). All P values are based on an unpaired two-tailed Student’s t-test.
TMEM30A-knockout cells show increased BCR mobility and B-cell receptor signaling.
It is unknown whether TMEM30A loss has a role in primary selection and lymphomagenesis in DLBCL. We therefore investigated the role that TMEM30A loss-of-function might play in BCR-dependent signaling driving lymphomagenesis. Using single-particle tracking, we found that the lateral mobility of cell surface IgG BCRs, which regulates the strength of BCR signaling, was found to be 2- to 5-fold higher in TMEM30A−/− cells, though surface expression of IgG BCRs was equivalent22–26 (Fig. 4b and Extended Data Fig. 6a). IgG BCRs in TMEM30A−/− cells traversed larger areas on the cell membrane, as measured by the increased confinement diameter of these tracks (Fig. 4c and Extended Data Fig. 6b). Since BCRs transiently move faster or slower as they explore the local membrane environment, we used a two-state hidden Markov model (HMM) that subdivides receptor trajectories into fast and slow diffusive modes, each characterized by a single diffusion coefficient27. In TMEM30A−/− cells, there was an increased fraction of IgG BCRs in the inferred fast state (Fig. 4d and Extended Data Fig. 6c), and a higher rate of transitioning/switching from a slow-to-fast state (Kslow→fast) than in wild-type cells (Fig. 4e and Extended Data Fig. 6d). We repeated this analysis with CD19, an important coregulator in B-cell signaling. However, CD19 mobility was not altered in TMEM30A−/− cells, suggesting the increase in diffusion was BCR-specific (Extended Data Fig. 6e, f).
We next stimulated wild-type and TMEM30A−/− DLBCL cells with bivalent F(ab)2 antibody fragments as a surrogate antigen, inducing T-cell-independent B-cell signaling. We observed a dramatic increase in PS exposure in TMEM30A−/− cells, but not wild-type cells, following stimulation (Fig. 4f,i). A similar response was observed following ionomycin treatment (Fig. 4g,i). This increase was not found to be correlated with a decrease in viability or an increase in apoptotic signaling (Extended Data Fig. 6g). Intracellular calcium was increased, with no significant difference between wild-type and knockout cell lines (Extended Fig. 6h).
To evaluate the role of BCR stimulation in PS exposure, we blocked the signaling cascade by preincubating DOHH-2 cells with ibrutinib, a BTK inhibitor. DOHH-2 and GCB-DLBCL in general are largely resistant to ibrutinib28, and we similarly observed non-toxic effects under experimental and CRISPR–Cas9 screen conditions (Extended Data Fig. 7a,b)28. We recorded a reduction in F(ab)2-fragment-induced calcium release following ibrutinib inhibition, indicating a blockade of downstream signaling events (Extended Data Fig. 7c). Moreover, we observed a significant reduction in F(ab)2-fragment-induced PS exposure in TMEM30A−/− cells with ibrutinib treatment, indicating a direct role of BCR signaling in PS exposure (Extended Data Fig. 7d).
TMEM30A-loss-induced differences in downstream BCR signaling events were investigated, and found to be varied in different cell lines. In Karpas422 TMEM30A−/− cells, incubation with F(ab)2 fragments caused a significantly greater increase in the expression of surface markers, such as CD69 (Fig. 4f,ii and Extended Data Fig. 7e). Both AKT and ERK1/2 showed increased levels of phosphorylation in stimulated NU-DUL-1, and to a more limited extent in Karpas422 TMEM30A−/− cells (Fig. 4f,iii and Extended Data Fig. 7f). Taken together, TMEM30A loss-of-function enhances cell surface BCR dynamics facilitating more rapid B-cell responses after BCR crosslinking and/or antigen binding.
Given the connection between TMEM30A loss, increased BCR dynamics, calcium release and PS exposure, we studied the role for calcium-induced scramblases, such as TMEM16F (encoded by ANO6), in influencing the PS equilibrium29. Scramblases play a predominant role in flipping PS to the extracellular side of the plasma membrane, opposing flippase activity30–35. Expression levels of ANO6 and other scramblases were observed to be unchanged between TMEM30A−/− and wild-type cells (Extended Data Fig. 5d). To examine the role of TMEM16F, we generated ANO6 frameshift mutants using CRISPR–Cas9 gene editing (TMEM16F–/+, Supplementary Table 8 and Extended Data Fig. 5e). We did not observe any alteration in basal levels of PS exposure in TMEM30A−/− cells. However, we found a significant decrease in ionomycin-induced PS exposure in TMEM30A−/−TMEM16F−/+ cells, and with a similar trend following F(ab)2 induction (Fig. 4g,i,ii). These data suggest that TMEM16F, induced by increases in calcium following BCR stimulation, is the predominant driver of PS exposure following BCR activation.
TMEM30A-mutant cells show increased sensitivity to chemotherapy drugs.
Given the favorable treatment outcome of patients with DLBCL with TMEM30A loss, we examined PS exposure in TMEM30A−/− DLBCL cell lines after treatment with doxorubicin and vincristine. We observed a two-fold increase in PS externalization in TMEM30A−/− cells relative to controls following treatment (Fig. 5a,i). We also included a TMEM30A−/− ‘rescued’ line, by reintroducing a native TMEM30A expressing vector (‘rhTMEM30A’) into a TMEM30A−/− cell line (Extended Fig. 5c). A TMEM30A dependent reversal of drug-induced PS exposure was seen in TMEM30A−/−+rhTMEM30A, compared with the empty vector control (+Empty) (Fig. 5a, ii).
Fig. 5 |. TMEM30A loss of function mediated increased drug uptake in DLBCL.

a, Effects of vincristine and doxorubicin, both components of the R-CHOP regimen, on PS exposure in Karpas422 TMEM30A−/− and wild-type control. The top panel (i) compares wild-type (red) and TMEM30A−/− (blue) events counted by flow cytometry. The lower panel (ii) compares TMEM30A−/− expressing recombinant TMEM30A (rhTMEM30A, red) and a transformation empty-vector control (Empty, blue). b, Increased apoptotic signaling following incubation with doxorubicin as measurable by caspase-3 activation by western blot analysis (i), and vincristine, as measurable by a G2/M block through flow cytometry (ii), was compared in Karpas422 TMEM30A−/−, wild type and TMEM30A transformants. Cropped images from the same western blot are shown. β-actin is used as a loading control. See Source Data Fig. 5. Experiments were repeated independently three times with similar results. c, Doxorubicin uptake in Karpas422 TMEM30A−/−, wild type and TMEM30A transformants over time was detected by flow cytometry. Graphs represent mean values ± s.d. (n = 4). All P values are based on an unpaired two-tailed Student’s t-test. d, Externalized PS following increasing doxorubicin incubation times was measured in gated B-cells from DLBCL patient tumor biopsies expressing normal or TMEM30A-null (summary bar plot, left; movement of each sample, right). Graphs represent mean values ± s.d. (n = 3). P value is based on a two-way ANOVA test. e, Doxorubicin uptake in gated B-cells from DLBCL patient tumor biopsies was measured over time by flow cytometry. Graphs represent mean values ± s.d. (n = 3). P value is based on a two-way ANOVA test. f, Alterations in PS externalization (i) and doxorubicin (ii) uptake including XKR8 knockout in NU-DUL-1 wild type (WT) and TMEM30A−/− cells over time.
PS extracellular exposure is an endpoint response to apoptotic signaling following the activation of caspase-3, which deactivates TMEM30A and activates scramblases34,35. Apoptotic activation following doxorubicin and vincristine treatment was compared in TMEM30A−/− and control cells by detecting caspase-3 activation. TMEM30A−/− cells demonstrated a higher quantity of caspase-3 activation relative to controls and rescued cells following drug treatment, confirming a higher level of apoptotic response in mutant cells (Fig. 5b,i). When treated with vincristine, a microtubule polymerization inhibitor, TMEM30A−/− and empty rescue vector controls showed a higher population of arrested cells at the G2/M phase relative to wild-type controls and rescued cells (Fig. 5b,ii). Internalization of doxorubicin, which is naturally fluorescent and measurable by flow cytometry, allowed tracking of transport into the cell. After 2–4 h incubation, doxorubicin uptake was significantly higher in TMEM30A−/− than in control cells (Fig. 5c).
We repeated this analysis with primary tumor cell suspensions from patients with DLBCL with TMEM30A biallelic alterations, compared with TMEM30A normal cells. As in the mutant cell lines, the primary tumor cells with TMEM30A mutations demonstrated higher PS exposure after doxorubicin treatment and doxorubicin uptake was significantly higher in TMEM30A-mutated tumors relative to their normal counterparts (Fig. 5d,e). Taken together, these results show that the TMEM30A loss of function results in stress-induced enhanced PS exposure, doxorubicin uptake and apoptosis in genome-edited cell lines and primary tumor B cells.
XKR8 is a primary scramblase catalyzing PS exposure during apoptosis in lymphocytes35,36. To evaluate the role of PS exposure in doxorubicin uptake, we generated XKR8 mutants (XKR8−/−) in the cell line NU-DUL-1, using CRISPR–Cas9 gene editing (Supplementary Table 8 and Extended Data Fig. 5e). Basal levels of PS exposure in TMEM30A−/−XKR8−/− were found to be unchanged relative to TMEM30A−/− (Fig. 5f,i). However, following doxorubicin treatment, PS exposure was found to be significantly blocked in both the XKR8−/− cell line with wild-type TMEM30A and the TMEM30A−/−XKR8−/− cell line, indicating a primary role for XKR8 in PS exposure following chemotherapeutic treatment (Fig. 5f,i). Doxorubicin uptake was slightly, though significantly, reduced in XKR8−/− cell lines (Fig. 5f,ii).
Xenotransplantation of human TMEM30A−/− cells in mouse models shows tumor regression and improved survival with vincristine.
DOHH-2 TMEM30A−/− cells, subcutaneously injected into immune-deficient NOD-scid IL2Rgnull (NSG) mice, exhibited reduced tumor growth and increased survival relative to wild-type controls, despite equivalent proliferation rates in vitro (Extended Data Fig. 8a). Xenotransplanted mice treated with vincristine demonstrated a longer survival rate (Fig. 6a) and reduced tumor growth rates in both wild-type and mutant groups (Extended Data Fig. 8b). Mice with wild-type DOHH-2 succumbed to their tumors after 24–27 d, with vincristine significantly extending survival. Interestingly, TMEM30A−/− xenografts demonstrated a dramatic response to vincristine. Following treatment, 4 out of 5 mice with TMEM30A−/− DOHH-2 responded favorably to vincristine, showing substantial tumor regression, and in 3 cases complete disappearance of the tumor by the end of this study (Day 76) (Extended Fig. 8b). These xenotransplantation models recapitulated the improved prognosis seen in patients with biallelic TMEM30A mutations with demonstration of increased sensitivity to chemotherapy and improved outcomes compared with wild-type controls.
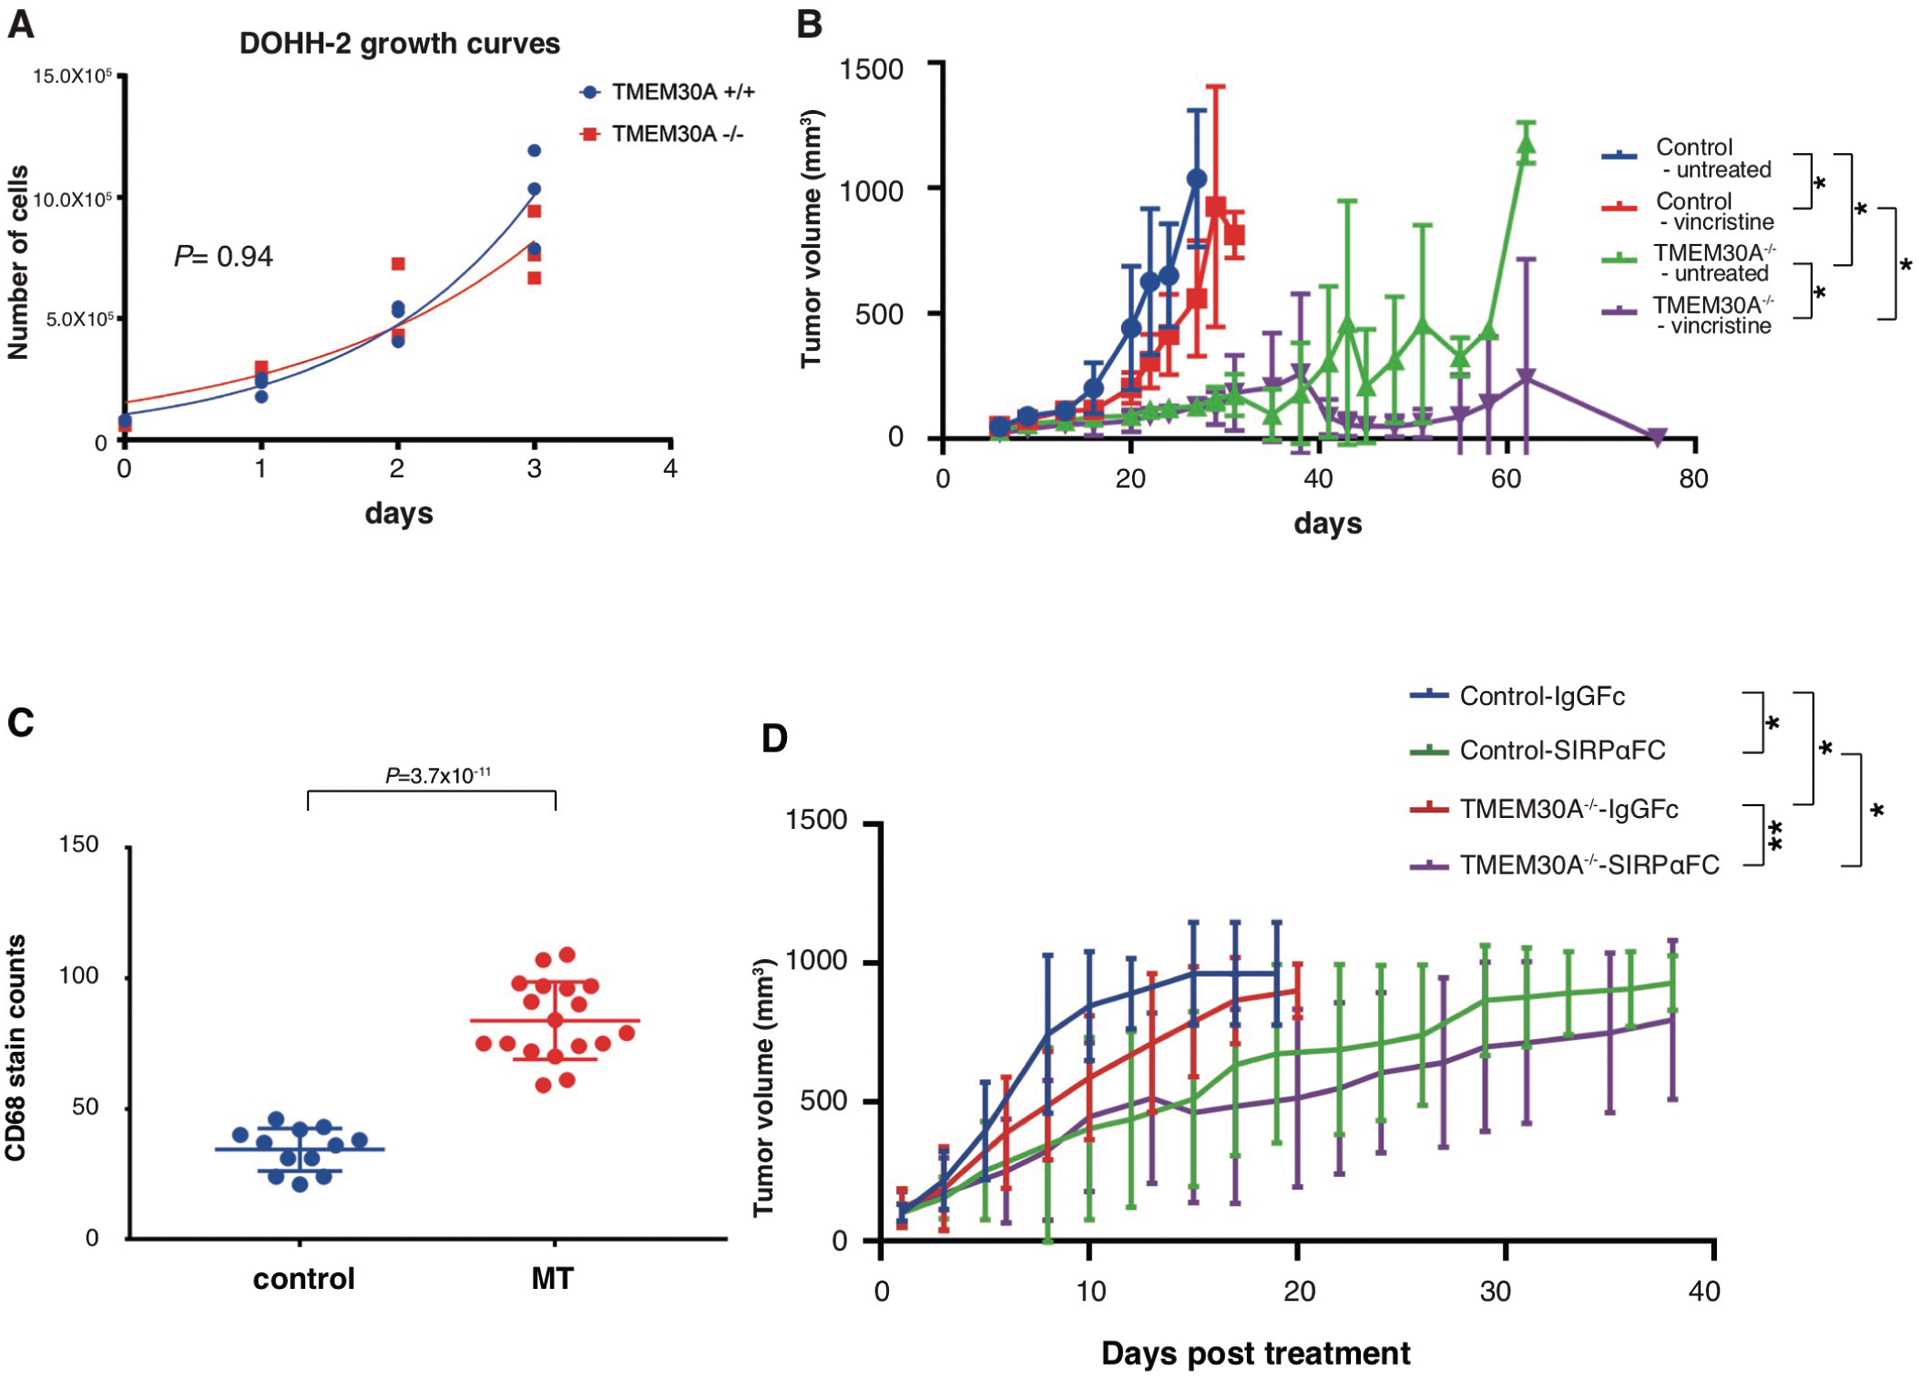
Fig. 6 |. TMEM30A loss of function enhanced survival with treatment and increased macrophage infiltration in mouse models.

a, Xenotransplantation models of DOHH-2 cells with wild-type or TMEM30A−/− subcutaneously injected into NSG mice (5 per group). Vincristine treatment (0.1 mg kg−1) or saline control (untreated) was administered when tumor volumes per group reached 100 mm3. Kaplan–Meier plots showing overall survival of NSG xenograft mice. P value is based on a Mantel-Cox test. ⋆P < 0.05, ⋆⋆P < 0.01. b, Liver tissues from A20 wild-type Tmem30a or Tmem30a−/− syngeneic mouse models (n = 5 mice per group), sacked within first palpable presentation of tumor growth (‘early sac’, ~day 20), were stained with hematoxylin and eosin (H&E), B220, Ki-67, F4/80 and CD163. c, Macrophage count comparison per tissue within 3 randomly selected ×400 high-power field (HPF) regions per tumor from 5 separate mice per group with early sac (A20 model). P value is based on an unpaired two-tailed Student’s t-test. d, In vitro macrophage engulfment assays of wild-type or TMEM30A−/− DOHH-2. Cells were pretreated with 1 μM TTI-621 or TTI-402 preceding coculture with macrophages. The phagocytic index was measured by flow cytometry. Graphs represent mean values ± s.d. (n = 4). All P values are based on a paired two-tailed Student’s t-test. e,f, Xenotransplantation models of DOHH-2 cells with wild-type or TMEM30A−/− subcutaneously injected into NSG mice (n = 10 mice per group). TTI-621 treatment (10 mg per kg body weight) or TTI-402 (6.67 mg per kg body weight) was initiated when tumor volumes per group reached 100 mm3. Kaplan–Meier plots showing overall survival of NSG xenograft mice. e, Visualization and quantitation of engulfed B cells in macrophages as detected by CD68 antibody with H&E counter staining. Two representative images of engulfment from TTI-621 treated TMEM30A−/− group (i). Macrophage engulfment counts from each mouse model treatment group (ii). Graphs represent mean values ± s.d. (n = 15 (control), n = 9 (mutant)). All P values are based on a paired two-tailed Student’s t-test. f, Kaplan–Meier plots showing overall survival of NSG xenograft mice. P value is based on a Mantel–Cox test. ⋆P < 0.05, ⋆⋆⋆P < 0.001; n.s., not significant.
Increased macrophage infiltration and phagocytosis associated with TMEM30A loss of function.
The role of externalized PS in macrophage recognition and engulfment prompted us to examine the effects of TMEM30A loss of function on phagocytosis. To further examine the association of macrophages with TMEM30A−/− cells in an immune competent model system, we generated a syngeneic mouse model utilizing the murine B-cell lymphoma cell line A20, a highly aggressive tumor cell line from a Balb/cAN mouse resembling a mature B-cell neoplasm with characteristics of DLBCL (Supplementary Table 8). The growth rate of mutant (Tmem30A−/−) and control cell lines were equivalent, and Tmem30A−/− cells showed slightly higher PS exposure than did wild-type cells (Extended Data Fig. 9a, b). Balb/c mice injected with Tmem30a−/− cells survived longer than those injected with wild-type cells, though proliferation by Ki-67 staining was equivalent (Fig. 6b and Extended Data Fig. 9c). Tumor infiltrates were present in multiple organs (liver, spleen, lung) in the control group, with reduced or no infiltrate in the Tmem30A−/− groups (Extended Data Fig. 9d–f). Interestingly, we observed a significantly increased level of macrophage infiltrates in Tmem30A−/− tumors at an earlier stage in tumor development compared with controls, following both intravenous and subcutaneous implantation of A20 cells (Fig. 6b,c and Extended Fig. 9g). We also found that CD163 staining was absent in control and Tmem30A−/− tumors, suggesting that these tumor-associated macrophages were predominantly M1 polarized (Fig. 6b). RNA-seq of tumor tissue also revealed significantly reduced expression of interleukin 4 induced 1 (Il4i1) (false-discovery rate (FDR) = 2.43 × 10⁻⁶), which is a representative M2 macrophage marker, in Tmem30A−/− tumors compared with control tumors (Extended Data Fig. 9h i). Our data suggest that TMEM30A loss of function is associated with a primed microenvironment for phagocytosis.
Enhanced efficacy of CD47 blockade limiting tumor growth in TMEM30A-knockout models.
We then elected to investigate the efficacy of a phagocytic checkpoint inhibitor in vitro and in vivo. Specifically, we tested SIRPα Fc (TTI-621), a new CD47 blockade drug currently undergoing assessment in clinical trials37. CD47 is characterized as a ‘don’t eat me’ signal, which blocks phagocytosis through a direct interaction with the SIRPα receptor expressed on macrophages38. TTI-621 acts both as a competitive CD47 block and as an opsonizing agent via a fused IgG1 Fc domain37. First, we tested the ability of TTI-621 to increase the in vitro phagocytosis index of DLBCL cell lines, compared with TTI-402, a negative control (IgG Fc), using macrophage co-culture assays (Fig. 6d). From this evaluation, TTI-621 induced increased phagocytosis of DOHH-2, with significantly enhanced engulfment of TMEM30A−/− cells.
Finally, we evaluated TTI-621 or TTI-402 in our DOHH-2 xenograft model. As before, DOHH-2 TMEM30A−/− xenografts showed increased macrophage infiltrates relative to the control treatment group, with higher levels observed following TTI-621 treatment, including a measurable increase in observed engulfed cells (Fig. 6e and Extended Data Fig. 8c). Mice treated with TTI-621 showed prolonged survival compared with mice treated with TTI-402 (Fig. 6f), with a significant reduction in tumor growth (Extended Data Fig. 8d). Significantly, TTI-621 treatment enhanced the survival of TMEM30A−/− xenografts compared with wild-type xenografts, with a concurrent stall in tumor growth that was significantly more prolonged in TMEM30A−/− than in wild-type cells (Fig. 6f and Extended Data Fig. 8d).
Discussion
Our integrative genomic and transcriptomic analyses of tumors from 347 patients with DLBCL highlighted new biallelic loss-of-function mutations of TMEM30A, a gene that has not previously been implicated in cancer in detail. TMEM30A mutations are significantly associated with favorable outcome, and are uniquely found in DLBCL. Through functional analysis in mutant cell lines, primary lymphoma cells and mouse model systems, we demonstrated biological mechanisms that underlie the primary selection of B-cell lymphoma development, and the favorable outcome of patients with TMEM30A-mutated DLBCL. Of therapeutic importance, TMEM30A mutation was associated with macrophage engulfment using CD47 blockade. These findings suggest predictive value of TMEM30A mutation status and related macrophage biology in the context of new checkpoint inhibitor treatments.
The present study was conducted in a large, uniformly R-CHOP-treated DLBCL cohort derived from a population-based registry, allowing us to perform precise molecular mapping of recurrent genetic alterations and to investigate their clinical significance. Our integrative genomics approach and stringent statistical modeling identified biallelic TMEM30A loss-of-function mutations as functionally important, and intriguingly associated with superior outcome. Furthermore, this favorable prognosis of TMEM30A loss was also observed across multiple datasets12,13. Of importance, GISTIC analyses in our and other studies12 similarly detected the minimum commonly deleted region of 6q14.1 harboring only a few tumor suppressor genes, including TMEM30A, in DLBCL highlighting this locus as biologically relevant in the context of broader scale 6q deletions.
Our finding of TMEM30A mutational specificity to DLBCL may be explained by increased BCR clustering and signaling which were shown in our DLBCL TMEM30A-mutant model systems, which represents a mechanism of selective advantage for B-cell lymphoma development. Emerging concepts of tuning B-cells via increased lateral mobility of BCRs and their interaction with positive regulators/co-receptors have been proposed22,25. Here we show that TMEM30A loss-of-function correlates with increased BCR spatial dynamics, and subsequently higher B-cell signaling/responses post BCR cross-linking. While we have yet to elucidate a mechanism connecting TMEM30A, PS exposure, membrane physiology and BCR signaling, various observations demonstrating PS enrichment in lipid rafts, which house the BCR signalosome, and potential indirect connections between PS and the actin cytoskeleton suggest an emergent role that has yet to be discovered39–42.
Another prominent finding of this study is increased drug sensitivity in the TMEM30A mutant models and the primary lymphoma cells. Regulating membrane transportation is an important biological role of the P4-ATPase and TMEM30A complex15,43 and in previous studies, TMEM30A was shown to control the uptake of anti-cancer drugs, suggesting its key role in the transport of chemotherapeutic agents across the plasma membrane44,45. One study in particular connected an increase in PS exposure with an increased uptake of BODIPY-taxol, and proposed a role of membrane morphology in this change in uptake41. We similarly demonstrated that TMEM30A inactivation enhanced the uptake of doxorubicin leading to increased apoptosis.
Surface PS has been well characterized as an ‘eat me’ signal, recognized by macrophages and stimulating engulfment. Several therapeutic agents, including rituximab, antibodies targeting PDL1 or CD47, have utilized this mechanism to target tumor cells for macrophage clearance. Indeed, a recent clinical trial has demonstrated dramatic anti-lymphoma effects with CD47 blockade in patients with DLBCL46. We have observed TMEM30A-mutation-associated increases in macrophage engulfment in vitro, macrophage infiltration and reduced tumor growth in vivo. Interestingly, our models demonstrated significantly prolonged survival in combination with cytotoxic treatment (vincristine) or CD47 blockade (TTI-621). It stands to reason that patients with DLBCL with TMEM30A loss may be excellent candidates for CD47 blockade trials.
In conclusion, our study uncovered clinically relevant mutations in a cohort representative of patients with DLBCL encountered in clinical practice. This is the first study to demonstrate a clinical and biological role of TMEM30A in human cancer, providing new biological insights into membrane physiology in B-cell lymphoma development and mutation-associated cellular vulnerabilities.
Methods
Patient cohort description.
Initially, the BCCA Lymphoid Cancer database was searched to identify all patients with DLBCL diagnosed between 1985 and 2011. From 4,063 patients with DLBCL, 347 with de novo DLBCL were included in the final cohort for analysis if they met the following criteria: patients had to be 16 years of age or older, treated uniformly with R-CHOP with curative intent at BC Cancer, had complete clinical, laboratory and outcome data available, and had a fresh frozen diagnostic biopsy. The diagnosis was made according to the 2008 World Health Organization classification, as determined by standardized review by expert hematopathologists (A.M., P.F., G.W.S. and R.D.G.)47. Patients were excluded if they had any of the following: primary mediastinal large B-cell lymphoma; primary or secondary central nervous system involvement at diagnosis; a previous diagnosis of an indolent lymphoproliferative disorder; positive HIV serology; a secondary malignancy or major medical comorbidity that precluded treatment with curative intent (Supplementary Fig. 1a). The baseline characteristics and outcomes in the study cohort were similar to those of the entire population of patients with DLBCL (n = 1,177) treated with curative intent in BC during that time, with the exception that there was a significantly lower proportion of patients with two or more extranodal sites in the study cohort as described previously48. This study was reviewed and approved by the University of British Columbia, British Columbia Cancer Agency Research Ethics Board, in accordance with the Declaration of Helsinki.
Targeted sequencing.
Mutational data were generated based on deep targeted sequencing using Truseq Custom Amplicon assay (mean coverage, 767; range, 128–2,039; s.d., 180). For the validation of detected variants, we also performed deep-targeted sequencing with Fluidigm Access Array system.
We sequenced the protein-coding regions of 59 genes in 347 tumors and matched 67 normal samples using deep targeted sequencing. Using our mutation data previously generated and published7, along with the other 2 published DLBCL mutation landscape reports8,9, we selected 59 genes for the deep targeted re-sequencing, which included recurrently mutated genes at: (1) >5% in at least two studies; (2) >10% in one study; and (3) biological interest. The genes are: ACTB, ARHGEF1, B2M, BCL2, BCL6, BCL7A, BCR, BRAF, BTG1, BTG2, CARD11, CCND3, CD274, CD36, CD58, CD70, CD79B, CD83, CIITA, CPS1, CREBBP, EP300, EZH2, FOXO1, GNA13, HIST1H1C, HIST1H1E, HIST1H3B, HLA-C, IFR8, KLHL6, KMT2D, KRAS, MEF2B, MKI67, MYC, MYD88, MYOM2, NLRC5, NOTCH1, P2RY8, PCLO, PIM1, PRDM1, RFXAP, RHOA, S1PR2, SETD2, SGK1, STAT3, TMEM30A, TMSL3, TNFAIP3, TNFRSF14, TNFSF9, TP53, UNC5C, UNC5D, ZFP36L1. The 5% threshold for incidence was based on a calculation of power to detect survival differences in a cohort size of 347 patients at varying hazard ratios and mutational incidences (Supplementary Table 1). This table indicates that there would be limited power to detect survival differences between groups where the mutational incidence is below 5%.
We used two orthogonal deep sequencing strategies (Fluidigm Array and TSCA) for the validation of single-nucleotide variants (SNV) and insertions/deletions (indels). 1,914 SNVs and indels identified using TSCA were selected to design a Fluidigm assay to evaluate the sensitivity of the TSCA assay. Among 1,914 SNVs sequenced, 1,884 SNVs were qualified to be evaluated, and 1,821 SNVs were confirmed to be present in the data from the Fluidigm assay, suggesting a validation rate of 97% (1,821/1,884).
The final mutation list included 3,164 nonsynonymous variants, including 2,520 missense, 243 nonsense, 139 splice site mutations and 262 indels (Supplementary Table 2). When the above filtering process was applied to matched-tumor normal samples (n = 67), 395/419 true-positive somatic variants were detected with a sensitivity of 95%. Details are available in the Supplementary Methods.
SNP6.0-based copy-number analysis.
DNA samples from 338 DLBCL tumors were analyzed with Affymetrix Human SNP6.0 Array (Affymetrix, USA). 500 ng genomic DNA from fresh frozen specimens was labeled, fragmented and hybridized to microarrays using the manufacturer’s recommended protocol. Affymetrix Human SNP 6.0 Array contains >946,000 non-polymorphic CNV probes. The staining and washing was carried out on a Fluidics Station 450 (Affymetrix) and scanning with a GeneChip scanner 3000 7G system (Affymetrix). CEL files were generated by Affymetrix Command Console version 3.0. A detailed process of analyses is described in the Supplementary Methods.
Gene-expression analysis.
We obtained RNA-seq data for 322 DLBCL samples to quantify the gene-expression levels. Between 849 ng and 2 μg of total RNA were arrayed in a 96-well plate. Polyadenylated (polyA+) mRNA was purified using the 96-well MultiMACS mRNA isolation kit on the MultiMACS 96 separator (Miltenyi Biotec) then ethanol-precipitated, and used to synthesize complementary DNA using the Maxima H Minus First Strand cDNA Synthesis kit (Thermo-Fisher) and random hexamer primers at a concentration of 5 μM along with a final concentration of 1 μg μl−1 Actinomycin D, followed by Ampure XP SPRI bead purification on a Biomek FX robot (Beckman-Coulter). The second-strand cDNA was synthesized following the Superscript cDNA Synthesis protocol by replacing the dTTP with dUTP in dNTP mix, allowing the second strand to be digested using uracil-N-glycosylase (UNG; Life Technologies) in the post-adapter ligation reaction and thus achieving strand specificity. cDNA was fragmented by sonication using a Covaris LE220 (Covaris). Plate-based libraries were prepared using the Biomek FX robot (Beckman-Coulter) according to the British Columbia Cancer Agency, Genome Science Centre paired-end protocol, previously described. The purified libraries with a desired size range were purified and diluted to 8 nM, and then pooled at five per lane and sequenced as paired-end 75-bp on the Hiseq 2500 platform. This yielded, on average, 71 million reads per patient (range, 6.5–163.7 million reads). Details are available in the Supplementary Methods.
Survival analysis.
We evaluated the prognostic effect of mutations with a frequency of >5%, and representative CNAs within GISTIC regions. For survival analysis and comparison of frequencies between COO subtypes, we used gene-centric CNAs defined by OncoSNP. The patients with gain and/or HLAMP would be combined into one group as amplification, and HETD and HOMD were combined into one group as deletion since the frequencies of HLAMP and HOMD were very low. The Kaplan–Meier method was used to estimate the TTP (progression/relapse or death from lymphoma or acute treatment toxicity), progression-free survival (progression/relapse or death from any cause), disease-specific survival (death from lymphoma or acute treatment toxicity) and OS (death from any cause), with log-rank test performed to compare survival curves. In this study, we mainly used TTP, as this seems to be more sensitive to reflect the influence of genetic features on tumor progression by removing the death events not caused by lymphoma. Univariate and multivariate Cox proportional-hazards regression models were used to evaluate proposed prognostic factors.
Molecular-based prediction model.
We developed a genetic multivariate score based on 57 gene mutations, MYC, BCL2 and BCL6 translocations and CNAs. For this analysis, CNAs were selected based on representative genes within GISTIC in terms of known functional importance, as well as high driver probabilities of cis and/or trans effect (driver probability > 0.8) predicted by xseq analysis. In total, 3042 genes proceeded with this analysis. Since many of the molecular features were highly correlated, we grouped the information of correlated genes into ‘metagenes’ using hierarchical clustering with Gower’s similarity and average linkage. The associated dendrogram was pruned at a height such that the number of tree nodes was approximately 100. This process downsized the variables of all genetic alterations into 98 metagenes.
We developed a computational pipeline to identify a genetic signature that can predict survival after adjusting for the presence of COO subtype and IPI index. Our pipeline started with a univariate selection of relevant genes, that is, for every metagene. We fitted a Cox proportional-hazards additive model that included a genetic feature and controls for the effect of COO and IPI. We selected all the metagenes whose Wald P values were less than 0.05. In the second step of our pipeline, we used the whole subset of significant metagenes, together with COO and IPI, to identify a genetic panel that explained TTP using a Cox–lasso. To avoid overshrinkage, we used a penalization level that was half-way between the lambda that minimizes the cross-validated error (that is., lambda.min in ‘glmnet’ R package) and the lambda such that the error was within one standard error of the minimum (that is, lambda.1se). Since this value was based on a tenfold crossvalidation, we used the average value from ten crossvalidation runs. The coefficients of the genetic variables, estimated by the resulting Cox–lasso, were used to build a continuous linear genetic score, which was further discretized at the median value in the corresponding training set. We assessed the statistical significance of this discrete genetic predictor by using a likelihood ratio test (LRT) to compare a Cox proportional-hazards model with only COO and IPI versus a model with COO, IPI and the genetic predictor. To control for over-fitting, we used leave-one-out cross-validation to select genes and estimate their coefficients in the training set, and used the resulting coefficients to build the predictive score for the test sample left out.
TMEM30A mutation in publicly available dataset.
The frequency of TMEM30A mutations in different lymphoid malignancies was calculated utilized data curated from 150 published studies that have reported somatic mutations in these cancers. The reported mutations (n > 400,000) from over 10,000 individuals were harmonized using TransVar (https://bioinformatics.mdanderson.org/transvar/) and subsequently annotated using VarScan (http://varscan.sourceforge.net/). All mutations present at a prevalence of >0.0001 among human donors were identified among exomes from nonmalignant blood samples (http://exac.broadinstitute.org/) and removed from the harmonized dataset as were variants present in dbSNP (https://www.ncbi.nlm.nih.gov/snp/). Known cancer hotspot mutations (https://www.cancerhotspots.org/#/home) were retained. These curated data will be made available through an open access ‘LymphoDB’ web site (D.W.H. and L.M.S., unpublished observations).
Cell lines and mice.
Human DLBCL cell lines DOHH-2 and Karpas422 were purchased from DSMZ and ATCC, respectively, and maintained in RPMI-1640 (Life Technologies) containing 10% or 20% FBS (Life Technologies), respectively. The mouse cell line A20 was provided by A. Beilhack (University of Würburg, Germany), and maintained in RPMI-1640 containing 10% FBS. NU-DUL-1 was provided by M. Dyer (University of Leichester, UK), and maintained in RPMI-1640 containing 10% FBS. The Jurkat cell line was provided by A. Weng (BC Cancer, Vancouver, Canada), and maintained in RPMI-1640 containing 10% FBS, 1% sodium pyruvate and 1% nonessential amino acids (all from Life Technologies). HEK293-T cells were purchased from Open Biosystems, and cultured in DMEM plus 10% FBS. For all studies, FBS was heat inactivated, by heating serum at 56 °C for 30 min before addition to medium. NSGmice were purchased from an in-house source (Animal Resource Centre, BC Cancer, Vancouver, BC). Balb/c mice were purchased from Envigo. All mouse studies were approved by the Institutional Animal Care Committee (IACC) at the University of British Columbia, in accordance with the Canadian Council on Animal Care Guidelines. This study was approved by the Research Ethics Board of the University of British Columbia and the BCCA, conducted in accordance with the Declaration of Helsinki. Details are available in the Supplementary Methods.
Xenotransplantation, syngeneic mouse modeling and tumor monitoring.
DOHH-2 cell lines were verified to be mycoplasma negative using the Venor GenM Mycoplasma Detection kit (Sigma Aldrich). Four million cells were resuspended 1:1 with 100 μl matrigel HC (Corning) and RPMI-1640 plus 10% FBS, and held on ice until injection. Cells were implanted subcutaneously into the back of each female NSG mouse using a 27-gauge needle. Tumor growth was monitored every second day by measuring tumor dimensions with calipers beginning with the observance of palpable tumors (100 mm3). When tumors are palpable, mice were randomly selected from each group (control, TMEM30A−/−) for vincristine treatment at a concentration of 0.1 mg kg−1, TTI-621 at a concentration of 10 mg kg−1, or TTI-402 at a concentration of 6.67 mg kg−1. Treatment (vincristine or saline control) were administered by injection (200 μl per 20-g mouse) in the tail vein every 4 d for a total of 3 injections (Q4D×3). Weekly thawed TTI-621 and TTI-402 was administered intraperitoneally (200 μl per 20 g mouse) on Monday/Wednesday/Friday for 4 weeks, for a total of 12 injections.
A20 cells were verified to be mycoplasma negative, as above. One million cells were resuspended in HBSS (Invitrogen) plus 10% FBS, and held at room temperature until injection. Cells were injected subcutaneously, in the shoulder or intravenously in the tail vein using a 28-g needle. Tumor growth was monitored as described above.
Mice were observed daily and euthanized when they appeared in poor health or when tumors grew to a maximum of 800 mm3. Tumor volumes were calculated according to the equation: length × width × height / 2, with length (mm) as the longest axis of the tumor. Mice were euthanized by isoflurane overdose followed by CO2 asphyxiation. All mouse immunohistochemistry was performed as described above using antibodies of B220 (RA3–6B2; Thermo Fisher Scientific), Ki-67 (SP6; Abcam), F4/80 (D2S9R; Cell Signaling Technology) and CD163 (EPR19518; Abcam).
In vitro macrophage engulfment assay.
Human monocytes were isolated from fresh, commercial human normal peripheral blood B cells (ZenBio) as follows. Cells were washed twice in PBS and resuspended in PBS/1% FBS at a final density of 1 × 10⁷ cells per ml. Twenty microliters of CD14 MicroBeads (Miltenyi Biotec) per 1 × 10⁷ cells were added and incubated at 4 °C for 15 min. CD14+ cells were then collected by magnetic separation with a MACS Separator using two sequential LS columns, following manufacturer’s directions (Miltenyi Biotec). Cells were counted, and the CD14+ enrichment of the final cell culture was assessed by flow cytometry, by staining with anti-human CD14–APC (eBioscience). Two million cells were plated in a 6-well plate, and cultured for 1 week in X-VIVO15 medium (Lonza) plus 20 ng ml−1 recombinant human M-CSF (PeproTech). The cells were thusly maintained for up to 4 weeks, and medium was changed every 3–4 d.
One day before the phagocytosis assay, monocyte-derived macrophages (MDMs) were primed by adding 100 mg ml−1 human IFN-γ (Peprotech). The following day, primed macrophages were detached by rinsing wells with 2 mM EDTA/PBS, followed with incubation in enzyme-free cell dissociation buffer (Gibco). Detached cells were washed twice in X-VIVO15/rhM-CSF medium, and 50,000 cells were seeded in a 96-well round-bottom plate.
Viable DOHH-2 cells, the target cells for macrophage engulfment, were washed twice in PBS, and labeled with pH-tolerant Violet Proliferation Dye VPD450 (BD Biosciences), by incubation with 1 μM dye with 1 × 10⁶ cells (37 °C, 15 min). The labeling reaction was quenched with heat inactivated FBS, and the cells were washed four times in PBS and resuspended in X-VIVO15/rhM-CSF media. Labeled cells were then treated with 1 μM TTI-621 or TTI-402 for 30 min at 37 °C. Following treatment, cells were combined with aliquoted macrophages, allowing phagocytosis to occur for 2 h at 37 °C. The extent of phagocytosis following incubation was measured by flow cytometry. The assay plate was washed twice with cold FACS buffer (2 mM EDTA, 2% heat inactivated FBS, 0.1% sodium azide, in PBS). Human FcR binding inhibitor (eBioscience) was added to each well and incubated for 10 min at room temperature. Cells were then labeled for 30 min on ice for macrophage detection with the following panel: anti-human CD11b–PE (eBioscience), anti-human CD14–APC, and Live/Dead Fixable Near-IR Dead2 Cell Stain (Life Technologies). The assay plate was then washed four times in FACS buffer, and cells were resuspended in stabilizing fixative solution (BD Biosciences). CD11b+CD14+ macrophages were gated and tested for the presence of engulfed DOHH-2 cells (high VPD450) as an indication of phagocytosis. All samples were acquired using an LSRFortessa and analyzed using FlowJo Version V10.2 software.
Statistical analysis.
The Fisher’s exact test was used when comparing two categorical data. For the comparison of two continuous variables, these data were tested by Wilcoxon rank-sum test, unless otherwise noted. Multiple testing corrections were performed, where necessary, using the Benjamini–Hochberg procedure. All in vitro studies were conducted at least in triplicate, including biological replicates with three unique CRISPR-mediated frameshift mutations. All quantitative results are presented as the mean with standard deviation. The statistical significance of the differences between cell culture groups was determined using two-tailed Student’s t-test. Primary cell comparisons were analyzed with two-way repeated measure ANOVA with Bonferroni multiple-comparisons test. Global proteomics differential expression was evaluated using probe-level expression change averaging via the R Bioconductor package, which ranks peptides of each protein by their P value generated by a modified paired Student’s t-test. The FDR was then calculated by the Benjamini–Hochberg procedure. Protein inference was then assigned using Proteome Discoverer (2.1) using Sequest and Mascot. Xenotransplantation survival curves were compared with Log-rank (Mantel-Cox) tests. All reported P values were two-sided, and those <0.05 were considered statistically significant. All statistical analyses were performed using GraphPad Prism Version 7 (GraphPad Software Inc.) and the R software v3.2.3.
Reporting Summary.
Further information on research design is available in the Nature Research Reporting Summary linked to this article.
Extended Data
Extended Data Fig. 1 |. Recurrent mutation and copy number alterations (CNAs) of DLBCL.

a, Frequencies and type of mutations identified by deep targeted sequencing in 57 recurrently mutated genes in 347 DLBCL tumors. Genes significantly enriched in ABC-DLBCL and GCB-DLBCL are highlighted in blue and orange, respectively. Colored asterisks represent the pathways to which mutations belong. b, Significant (q-value<0.25) focal amplifications (red) and deletions (blue) identified by GISTIC 2.0 analysis (n = 338). Representative genes (functionally known in DLBCL, as well as other cancers) within significant GISTIC regions are annotated. Genes significantly enriched in ABC-DLBCL and GCB-DLBCL are highlighted in blue and orange, respectively. Colored asterisks represent the pathways to which CNAs belong.
Extended Data Fig. 2 |. Frequencies and prognostic effects of individual genetic alterations.

Mutated genes (frequency > 5%) and representative CNAs within GISTIC regions were evaluated. Frequencies of genetic alterations are depicted according to COO subtype. Genes significantly enriched (adjusted p < 0.10, two-sided fisher’s exact test) in ABC-DLBCL (blue) and GCB-DLBCL (orange) are highlighted (left panel). ⋆P < 0.05, ⋆⋆P < 0.01, ⋆⋆⋆P < 0.001 (adjusted by multiple test). Forest plot summarizes the results of univariate analyses (time-to progression (TTP)) for each genomic alteration, in all DLBCL (grey), in ABC-DLBCL (light blue) and in GCB-DLBCL (light-orange). Hazard ratios and 95% confidence intervals are shown. Yellow circles represent significant hazard ratios (p < 0.05) (right panel). HETD, heterozygous deletion; HOMD, homozygous deletion; AMP, amplification.
Extended Data Fig. 3 |. ATPase activity of ATP8A2-TMEM30A variants, and association of recurrent genetic alterations with TMEM30A mutation in DLBCL.

Human ATP8A2 was expressed with or without human TMEM30A or missense mutants in HEK293T cells. a, The expressed complex was purified on an ATP8A2 immunoaffinity column and the input and eluted samples were subjected to SDS gel electrophoresis and western blots were labeled for ATP8A2 with the Atp6C11 and Cdc50-7F4 antibodies. Cropped images from the same Western blot are shown. Tubulin was detected as a loading control for the input lanes. Independent experiments were repeated twice with similar results. Source Data Extended Fig. 3. b, ATPase activity is measured as nmols of ATP hydrolyzed per 30 min at 37 °C. ATPase activities of the isolated complexes were measured in either 100% dioleylphosphatidylcholine (PC) or a mixture of 80% dioleoylphosphatidylcholine: 20% dioleylphosphatidylserine (PS). Samples are: ATP8A2 - expression in the absence of expressed TMEM30A; ATP8A2/WT - co-expression of ATP8A2 with WT- TMEM30A; and ATP8A2/ W41L, ATP8A2/C94R, ATP8A2/D181Y. Graphs represent mean values ± s.d. (n = 3). c, Distributions of genetic alterations of TNFAIP3, PRDM1 and EPHA7 in the patients with TMEM30A mutation and deletion. The header includes status of TMEM30A mutation and heterozygous deletion. MT; mutation, CN; copy number. d, Distributions of recurrent mutation, COO subtypes and IPI groups in TMEM30A mutated and wild type DLBCL patients. The header includes the status of TMEM30A mutation and CNAs.
Extended Data Fig. 4 |. Prevalence and clinical impact of TMEM30A mutation.
a, b, Deep targeted sequencing data of transformed FL samples with TMEM30A mutation detected at the time of diagnosis or transformation (A). The affected positions of the TMEM30A are visualized in an integrative genomic viewer. Variant allelic frequencies are visualized in the pie charts per case (B). Those data demonstrate a fraction of variants at the time of diagnosis (upper row) and transformation (lower row). The number in the pie charts represents the coverage of sequencing. FL1179 exhibited the opposite pattern (T1-positive/T2-negative), however the variant was a missense mutation supported by relatively low coverage (five reads out of 81 (VAF=6%). (c–e) Subtype analysis of survival according to TMEM30A genetic alteration. Kaplan Meier curves represent TTP (upper) and OS (bottom) according to TMEM30A mutation in ABC-DLBCL (C), in GCB-DLBCL (D) and in IPI-low/low-intermediate group (E). P values were derived from two-sided log-rank test.
Extended Data Fig. 5 |. mRNA expression of TMEM30A, related flippases, scramblases and P4-ATPases in in vitro TMEM30A knockout cells.

a, A screenshot of a representative sequence trace file of a CRISPR-generated TMEM30A frameshift mutation in exon 1 (DOHH-2, MUT1). b, TMEM30A mRNA expression is reduced in 3 unique bi-allelic frame-shift mutations in Karpas422, compared with parental and single cell enriched controls. mRNA expression is normalized to GAPDH expression. Graphs represent mean values ± s.d. (n = 3). (c) mRNA expression of TMEM30A is ‘rescued’ in one unique bi-allelic TMEM30A mutant, by ectopically expressing a stable insertion of a TMEM30A cDNA. Graphs represent mean values ± s.d. (n = 3). d, mRNA levels of different scramblases (PLSCR1-5; ANO1-10, XKR1-9), flippases (TMEM30A-C) and P4-ATPases in Karpas422 (left panel) and NUDUL-1 (right panel) native (WT, CON) and TMEM30A−/− (MUT) cell lines. Protein family members are categorized, and the heat map values show log-normalized expression by RNA-seq. e, XKR8 and ANO6 mRNA expression is reduced in 3 unique bi-allelic (XKR8) and mono-allelic (ANO6) frame-shift mutations in TMEM30A−/− and wildtype controls. mRNA expression is normalized to GAPDH expression. Graphs represent mean values ± s.d. (n = 3). All P values are based on a paired two-tailed Student’s t test.
Extended Data Fig. 6 |. BCR activation, mobility and clustering in NU-DUL-1 and DOHH-2 as measured by single particle tracking analysis.

a, Single-state diffusion coefficients and b, confinement-diameters are shown for both cell lines, and c, BCR tracks and d, transition rates are measured for DOHH-2. The dots indicate median values; lines indicate 95% confidence intervals ((n=3, DOHH-2) (n = 2, NU-DUL-1). (E-F) TMEM30A mutation does not alter CD19 diffusion and confinement diameters. Cells were labelled with anti-CD19 Fab-Cy3, settled onto poly-l-lysine coated coverslips and imaged for 10 s at 33 Hz. e, Single-state diffusion coefficients were calculated for all tracks and cumulative frequency curves are shown. The dots on the curves indicate the median values and are reported in brackets. Total number of tracks analyzed in each condition is shown above the plot. (f) The cumulative frequency curves of the confinement-diameters with the median values (dots on the curves) indicated in brackets. g, BCR activation of DLBCL cell lines following incubation with F(ab)2 fragments does not lead to an increase in apoptotic signaling through caspase 3 activation, measurable by western blot analysis. Cells (Karpas422) pretreated with vincristine were included as a positive control. Cropped images from the same Western blot are shown. B-actin is used as a loading control. Experiments were repeated independently three times with similar results. Source Data Extended Fig. 6. h, Ca2+ mobilization was measured in wild type (WT) and TMEM30A−/− NU-DUL-1, DOHH-2 and Karpas422 cells, following HBSS, F(ab)2 addition (10 and 40 μg/ml) and ionomycin. Graphs represent mean values ± s.d. (n = 3). Significance is evaluated using one-way ANOVA.
Extended Data Fig. 7 |. B-cell signalling following ibrutinib treatment in B cell lymphoma lines with TMEM30A loss-of-function mutation.

a, DOHH-2 toxicity of ibrutinib after 24 hours incubation. Toxicity between wildtype (red line) and TMEM30A−/− (blue line) was measured by WST1 colormetric assays (mean of triplicate is shown). P value is based on an unpaired two-tailed Student’s t test. b, Comparisons of CRISPR screen score (CSS) between ibrutinib-sensitive vs -resistance cell lines in publicly available dataset. CSS was defined as the number of standard deviations away from the average effect of inactivating a gene. The differences of CSS in TMEM30A-tageting was not observed, while there are strong differences of CSS in other genes known to be involved in the determination of ibrutinib-sensitivity (for example MYD88, MEF2B etc) c, Ca2+ mobilization was measured in wildtype (WT) and TMEM30A−/− DOHH-2 cells, following HBSS, F(ab)2 and ionomycin, with or without (UT) overnight pretreatment with ibrutinib. Graphs represent mean values ± s.d. (n = 3 (HBSS), n = 6 (F(ab)2), n = 3 (iono)). d, Effects of ibrutinib pretreatment on F(ab)2 fragment PS exposure in DOHH-2 TMEM30A−/− and native control, measured by annexin V-APC binding. Addition of ibrutinib to F(ab)2 fragment stimulated TMEM30A−/− cells shows a significant reduction in PS exposure. Graphs represent mean values ± s.d. (n = 4). P value is based on a two-way ANOVA test. e, Induction of CD25 (left panel) and CD23 (right panel) following BCR activation in Karpas422 cell lines with (MUT) or without (CON) a biallelic loss-of function in TMEM30A. Surface marker expression was measured by flow cytometry, using protein specific antibodies. Graphs represent mean values ± s.d. (n = 3 (CD25), n = 5 (CD23)). P value is based on an unpaired two-tailed Student’s t test. f, Activation by phosphorylation of AKT and ERK1/2 in Karpas422 and NU-DUL-1 native and TMEM30A−/− cells, detected by Western blot analysis, following overnight F(ab)2 fragment stimulation. Cropped images from the same Western blot are shown. Unphosphorylated AKT or ERK1/2 is used as a loading control. Experiments were repeated independently three times with similar results. Source Data Extended Fig. 7.
Extended Data Fig. 8 |. TMEM30A loss-of-function enhanced survival and increased macrophage engulfment following vincristine and CD47 blockade treatment.
a, Proliferation rates of native (blue line) and TMEM30A−/− (red line) DOHH-2 cells, measured over 3 days by WST1 absorbance. Cell numbers were extrapolated from a WST1 standard curve, using known quantities of DOHH-2. P value is based on an unpaired two-tailed Student’s t test. b, Xenotransplantation models of DOHH-2 cells with parental or TMEM30A−/− subcutaneously injected into NSG mice (5 per group). Vincristine treatment (0.1 mg/kg) or saline control (untreated) was administered when tumor volumes per group reached 100 mm3. Line graphs show tumor growth (mm3) over time (days). Graphs represent mean values ± s.d. P values are based on a paired two-tailed Student’s t test. ⋆P<0.05. c, The comparison of macrophage counts in tumor tissue from untreated DOHH-2 xenotransplantation models, visualized by CD68 antibody with H&E counter staining, per tissue within randomly selected 400x high power field regions per tumor from 3 separate mice per group. Graphs represent mean values ± s.d. (n = 12 (control), n = 18 (MT)). P values are based on a paired two-tailed Student’s t test. d, Xenotransplantation models of DOHH-2 cells with parental or TMEM30A−/− subcutaneously injected into NSG mice (10 per group). TTI-621 treatment (10 mg/kg) or TTI-402 (6.67 mg/kg) was initiated when tumor volumes per group reached 100 mm3. Normalized mean tumor growth (mm3) over time (days) starting at injection time. Graphs represent mean values ± s.d. P values are based on a paired two-tailed Student’s t test. ⋆P<0.05, ⋆⋆P<0.01.
Extended Data Fig. 9 |. In vitro and in vivo macrophage association and infiltration of A20 Tmem30A loss-of-function in Balb/c.

a, Syngeneic mouse modeling in Balb/c mice with Tmem30a−/− or wildtype (Tmem30a+/+) A20 cells. Proliferation rates of Tmem30a−/− (red line) and wildtype (blue line) A20 cells, measurable over 4 days by WST1 absorbance. P values are based on an unpaired two-tailed Student’s t test (n = 6). b, Comparison of PS exposure in Tmem30a−/− or wildtype A20 cells, measured by annexin V-APC binding. Graphs represent mean values ± s.d. (n = 8) P values are based on an unpaired two-tailed Student’s t test. c, Syngeneic mouse models of A20 cells with wildtype or Tmem30a−/− cells intravenously injected into Balb/c mice (5 per group). Kaplan-Meier plots show overall survival of Balb/c inoculated mice. P value is based on a Mantel-Cox test. d, Organ weight of livers from Balb/c mice intravenously injected with Tmem30a−/− or wildtype cells. All mice were sacked at the first presentation of abdominal distention in the control group (‘early sac’). Graphs represent mean values ± s.d. (n = 5). P values are based on an unpaired two-tailed Student’s t test. (E-F) Observation of tumor infiltrate in mice injected with Tmem30a−/− or wildtype cells at early sac. e, Blue or red filled column indicates positive tumor infiltration in wildtype or Tmem30a−/− cells, with blank indicating no tumor infiltration. f, H&E staining of each organ at early sac (liver, spleen, lung, and bone marrow) with inset of B220 IHC in the lung specimen. N = 5 mice per group. g, The comparison of macrophage counts in tumor tissue from subcutaneous injected A20 Tmem30a−/− and wildtype cells, visualized by F4/80 antibody with H&E counter staining, per tissue within 3 randomly selected 400x high power field regions per tumor from 3 separate mice per group. Graphs represent mean values ± s.d. P values are based on an unpaired two-tailed Student’s t test. h, i, Comparison of gene expression between tumor tissue from Tmem30a−/− and control injection groups. (N = 3 RNA samples from each mouse group). To generate P values (padj/FDR), we used a Wald test of the coefficients fit with a negative binomial GLM. The P values are two-sided and have all been adjusted for multiple comparisons using the Benjamini-Hochberg method. (H) Volcano plot of difference in gene expression between Tmem30a−/− and control groups (x-axis; log2 fold change of difference) and significance (y-axis). Red dots show the genes with significant difference (FDR < 0.05). (I) Dot plots show gene expression (FPKM) of Il4i1, Tmem30a and Xkr5 between Tmem30a−/− and control groups.
Supplementary Material
Acknowledgements
This study was supported by a Program Project Grant from the Terry Fox Research Institute (R.D.G, grant no. 1023; C.S., grant no. 1061), a Large Scale Applied Research Project (LSARP) from Genome Canada (C.S., grant no. 13124), Genome British Columbia (C.S., 271LYM), Canadian Institutes of Health Research (CIHR) (C.S., GP1-155873) and the British Columbia Cancer Foundation (BCCF). D.E. was supported by fellowships from the Michael Smith Foundation for Health Research (MSFHR), Canadian Institutes of Health Research (CIHR) and Japanese Society for The Promotion of Science. D.W.S. is supported by the British Columbia Cancer Foundation (BCCF) and the Michael Smith Foundation for Health Research (MSFHR). J.M.C. was the Clinical Director of the British Columbia Cancer Agency Centre for Lymphoid Cancer and received research funding support from the Terry Fox Research Institute, Genome Canada, Genome British Columbia, CIHR and the BCCF. C.H. was supported by the Alfred Benzon foundation. A.M. is supported by fellowships from the Mildred-Scheel-Cancer-Foundation (German Cancer Aid), the MSFHR and Lymphoma Canada. E.V. is supported by a fellowship from the Michael Smith Foundation for Health Research. G.V.C.F is supported by an NSERC Discovery grant. R.D.M. is funded by a CIHR New Investigator Award. M.A.M. is UBC Canada Research Chair in Genome Science and is pleased to acknowledge support from CIHR (FDN-143288) and the Terry Fox Research Institute. S.P.S. holds the Canada Research Chair in Computational Cancer Genomics, is a MSFHR scholar, holds a CIHR Foundation grant and acknowledges support from the BCCF. T.A. was supported by the Japanese Society for the Promotion of Science and the Uehara Memorial Foundation. T.A. received research funding support from The Kanae Foundation for the Promotion of Medical Science. L.A., as well as the experiments carried out by L.A., were supported by CIHR grant PJT-152946 (to M.R.G.). R.S.M holds a Canada Research Chair in Vision and Macular Degeneration and acknowledges support from CIHR (PJT-148649). K.T. was supported by fellowships from the Uehara Memorial Foundation. We thank E. Toombs for assistance in performing research, analyzing and interpreting data.
Competing interests
D.W.S., J.M.C. and R.D.G. are inventors on a patent held by the National Cancer Institute that has been licensed by NanoString Technologies. C.S. has performed consultancy for Seattle Genetics, Curis Inc., Roche, AbbVie, Juno Therapeutics and Bayer, and has received research funding from Bristol-Myers Squibb and Trillium Therapeutics Inc. D.W.S. has performed consultancy for Janssen and Celgene and has received research funding from Roche/Genentech, Janssen and NanoString Technologies. R.D.G. has performed consultancy for Celgene. R.K. received travel support from Roche. D.V., A.S.G, K.J.S., J.M.C., L.H.S. and D.W.S. received institutional research funding from Roche. L.H.S. has performed consultancy and received honoraria from Amgen, Abbvie, Apobiologix, Celgene, Lundbeck, Janssen, Karyopharm, TG Therapeutics, Roche/Genentech, Teva and Takeda. K.J.S. received honoraria and provided consultancy to Bristol-Myers Squibb, Merck, Takeda, Verastem and Servier. A.S.G. received honoraria and provided consultancy to Janssen, AbbVie and Seattle Genetics. D.V. received honoraria from and participated in advisory boards for: Roche, Abbvie, Celgene, Seattle Genetics, Lundbeck, AstraZeneca, Nanostring, Janssen and Gilead.
Footnotes
Extended data is available for this paper at https://doi.org/10.1038/s41591–020-0757-z.
Supplementary information is available for this paper at https://doi.org/10.1038/s41591-020-0757-z.
Online content
Any methods, additional references, Nature Research reporting summaries, source data, extended data, supplementary information, acknowledgements, peer review information; details of author contributions and competing interests; and statements of data and code availability are available at https://doi.org/10.1038/s41591-020-0757-z.
Data availability
Full data, including patient characteristics, mutation data and experimental data, are provided as Supplementary Tables 2, 3, 8 and 9) and in our previous paper49. The raw sequencing data have been deposited in the European Genome-phenome Archive (EGA) under accession number EGAS00001002657. Source data for Fig. 5b and Extended Data Figs. 3a, 6g and 7f are presented with the paper.
References
- 1.Swerdlow SH et al. The 2016 revision of the World Health Organization (WHO) classification of lymphoid neoplasms. Blood 127, 2375–2390 (2016). [DOI] [PMC free article] [PubMed] [Google Scholar]
- 2.Coiffier B et al. CHOP chemotherapy plus rituximab compared with CHOP alone in elderly patients with diffuse large-B-cell lymphoma. N. Engl. J. Med 346, 235–242 (2002). [DOI] [PubMed] [Google Scholar]
- 3.Sehn LH et al. Introduction of combined CHOP plus rituximab therapy dramatically improved outcome of diffuse large B-cell lymphoma in British Columbia. J. Clin. Oncol 23, 5027–5033 (2005). [DOI] [PubMed] [Google Scholar]
- 4.Alizadeh AA et al. Distinct types of diffuse large B-cell lymphoma identified by gene expression profiling. Nature 403, 503–511 (2000). [DOI] [PubMed] [Google Scholar]
- 5.Rosenwald A et al. The use of molecular profiling to predict survival after chemotherapy for diffuse large-B-cell lymphoma. N. Engl. J. Med 346, 1937–1947 (2002). [DOI] [PubMed] [Google Scholar]
- 6.Shipp MA et al. Diffuse large B-cell lymphoma outcome prediction by gene-expression profiling and supervised machine learning. Nat. Med 8, 68–74 (2002). [DOI] [PubMed] [Google Scholar]
- 7.Morin RD et al. Frequent mutation of histone-modifying genes in non-Hodgkin lymphoma. Nature 476, 298–303 (2011). [DOI] [PMC free article] [PubMed] [Google Scholar]
- 8.Pasqualucci L et al. Analysis of the coding genome of diffuse large B-cell lymphoma. Nat. Genet 43, 830–837 (2011). [DOI] [PMC free article] [PubMed] [Google Scholar]
- 9.Lohr JG et al. Discovery and prioritization of somatic mutations in diffuse large B-cell lymphoma (DLBCL) by whole-exome sequencing. Proc. Natl Acad. Sci. USA 109, 3879–3884 (2012). [DOI] [PMC free article] [PubMed] [Google Scholar]
- 10.Zhang J et al. Genetic heterogeneity of diffuse large B-cell lymphoma. Proc. Natl Acad. Sci. USA 110, 1398–1403 (2013). [DOI] [PMC free article] [PubMed] [Google Scholar]
- 11.Reddy A et al. Genetic and functional drivers of diffuse large B cell lymphoma. Cell. 171, 481–494.e15 (2017). [DOI] [PMC free article] [PubMed] [Google Scholar]
- 12.Chapuy B et al. Molecular subtypes of diffuse large B cell lymphoma are associated with distinct pathogenic mechanisms and outcomes. Nat. Med 24, 679–690 (2018). [DOI] [PMC free article] [PubMed] [Google Scholar]
- 13.Schmitz R et al. Genetics and pathogenesis of diffuse large B-cell lymphoma. N. Engl. J. Med 378, 1396–1407 (2018). [DOI] [PMC free article] [PubMed] [Google Scholar]
- 14.Ding J et al. Systematic analysis of somatic mutations impacting gene expression in 12 tumour types. Nat. Commun 6, 8554 (2015). [DOI] [PMC free article] [PubMed] [Google Scholar]
- 15.Lopez-Marques RL, Theorin L, Palmgren MG & Pomorski TG P4-ATPases: lipid flippases in cell membranes. Pflugers Arch. Eur. J. Physiol 466, 1227–1240 (2014). [DOI] [PMC free article] [PubMed] [Google Scholar]
- 16.van der Mark VA, Oude Elferink RPJ & Paulusma CC P4 ATPases: flippases in health and disease. Int. J. Mol. Sci 14, 7897–7922 (2013). [DOI] [PMC free article] [PubMed] [Google Scholar]
- 17.Coleman JA & Molday RS Critical role of the β-subunit CDC50A in the stable expression, assembly, subcellular localization, and lipid transport activity of the P4-ATPase ATP8A2. J. Biol. Chem 286, 17205–17216 (2011). [DOI] [PMC free article] [PubMed] [Google Scholar]
- 18.Puts CF & Holthuis JCM Mechanism and significance of P4 ATPasecatalyzed lipid transport: lessons from a Na+/K+-pump. Biochim. Biophys. Acta - Mol. Cell Biol. Lipids 1791, 603–611 (2009). [DOI] [PubMed] [Google Scholar]
- 19.Segawa K, Kurata S & Nagata S The CDC50A extracellular domain is required for forming a functional complex with and chaperoning phospholipid flippases to the plasma membrane. J. Biol. Chem 293, 2172–2182 (2018). [DOI] [PMC free article] [PubMed] [Google Scholar]
- 20.Kridel R et al. Histological transformation and progression in follicular lymphoma: a clonal evolution study. PLoS Med. 13, e1002197 (2016). [DOI] [PMC free article] [PubMed] [Google Scholar]
- 21.Segawa K et al. Caspase-mediated cleavage of phospholipid flippase for apoptotic phosphatidylserine exposure. Science 344, 1164–1168 (2014). [DOI] [PubMed] [Google Scholar]
- 22.Treanor B B-cell receptor: from resting state to activate. Immunology 136, 21–27 (2012). [DOI] [PMC free article] [PubMed] [Google Scholar]
- 23.Treanor B et al. The membrane skeleton controls diffusion dynamics and signaling through the B cell receptor. Immunity 32, 187–199 (2010). [DOI] [PMC free article] [PubMed] [Google Scholar]
- 24.Mattila PK et al. The actin and tetraspanin networks organize receptor nanoclusters to regulate B cell receptor-mediated signaling. Immunity 38, 461–474 (2013). [DOI] [PubMed] [Google Scholar]
- 25.Mattila PK, Batista FD & Treanor B Dynamics of the actin cytoskeleton mediates receptor cross talk: an emerging concept in tuning receptor signaling. J. Cell Biol 212, 267–280 (2016). [DOI] [PMC free article] [PubMed] [Google Scholar]
- 26.Freeman SA et al. Toll-like receptor ligands sensitize B-cell receptor signalling by reducing actin-dependent spatial confinement of the receptor. Nat. Commun 6, 6168 (2015). [DOI] [PMC free article] [PubMed] [Google Scholar]
- 27.Das R, Cairo CW & Coombs D A hidden Markov model for single particle tracks quantifies dynamic interactions between LFA-1 and the actin cytoskeleton. PLoS Comput. Biol 5, e1000556 (2009). [DOI] [PMC free article] [PubMed] [Google Scholar]
- 28.Phelan JD et al. A multiprotein supercomplex controlling oncogenic signalling in lymphoma. Nature 560, 387–391 (2018). [DOI] [PMC free article] [PubMed] [Google Scholar]
- 29.Suzuki J, Umeda M, Sims PJ & Nagata S Calcium-dependent phospholipid scrambling by TMEM16F. Nature 468, 834–838 (2010). [DOI] [PubMed] [Google Scholar]
- 30.Hankins HM, Baldridge RD, Xu P & Graham TR Role of flippases, scramblases and transfer proteins in phosphatidylserine subcellular distribution. Traffic 16, 35–47 (2015). [DOI] [PMC free article] [PubMed] [Google Scholar]
- 31.Birge RB et al. Phosphatidylserine is a global immunosuppressive signal in efferocytosis, infectious disease, and cancer. Cell Death Differ. 23, 962–978 (2016). [DOI] [PMC free article] [PubMed] [Google Scholar]
- 32.Nagata S, Suzuki J, Segawa K & Fujii T Exposure of phosphatidylserine on the cell surface. Cell Death Differ. 23, 952–961 (2016). [DOI] [PMC free article] [PubMed] [Google Scholar]
- 33.Segawa K & Nagata S An apoptotic ‘eat me’ signal: phosphatidylserine exposure. Trends Cell Biol. 25, 639–650 (2015). [DOI] [PubMed] [Google Scholar]
- 34.Suzuki J, Imanishi E & Nagata S Xkr8 phospholipid scrambling complex in apoptotic phosphatidylserine exposure. Proc. Natl Acad. Sci. USA 113, 9509–9514 (2016). [DOI] [PMC free article] [PubMed] [Google Scholar]
- 35.Suzuki J, Denning DP, Imanishi E, Horvitz HR & Nagata S Xk-related protein 8 and CED-8 promote phosphatidylserine exposure in apoptotic cells. Science 341, 403–406 (2013). [DOI] [PubMed] [Google Scholar]
- 36.Suzuki J, Imanishi E & Nagata S Exposure of phosphatidylserine by Xk-related protein family members during apoptosis. J. Biol. Chem 289, 30257–30267 (2014). [DOI] [PMC free article] [PubMed] [Google Scholar]
- 37.Petrova PS et al. TTI-621 (SIRPαFc): a CD47-blocking innate immune checkpoint inhibitor with broad antitumor activity and minimal erythrocyte binding. Clin. Cancer Res 23, 1068–1079 (2017). [DOI] [PubMed] [Google Scholar]
- 38.Barclay AN & van den Berg TK The interaction between signal regulatory protein alpha (SIRPα) and CD47: structure, function, and therapeutic target. Annu. Rev. Immunol 32, 25–50 (2014). [DOI] [PubMed] [Google Scholar]
- 39.Gagnon E, Schubert DA, Gordo S, Chu HH & Wucherpfennig KW Local changes in lipid environment of TCR microclusters regulate membrane binding by the CD3ε cytoplasmic domain. J. Exp. Med 209, 2423–2439 (2012). [DOI] [PMC free article] [PubMed] [Google Scholar]
- 40.Elliott JI et al. Phosphatidylserine exposure in B lymphocytes: a role for lipid packing. Blood 108, 1611–1617 (2006). [DOI] [PubMed] [Google Scholar]
- 41.Elliott JI et al. Membrane phosphatidylserine distribution as a non-apoptotic signalling mechanism in lymphocytes. Nat. Cell Biol 7, 808–816 (2005). [DOI] [PubMed] [Google Scholar]
- 42.Raghupathy R et al. Transbilayer lipid interactions mediate nanoclustering of lipid-anchored proteins. Cell 161, 581–594 (2015). [DOI] [PMC free article] [PubMed] [Google Scholar]
- 43.Andersen JP et al. P4-ATPases as phospholipid flippases-structure, function, and enigmas. Front. Physiol 7, 275 (2016). [DOI] [PMC free article] [PubMed] [Google Scholar]
- 44.Van Blitterswijk WJ & Verheij M Anticancer mechanisms and clinical application of alkylphospholipids. Biochim. Biophys. Acta 1831, 663–674 (2013). [DOI] [PubMed] [Google Scholar]
- 45.Moreno-Smith M et al. ATP11B mediates platinum resistance in ovarian cancer. J. Clin. Invest 123, 2119–2130 (2013). [DOI] [PMC free article] [PubMed] [Google Scholar]
- 46.Advani R et al. CD47 blockade by Hu5F9-G4 and rituximab in non-Hodgkin’s lymphoma. N. Engl. J. Med 379, 1711–1721 (2018). [DOI] [PMC free article] [PubMed] [Google Scholar]
- 47.WHO Classification of Tumours of Haematopoietic and Lymphoid Tissues Vol. 2 (eds Swerdlow SH et al.) Ch. 10 (IARC Press, 2008). [Google Scholar]
- 48.Ennishi D et al. Genetic profiling of MYC and BCL2 in diffuse large B-cell lymphoma determines cell-of-origin-specific clinical impact. Blood 129, 2760–2770 (2017). [DOI] [PubMed] [Google Scholar]
- 49.Ennishi D et al. Double-hit gene expression signature defines a distinct subgroup of germinal center B-cell-like diffuse large B-cell lymphoma. J. Clin. Oncol 37, 190–201 (2019). [DOI] [PMC free article] [PubMed] [Google Scholar]
Associated Data
This section collects any data citations, data availability statements, or supplementary materials included in this article.
Supplementary Materials
Data Availability Statement
Full data, including patient characteristics, mutation data and experimental data, are provided as Supplementary Tables 2, 3, 8 and 9) and in our previous paper49. The raw sequencing data have been deposited in the European Genome-phenome Archive (EGA) under accession number EGAS00001002657. Source data for Fig. 5b and Extended Data Figs. 3a, 6g and 7f are presented with the paper.